Abstract
Objective
Sepsis, a leading cause of mortality in critically ill patients, is closely linked to the excessive activation of coagulation and inflammation. Protein Z (PZ), a cofactor for the protein Z-dependent protease inhibitor (ZPI), enhances the inhibition of coagulation factor Xa and ZPI inhibits factor XIa in a PZ-independent fashion. The functions of PZ and ZPI in the inflammatory and coagulant responses to septic illness have not been evaluated.
Design
For induction of generalized Shwartzman reaction (GSR), dorsal skinfold chamber-equipped mice were challenged twice with lipopolysaccharide (0.05 mg/kg bw on day −1 and 5 mg/kg bw 24 h later). Time-matched control animals received equal volumes of saline.
Setting
University research laboratory.
Subjects, Interventions and Measurements
Using intravital fluorescence microscopy in ZPI-deficient (ZPI−/−) and PZ-deficient (PZ−/−) mice as well as their wild-type littermates (ZPI+/+, PZ+/+), kinetics of light/dye-induced thrombus formation and microhemodynamics were assessed in randomly chosen venules. Plasma concentrations of CXCL1, IL-6 and IL-10 were measured. Liver and lung were harvested for quantitative analysis of leukocytic tissue infiltration and thrombus formation.
Main Results
After induction of GSR, all mice showed significant impairment of microhemodynamics, including blood flow velocity, volumetric blood flow and functional capillary density as well as leukocytopenia and thrombocytopenia. Thrombus formation time was markedly prolonged after induction of GSR in all mice, except of ZPI−/− mice, which also had a significantly higher fraction of occluded vessels in liver sections. PZ−/− mice developed the highest concentrations of IL-6 and IL-10 in response to GSR and showed greater leukocytic tissue infiltration than their wild-type littermates.
Conclusions
In this murine model of GSR, ZPI deficiency enhanced the thrombotic response to vascular injury, whereas PZ deficiency increased inflammatory response.
Keywords: sepsis, inflammation, coagulation, cytokines, thrombosis, microcirculation
Introduction
The coagulation cascade plays an important role in sepsis by triggering a disseminated intravascular coagulation with microvascular thrombosis, tissue hypoperfusion and multiple organ failure (1). Therefore, therapeutic strategies directed at sepsis-related disordered coagulation and inflammation through the administration of natural anticoagulants, such as protein C and antithrombin, became a focus of interest (2-4). Protein Z (PZ) and protein Z-dependent protease inhibitor (ZPI, SerpinA10) also regulate coagulation, but their influence in sepsis has not been studied thus far.
PZ was initially identified by Prowse and Esnouf in bovine plasma in 1977 (5) and the human homologue subsequently isolated in 1984 (6). Human PZ is a 62 kDa vitamin K-dependent coagulation glycoprotein with a molecular structure similar to factors VII, IX, X and protein C (7). In contrast to these serine protease zymogens, however, PZ lacks catalytic activity (8). Instead, PZ serves as a cofactor for ZPI, a 72 kDa member of the serpin superfamily of protease inhibitors (9, 10). PZ and ZPI circulate as a complex in plasma (11). In the presence of Ca2+ and a phospholipid surface, PZ enhances ZPI inhibition of factor Xa (FXa) >1000-fold. In addition, ZPI inhibits factor XIa (FXIa) independent of PZ, Ca2+, and phospholipids (12, 13) and is the most potent FXIa inhibitor present in plasma (14).
PZ and ZPI deficiency have been shown to enhance thrombosis in mouse models (15, 16), but whether PZ and ZPI are involved in clinical thrombotic disease is controversial, with some, but not all, studies suggesting such a relationship (17-23). The aim of our study was to investigate the potential role of PZ and ZPI in the sepsis-associated activation of the inflammation and coagulation cascades. For this purpose, we studied inflammatory parameters and thrombus formation in PZ and ZPI gene-disrupted mice following the induction of the generalized Shwartzman reaction (GSR).
Material and Methods
Mice
The experiments were conducted in accordance with the guidelines for the Care and Use of Laboratory Animals and the Institutional Animal Care and Use Committee (University of Rostock, Medical Faculty, Rostock, Germany). ZPI-deficient mice (ZPI−/−) and PZ-deficient mice (PZ−/−) in a C57Bl/6×129 genetic background, as described by Yin et al. and Zhang et al. (15, 16), were compared to their respective wild-type littermates (ZPI+/+ or PZ+/+). Male mice were used at an age of 3-6 months and a body weight of 25-35 g.
Genotyping of ZPI and PZ mice
All animals were genotyped for presence or absence of PZ and ZPI by PCR, as described by Yin et al. (15) and Zhang et al. (16) using genomic DNA isolated from the tail tip.
Implantation of the dorsal skinfold chamber
For the study of microvascular thrombus formation, we used the dorsal skinfold chamber, as originally described by Lehr et al. (24) in mice. On day −3 the dorsal skinfold chamber was prepared. The mice were anesthetized by an intraperitoneal injection of ketamine (90 mg/kg bw) and xylazine (25 mg/kg bw). Before the preparation, animals were placed on a 37°C heating pad. Briefly, a double skin layer on the back of the animal was implanted between two symmetric titanium frames. One skin layer was then completely removed in a circular area of 15 mm in diameter, and the remaining layers (consisting of striated skin muscle, subcutaneous tissue and skin) were covered with a glass coverslip incorporated into one of the titanium frames. Animals tolerated the chamber well and showed no signs of discomfort or changes of sleeping and feeding habits. In order to reduce surgical trauma-associated deterioration of the chamber microcirculation, the mice were allowed a recovery period of 3 days after implantation of the chamber.
Induction of GSR and tissue sampling
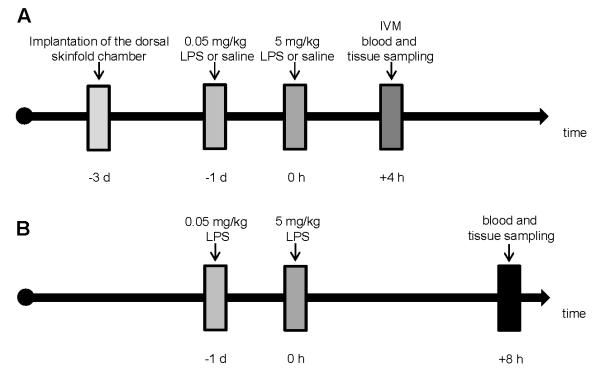
For induction of GSR, simulating the sepsis-associated disseminated intravascular coagulopathy (25), the mice were challenged by subcutaneous injection of 0.05 mg/kg bw of E. coli lipopolysaccharide (E. coli LPS; serotype O128:B12, Sigma, St Louis, MO, USA) at day −1 followed by intravenous injection of 5 mg/kg bw of LPS 24 hours later (Figure 1). Control animals were time-matched and exposed to equivalent volumes of physiological saline. Hemodynamic parameters and induction of thrombus formation were studied 4 hours after GSR induction (Figure 1A). In an additional set of mice, blood and tissue samples were taken after 8 hours of GSR to assess later symptoms during progression of GSR (Figure 1B). All animals survived the experimental time period of GSR. After collecting blood and tissue samples the mice were sacrificed by deep anesthesia.
Figure 1. Flow chart displaying the experimental protocol.
On day −3 the dorsal skinfold chamber was prepared. For induction of a generalized Shwartzman reaction (GSR), mice (ZPI+/+, ZPI−/−, PZ+/+, and PZ−/−) were challenged with a low dose (0.05 mg/kg bw) of LPS at day -1 and 24 h later with a higher dose of LPS (5 mg/kg bw). Control animals were exposed to equivalent volumes of physiological saline. After injection of FITC-labeled dextran, intravital fluorescence microscopy and induction of thrombosis was performed 4 hours later in the dorsal skinfold chamber preparation (A). In an additional set of mice, 8 hours after induction of GSR blood and tissue samples were harvested (B). Abbreviations: LPS, lipopolysaccharide; bw, body weight; IVM, intravital microscopy.
In vivo thrombosis model
After injection of 0.1 mL fluorescein isothiocyanate (FITC)-labeled dextran (2%; MW 150 kDa, Sigmal-Aldrich, Munich, Germany) into the retro-orbital venous plexus and subsequent circulation for 30 s, microcirculation of the striated muscle tissue was visualized by intravital fluorescence microscopy using a Zeiss microscope (Axiotech vario, Zeiss, Jena, Germany). The microscopic procedure was performed at a constant room temperature of 21-23°C. The epi-illumination setup included a 100-W HBO mercury lamp and a blue filter system (450-490/>520 nm excitation/emission wavelength). Microscopic images were recorded by a charge-coupled device video camera (FK 6990 IQ-S, Piper) and stored on videotapes for off-line evaluation (FUJIFILM Video Cassette, FUJI Magnetics GmbH). Prior to photochemical thrombus induction, capillary perfusion and microhemodynamics in randomly chosen venules (diameter range: 30-70 μm) were assessed by means of a ×20 objective (LUCPlanFL ×20/0.45 W, Olympus). Subsequently, photochemical thrombus formation was induced by continuous local exposure of filtered light (450-490/>520 nm excitation/emission wavelength) using a ×63 water immersion objective (Achroplanx63/0.95 W, Zeiss), as described previously by our group (26, 27). The light/dye thrombus model used is based on endothelial injury upon phototoxicity induced by exposure of FITC-dextran to excitation light. The phenomenon is mediated by reactive oxygen species, in particular singlet oxygen, generated by excitation of the fluorochrome. Light exposure was discontinued after blood flow in the vessel ceased for at least 60 s due to the complete vessel occlusion.
Quantitative microcirculation analysis
Microcirculatory parameters (red blood cell center line velocity, vessel diameter) were quantified off-line by analysis of the videotaped images using a computer-assisted image analysis system (CapImage, Zeintl Software, Heidelberg, Germany). Functional capillary density [cm/cm2] served as a parameter of microcirculatory perfusion and is defined by the length of all red blood cell perfused capillaries per region of interest. Analysis further included the determination of vascular wall shear rates based on the Newtonian definition γ=8*v/d given in [s−1], where d represents the individual inner vessel diameter and v represents the red blood cell centerline velocity divided by 1.6 according to the Baker-Wayland factor to correct the parabolic velocity profile in microvessels with diameters >20 μm (28) . Volumetric blood flow (vbf) was calculated by vbf=π*(d/2)2*v/1.6 and given in [pL/s].
Blood sampling
Systemic blood was obtained from the orbital sinus using capillary tubes transferred into EDTA tubes to assess blood parameters by means of a Sysmex KX-21 cell counter (Sysmex, Norderstedt, Germany). Subsequently blood samples were centrifuged at 3500 rpm for 10 minutes and the supernatant plasma was stored at −20°C.
Assays
Plasma concentrations of IL-6 and IL-10 were measured with commercially available ELISA kits from Thermo Fisher Scientific (Rockford, IL 61101, USA) following the manufacturer’s instructions. Plasma concentrations of chemokine (C-X-C motif) ligand 1 (CXCL1), representing the functional homologue of human IL-8 (29), were measured with a commercially available ELISA kit from R&D Systems (Abingdon OX14 3NB, UK).
Histology
Liver and lung tissues were fixed in 4% phosphate-buffered formalin for 1-2 days and embedded in paraffin. The paraffin-embedded tissue blocks were serially cut in 5 μm sections and stained with Naphthol AS-D Chloroacetate Esterase (CAE) and hematoxylineosin (HE). CAE-positive cells (CAE+-cells) were counted in 25 high-power fields (HPF) per section by using a light microscope (Olympus BX51, Plan N 40×/0.65 objective) and given as [n/HPF]. In liver tissues, the numbers of occluded vessels were analyzed and are given in percent of all vessels counted in each section by using a light microscope (Olympus BX51, Plan N 10×/0.25 objective). Vessels were defined as occluded if the vascular lumen was filled by densely packed erythrocytes.
Statistical analysis
All data are given as median and interquartile range (IQR; the 25% and 75% percentiles). Differences between groups were calculated using Mann-Whitney rank-sum test, followed by Bonferroni correction. Overall statistical significance was set at p<0.05 divided by the number of meaningful comparisons. The statistical power was calculated for each significance at α=0.05 with a level of 80%. Statistics, power calculation and graphics were performed using the software packages SigmaStat software version 3.5 and SigmaPlot software version 10.0 (Jandel Corporation, San Rafael, CA, USA).
Results
Microhemodynamics in mice upon induction of GSR
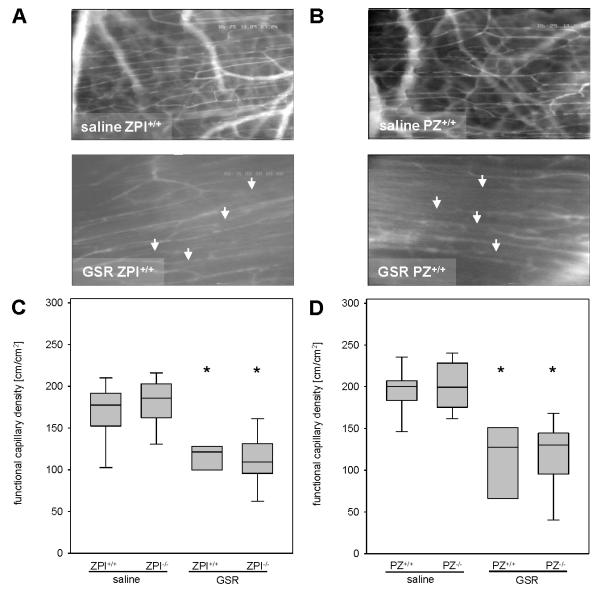
Systemic infections with circulating bacteria or LPS, as studied in the current model of GSR, are often associated with hemodynamic disorders. Microhemodynamics in both ZPI−/− and PZ−/− mice did not differ significantly to their wildtype littermates upon saline exposure (Table 1). At 4 hours after induction of GSR all mice revealed a marked reduction of blood flow velocity, volumetric blood flow and wall shear rate in both arterioles and venules (Table 1). There were no significant differences in the severity of microcirculatory dysfunction upon GSR in ZPI−/− or PZ−/− mice when compared to their littermates (Table 1). In addition, functional capillary density was found to be significantly reduced upon GSR induction in all experimental groups when compared to saline-treated controls (Figure 2) and no difference was observed in the extent of hypoperfusion between ZPI−/− and PZ−/− mice and their wild-type littermates.
Table 1.
Microhemodynamics in mice 4 hours after induction of GSR or exposure to physiological saline
| ZPI-mice | saline | GSR | |||
|---|---|---|---|---|---|
| ZPI+/+ | ZPI−/− | ZPI+/+ | ZPI−/− | ||
| n=11 | n=13 | n=11 | n=14 | ||
| median (IQR) | median (IQR) | median (IQR) | median (IQR) | ||
| arterioles |
velocity
[μm/s] |
948 (893-1011) | 943 (729-1047) | 642* (352-774) | 629* (475-696) |
| vbf [pL/s] | 898 (748-1112) | 829 (511-1025) | 580 (339-909) | 549 (253-694) | |
| γ [s−1] | 104 (85-122) | 115 (77-134) | 72 (40-100) | 74 (55-89) | |
| venules |
velocity
[μm/s] |
489 (249-628) | 546 (377-638) | 215 (76-337) | 202* (121-331) |
| vbf [pL/s] | 611 (285-876) | 550 (307-755) | 186 (58-401) | 227* (75-295) | |
| γ [s−1] | 61 (39-94) | 57 (41-78) | 25* (9-35) | 21* (16-30) | |
| PZ-mice | saline | GSR | |||
| PZ+/+ | PZ−/− | PZ+/+ | PZ−/− | ||
| n=12 | n=12 | n=11 | n=14 | ||
| median (IQR) | median (IQR) | median (IQR) | median (IQR) | ||
| arterioles |
velocity
[μm/s] |
858 (824-1025) | 1043 (720-1352) | 664 (437-788) | 597* (478-738) |
| vbf [pL/s] | 1088 (800-1290) | 1243 (1200- 1682) |
563* (431-649) | 743* (672-849) | |
| γ [s−1] | 86 (71-101) | 113 (66-121) | 73 (46-90) | 70 (45-78) | |
| venules |
velocity
[μm/s] |
617 (573-682) | 528 (492-613) | 149* (125-268) | 294* (172-337) |
| vbf [pL/s] | 954 (615-1273) | 670 (452-865) | 187* (109-362) | 310* (218-419) | |
| γ [s−1] | 62 (50-80) | 56 (49-68) | 22* (12-28) | 27* (14-36) | |
Data are given as median and IQR. Mann-Whitney rank-sum test, followed by Bonferroni correction;
p<0.05 vs. saline-treated mice with the same genetic background.
Abbreviations: ZPI, protein Z-dependent protease-inhibitor; PZ, protein Z; GSR, generalized Shwartzman reaction; velocity, blood flow velocity; vbf, volumetric blood flow; γ, wall shear rate; IQR, interquartile range.
Figure 2. Analysis of functional capillary density.
(A, B) Representative intravital fluorescence microscopic images (original magnification ×200) of regular perfused striated muscle capillaries after administration of saline (upper panel) and of GSR-induced perfusion failure of individual capillaries (arrows indicate non-perfused capillaries; lower panel). (C, D) Quantification of functional capillary density dependent on ZPI (C) or PZ (D) genotype. Data are given as box plots indicating the median with the 25th and 75th percentiles. Mann-Whitney rank-sum test, followed by Bonferroni correction; * p<0.05 vs. saline-treated mice within the same genetic background. Abbreviations: PZ, protein Z; ZPI, protein Z-dependent protease-inhibitor; GSR, generalized Shwartzman reaction. (GSR 4 hours: ZPI+/+ n=11, ZPI−/− n=14, PZ+/+ n=11, PZ−/− n=14; saline: ZPI+/+ n=11, ZPI−/− n=13, PZ+/+ n=12, PZ−/− n=12).
White blood cell, platelet and lymphocyte count in mice upon induction of GSR
After induction of GSR all mice showed significantly reduced white blood cell, platelet and lymphocyte counts compared to the saline-treated controls, indicating a marked leukocytopenia, thrombocytopenia and lymphocytopenia in mice with GSR (Table 2).
Table 2.
Systemic blood cell count in mice 4 hours after induction of GSR or exposure to physiological saline
| ZPI-mice | saline | GSR | ||
|---|---|---|---|---|
| ZPI+/+ | ZPI−/− | ZPI+/+ | ZPI−/− | |
| n=11 | n=13 | n=11 | n=14 | |
| median (IQR) | median (IQR) | median (IQR) | median (IQR) | |
| WBC [×109/l] | 6.3 (4.8-8.4) | 6.7 (5.5-9.3) | 1.6* (1.2-2.9) | 2.5* (1.3-4.0) |
| PLT [×109/l] | 530 (480-943) | 595 (529-821) | 371 (183-522) | 439* (298-540) |
| LYM [×109/l] | 3.9 (2.9-5.5) | 4.2 (3.5-5.5) | 0.7* (0.6-1.5) | 1.7* (0.8-2.8) |
| PZ-mice | saline | GSR | ||
| PZ+/+ | PZ−/− | PZ+/+ | PZ−/− | |
| n=12 | n=12 | n=11 | n=14 | |
| median (IQR) | median (IQR) | median | median (IQR) | |
| WBC [×109/l] | 6.4 (4.7-7.1) | 7.6 (6.2-8.3) | 2.2* (1.4-3.8) | 1.8* (1.5-3.3) |
| PLT [×109/l] | 964 (741-1225) | 806 (488-1035) | 385*(326-408) | 401* (307-565) |
| LYM [×109/l] | 3.4 (2.4-4.8) | 4.9 (3.5-5.8) | 1.3* (0.8-2.1) | 0.9* (0.7-1.9) |
Data are given as median and IQR. Mann-Whitney rank-sum test, followed by Bonferroni correction;
p<0.05 vs. saline-treated mice with the same genetic background.
Abbreviations: ZPI, protein Z-dependent protease-inhibitor; PZ, protein Z; GSR, generalized Shwartzman reaction; WBC, white blood cells; PLT, platelets; LYM, lymphocytes; IQR, interquartile range.
Thrombosis in mice upon induction of GSR
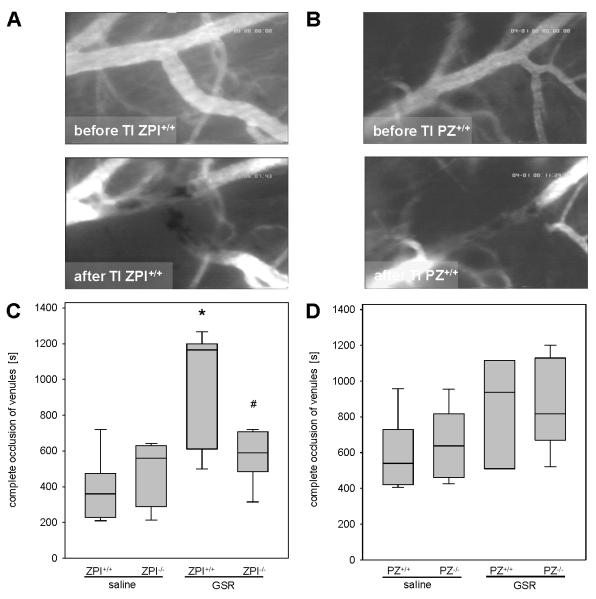
The induction of thrombus formation in the dorsal skinfold chamber preparation caused a complete vessel occlusion in all venules studied (Figure 3A and 3B). Median values of time for thrombus formation were found in the range of 360-638 s in all mice exposed to saline (Figure 3C and 3D). Following the induction of GSR, the thrombus formation time was significantly prolonged in ZPI+/+ mice (median 1165 s) compared to saline-treated animals. Importantly, occlusion times in ZPI−/− mice after induction of GSR were significantly lower (median 590 s) compared to their wild-type littermates (Figure 3C). Both, PZ+/+ and PZ−/− mice showed somewhat slightly prolonged thrombus formation times upon GSR induction when compared to the saline-treated controls with no significant differences between the PZ genotypes (Figure 3D).
Figure 3. Analysis of thrombus formation in the dorsal skinfold chamber.
(A, B) Images (original magnification ×200) display patency of postcapillary venules prior to thrombus formation (upper panel) and standstill of perfusion upon light/dye-induced thrombus formation due to complete vessel occlusion (lower panel) in ZPI+/+ (A) or PZ+/+ (B) mice. (C, D) The occlusion times in venules upon induction of GSR or exposure to physiological saline are quantified for ZPI (C) or PZ (D) mouse strains. Data are given as box plots indicating the median with the 25th and 75th percentiles. Mann-Whitney rank-sum test, followed by Bonferroni correction; * p<0.05 vs. saline-treated mice with the same genetic background, # p<0.05 vs. wild-type GSR mice. Abbreviations: PZ, protein Z; ZPI, protein Z-dependent protease-inhibitor; GSR, generalized Shwartzman reaction; TI, thrombus induction. (GSR 4 hours: ZPI+/+ n=11, ZPI−/− n=14, PZ+/+ n=11, PZ−/− n=14; saline: ZPI+/+ n=11, ZPI−/− n=13, PZ+/+ n=12, PZ−/− n=12).
Thrombus formation was also assessed in HE-stained liver tissue sections 8 hours following the induction of GSR (Figure 4A). The fraction of vessels with apparent thrombi was significantly greater in ZPI−/− (median 46.0%) compared to ZPI+/+ (median 26.5%) mice, whereas PZ+/+ (median 35.5%) and PZ−/− (median 22.0%) mice did not significantly differ with respect to intrahepatic microvascular thrombosis (Figure 4B). This result confirms the prothrombotic phenotype of ZPI deficiency seen with light/dye stimulation in the dorsal skinfold chamber preparations (Figure 3C).
Figure 4. Analysis of thrombus formation in HE-stained liver tissue.
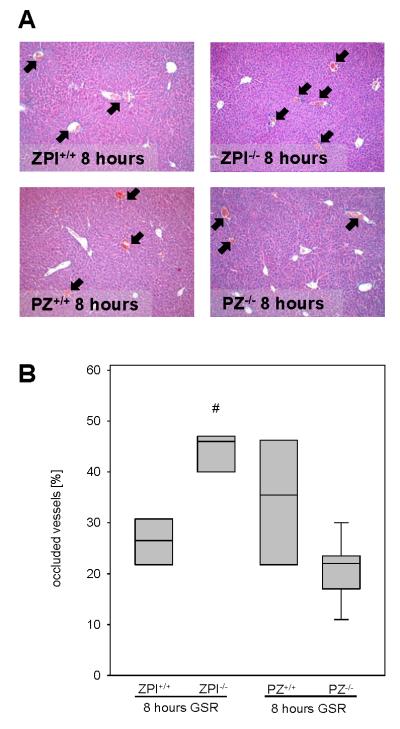
Representative images (A; original magnification ×100) display the magnitude of thrombus formation in liver tissue upon 8 hours of GSR (arrows). Thrombus formation is quantified as the fraction of occluded vessels in [%] of all vessels observed (B). Data are given as box plots indicating the median with the 25th and 75th percentiles. Mann-Whitney rank-sum test, followed by Bonferroni correction; # p<0.05 vs. wild-type GSR mice. Abbreviations: PZ, protein Z; ZPI, protein Z-dependent protease-inhibitor; GSR, generalized Shwartzman reaction; (GSR 8 hours: ZPI+/+ n=6, ZPI−/− n=7, PZ+/+ n=5, PZ−/− n=9).
Inflammatory response in mice upon induction of GSR
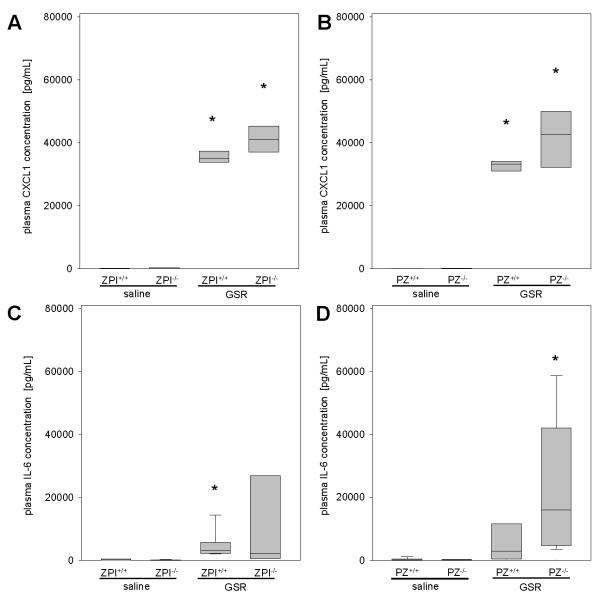
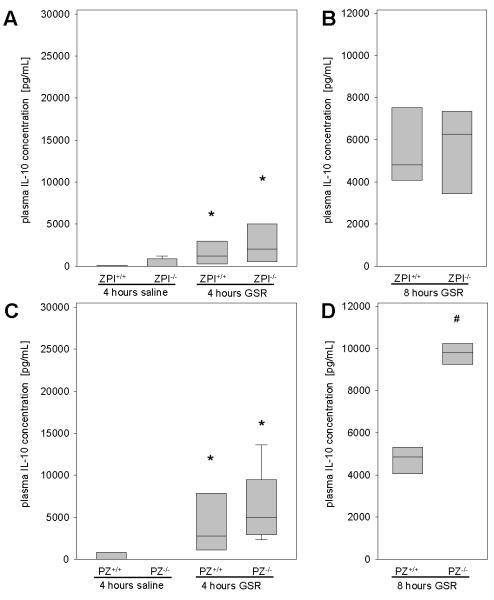
Due to the known interaction of coagulation and inflammation in septic illness, we assessed pro-inflammatory and anti-inflammatory cytokines. The pro-inflammatory cytokine CXCL1, a functional homologue of human IL-8, was barely detectable in saline-treated mice, and was significantly higher in all mice following the induction of GSR (Figure 5A and 5B). IL-6 as a classic pro-inflammatory cytokine was elevated upon GSR induction (Figure 5C and 5D) and the loss of ZPI function did not significantly influence the IL-6 plasma concentration (Figure 5C). In contrast, median plasma IL-6 concentrations were almost 5-fold higher in PZ−/− (median 15952 pg/mL) than in PZ+/+ (median 2800 pg/mL) mice (Figure 5D). At 8 hours after GSR induction, IL-6 levels increased further and were similar in mice of each genotype (ZPI+/+ mice: 79 (74-87) ng/mL, n=5; ZPI−/− mice: 66 (52-88) ng/mL, n=6; PZ+/+ mice: 72 (63-80) ng/mL, n=4; PZ−/− mice: 75 (69-85) ng/mL, n=8). Upon progression of septic illness, the initial pro-inflammatory reaction is followed by an anti-inflammatory response, termed compensatory anti-inflammatory response syndrome (CARS) (30). Therefore, we analyzed plasma concentrations of IL-10, one of the major anti-inflammatory cytokines (31), and observed that GSR induced significantly higher plasma concentrations of IL-10 within 4 hours in all mice compared to saline controls (Figure 6A and 6C). Median IL-10 concentrations were about 2-fold higher in PZ−/− (4992 pg/mL) than in PZ+/+ (2742 pg/mL) and ZPI−/− (2057 pg/mL) mice. At 8 hours of GSR the IL-10 concentrations were found to be further elevated in PZ−/− mice compared to PZ+/+ mice (Figure 6D). The plasma levels of IL-10 did not differ between ZPI−/− and ZPI+/+ mice at either the 4 or 8 hour time points (Figure 6A and 6B). These findings indicate a more pronounced compensatory anti-inflammatory response in GSR-exposed PZ−/− mice (Figure 6D).
Figure 5. Analysis of pro-inflammatory cytokines.
Plasma CXCL1 (A, B) and IL-6 concentrations (C, D) are quantified for ZPI or PZ mouse strains upon induction of GSR or exposure to physiological saline. Data are given as box plots indicating the median with the 25th and 75th percentiles. Mann-Whitney rank-sum test, followed by Bonferroni correction; * p<0.05 vs. saline-treated mice with the same genetic background. Abbreviations: PZ, protein Z; ZPI, protein Z-dependent protease-inhibitor; GSR, generalized Shwartzman reaction; IL-6, terleukin-6; CXCL1, chemokine (C-X-C motif) ligand 1. (GSR 4 hours: ZPI+/+ n=11, ZPI−/− n=14, PZ+/+ n=11, PZ−/− n=14; saline: ZPI+/+ n=11, ZPI−/− n=13, PZ+/+ n=12, PZ−/− n=12).
Figure 6. Analysis of IL-10 plasma concentrations.
IL-10 concentrations are quantified for ZPI (A, B) or PZ (C, D) mouse strains 4 (A, C) as well as 8 hours (B, D) after induction of GSR or exposure to physiological saline. Data are given as box plots indicating the median with the 25th and 75th percentiles. Mann-Whitney rank-sum test, followed by Bonferroni correction; * p<0.05 vs. saline-treated mice with the same genetic background, # p<0.05 vs. wild-type GSR mice. Abbreviations: PZ, protein Z; ZPI, protein Z-dependent protease-inhibitor; GSR, generalized Shwartzman reaction; IL-10, interleukin-10. (GSR 4 hours: ZPI+/+ n=11, ZPI−/− n=14, PZ+/+ n=11, PZ−/− n=14; saline: ZPI+/+ n=11, ZPI−/− n=13, PZ+/+ n=12, PZ−/− n=12; GSR 8 hours: ZPI+/+ n=5, ZPI−/− n=6, PZ+/+ n=4, PZ−/− n=8).
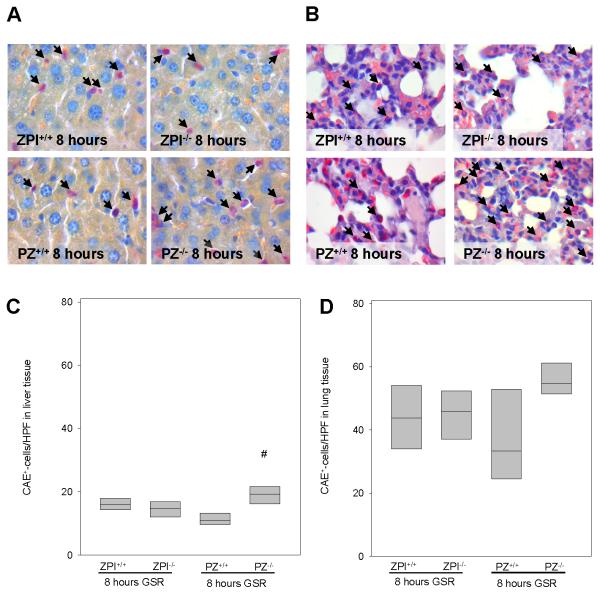
Leukocyte-endothelial cell interaction is crucial for defense of the organism against the pathogenic invasion (32). Upon activation, leukocytes attach to the endothelium and subsequently emigrate to the septic focus (33). Tissue infiltrating CAE+-leukocytes were detected in liver and lung after the induction of GSR (Figure 7A and 7B). In comparison to saline-treated controls (<5 CAE+-cells/HPF; data not shown), GSR induction increased the number of CAE+-leukocytes at 8 hours of GSR in the liver. Interestingly, a significantly higher number of liver tissue-infiltrating leukocytes were observed in PZ−/− mice after GSR induction when compared to wild-type littermates (Figure 7C). Analysis of lung tissue also revealed almost 2-fold higher numbers of infiltrating CAE+-leukocytes in PZ−/− mice when compared to PZ+/+ mice (Figure 7D). ZPI deficiency, however, had no influence on the number of CAE+-leukocytes both in liver and lung tissue (Figure 7C and 7D).
Figure 7. Tissue infiltration of leukocytes.
Representative images (original magnification ×1000) display the hepatic (A) und pulmonary (B) infiltration of CAE+-leukocytes (arrows) upon GSR. Infiltration of CAE+-cells is quantified in liver (C) and lung tissue (D) after 8 hours of GSR. Data are given as box plots indicating the median with the 25th and 75th percentiles. Mann-Whitney rank-sum test, followed by Bonferroni correction; # p<0.05 vs. wild-type GSR mice. Abbreviations: PZ, protein Z; ZPI, protein Z-dependent protease-inhibitor; GSR, generalized Shwartzman reaction. (GSR 8 hours: ZPI+/+ n=6, ZPI−/− n=7, PZ+/+ n=5, PZ−/− n=9).
Discussion
Methodological considerations
Several experimental models of sepsis have been developed, including the procedure of cecal ligation and puncture, colon ascendens stent peritonitis, the local inoculation of bacteria, as well as the induction of systemic endotoxemia (34, 35). Although there are shortcomings and limitations associated with the use of LPS (34, 35), LPS administration has clear advantages in terms of reproducibility and definition of the septic insult. Though not validly reflecting sepsis, LPS simulates the pathophysiology of endotoxemia (34). Moreover, the double-hit endotoxin-induced Shwartzman reaction, as used and termed GSR in the current study, has been considered to be a well-suited model to study sepsis-induced disseminated intravascular coagulopathy (24). The combination of GSR with the dorsal skinfold chamber model allows the assessment of microcirculatory dysfunction and microvascular thrombosis as key events driving the progression of endotoxin-induced critical illness (36, 37). In line with several studies showing the alteration of the microcirculation upon LPS exposure (38, 39), mice undergoing GSR show the reduced microhemodynamics, thrombocytopenia and leukocytopenia, and the triggering of coagulation and inflammatory responses that can be seen in septic patients (40, 41). Gene-targeted PZ- and ZPI-deficient mice provide a powerful tool to study the specific roles of PZ and ZPI in this scenario (42, 43).
Effect of PZ and ZPI deficiency in GSR
The action profile of PZ and ZPI suggests their potential contribution in the pathogenesis of haemostatic disorders. However, except of clinical trials solely describing the occurrence of altered PZ and ZPI levels in vascular diseases without providing the proof of a causal relationship (18-23), basic research studies are barely available. In the present study we demonstrate that (i) ZPI deficiency reverts the GSR-associated coagulopathy, while (ii) PZ deficiency modulates inflammation without major effect on thrombotic disorders during GSR.
ZPI is a potent direct inhibitor of FXIa and inhibits FXa in a process that is dramatically enhanced by its cofactor, PZ, in the presence of Ca2+ and a phospholipid surface. Unchallenged PZ- and ZPI-deficient mice appear normal. A pro-thrombotic phenotype that is greater with ZPI deficiency than PZ deficiency, however, has been demonstrated with a concomitant factor VLeiden genotype and in the murine models of FeCl3-induced carotid artery occlusion and collagen/epinephrine-induced pulmonary embolism (15, 16). In contrast to the previously reported results in the carotid artery FeCl3-induced thrombosis model (16), we did not detect a significant effect of PZ or ZPI deficiency on light/dye-induced thrombosis in saline-treated mice, using the dorsal skinfold chamber model (Figure 3). Whether this disparity is related to the different vasculature being tested (macrovascular versus microvascular) or the different methods used to provoke thrombosis (FeCl3 versus light/dye) is not clear.
After the induction of GSR, ZPI−/− mice had significantly shorter light/dye-induced vascular occlusion times and a greater fraction of thrombotic occluded hepatic vessels than their ZPI+/+ littermates (Figures 3 and 4). On the other hand, PZ−/− and PZ+/+ had similar vascular occlusion times and the difference in hepatic vascular thrombosis did not reach statistical significance. The effect of ZPI deficiency, but not PZ deficiency, on thrombosis suggests that FXIa plays a dominant role in this GSR murine model and that PZ-independent inhibition of FXa by ZPI (14) or the inhibition of FXa by other protease inhibitors may compensate for the loss of PZ cofactor action.
The inflammatory response plays an important role in septic illness. Just a few studies investigated by in vivo (44, 45) and in vitro (46, 47) experiments PZ and ZPI in the context of inflammatory processes. A striking result in our studies was the different effects of PZ and ZPI deficiency on cytokine generation following GSR induction. The levels of IL-6 and IL-10 were substantially and significantly increased in PZ−/− mice compared to their wild-type littermates, whereas cytokine levels were not significantly different between ZPI−/− and ZPI+/+ mice (Figures 5 and 6). Furthermore, PZ−/− mice showed higher numbers of tissue infiltrating leukocytes in liver and lung, whereas the presence or absence of ZPI had no influence on the extent of leukocytic tissue infiltration. The mechanism underlying this phenomenon is unknown, but the data suggest that PZ may affect the inflammatory response in a manner that is unrelated to its interaction with ZPI. Further investigation into a potential ZPI-independent function of PZ would appear warranted. Thus, several studies and our data suggest complex interactions between ZPI, PZ and inflammation.
Conclusion
In our murine GSR model, ZPI deficiency increased microvascular thrombosis, while PZ deficiency modified the inflammatory response. In conclusion, PZ and ZPI might not only regulate thrombosis, but might also be important regulators of inflammation. Future research should focus in a disease specific manner on the question how these interactions can be exploited for the treatment of critically ill patients.
Acknowledgments
Source of funding. This work was supported by a grant of the Deutsche Forschungsgemeinschaft DFG (VO 450/11-1). Dr. George J. Broze, Jr. has received grant support from the National Institutes of Health.
Footnotes
Conflicts of interest: The rest of the authors have not disclosed any potential conflicts of interest.
This is a PDF file of an unedited manuscript that has been accepted for publication. As a service to our customers we are providing this early version of the manuscript. The manuscript will undergo copyediting, typesetting, and review of the resulting proof before it is published in its final citable form. Please note that during the production process errors may be discovered which could affect the content, and all legal disclaimers that apply to the journal pertain.
References
- 1.Feistritzer C, Wiedermann CJ. Effects of anticoagulant strategies on activation of inflammation and coagulation. Expert Opin Biol Ther. 2007;7:855–870. doi: 10.1517/14712598.7.6.855. [DOI] [PubMed] [Google Scholar]
- 2.Wiedermann CJ, Hoffmann JN, Juers M. High-dose antithrombin III in the treatment of severe sepsis in patients with a high risk of death: efficacy and safety. Crit Care Med. 2006;34:285–292. doi: 10.1097/01.ccm.0000194731.08896.99. [DOI] [PubMed] [Google Scholar]
- 3.Bernard GR, Vincent J-L, Laterre P-F, LaRosa SP, Dhainaut J-F, Lopez-Rodriguez A, Steingrub JS, Garber GE, Helterbrand JD, Ely EW, Fisher CJ, Jr, for the Recombinant Human Activated Protein C Worldwide Evaluation in Severe Sepsis (PROWESS) Study Group Efficacy and safety of recombinant human activated protein C for severe sepsis. N Engl J Med. 2001;344:699–709. doi: 10.1056/NEJM200103083441001. [DOI] [PubMed] [Google Scholar]
- 4.Fourrier F, Chopin C, Goudemand J, Hendrycx S, Caron C, Rime A, Marey A, Lestavel P. Septic shock, multiple organ failure, and disseminated intravascular coagulation. Compared patterns of antithrombin III, protein C, and protein S deficiencies. Chest. 1992;101:816–823. doi: 10.1378/chest.101.3.816. [DOI] [PubMed] [Google Scholar]
- 5.Prowse CV, Esnouf MP. The isolation of a new warfarin-sensitive protein from bovine plasma. Biochem Soc Trans. 1977;5:255–256. doi: 10.1042/bst0050255. [DOI] [PubMed] [Google Scholar]
- 6.Broze GJ, Jr, Miletich J. Human Protein Z. J Clin Invest. 1984;73:933–938. doi: 10.1172/JCI111317. [DOI] [PMC free article] [PubMed] [Google Scholar]
- 7.Fujimaki K, Yamazaki T, Taniwaki M, Ichinose A. The gene for human protein Z is localized to chromosome 13 at band q34 and is coded by eight regular exons and one alternative exon. Biochemistry. 1998;37:6838–6846. doi: 10.1021/bi972002a. [DOI] [PubMed] [Google Scholar]
- 8.Broze GJ., Jr Protein Z-dependent regulation of coagulation. Thromb Haemost. 2001;86:8–13. [PubMed] [Google Scholar]
- 9.Han X, Fiehler R, Broze GJ., Jr Isolation of a protein Z-dependent plasma protease inhibitor. Proc Natl Acad Sci U S A. 1998;95:9250–9255. doi: 10.1073/pnas.95.16.9250. [DOI] [PMC free article] [PubMed] [Google Scholar]
- 10.Han X, Huang ZF, Fiehler R, Broze GJ., Jr The protein Z-dependent protease inhibitor is a serpin. Biochemistry. 1999;38:11073–11078. doi: 10.1021/bi990641a. [DOI] [PubMed] [Google Scholar]
- 11.Tabatabai A, Fiehler R, Broze GJ., Jr Protein Z circulates in plasma in a complex with protein Z-dependent protease inhibitor. Thromb Haemost. 2001;85:655–660. [PubMed] [Google Scholar]
- 12.Han X, Fiehler R, Broze GJ., Jr Characterization of the protein Z-dependent protease inhibitor. Blood. 2000;96:3049–3055. [PubMed] [Google Scholar]
- 13.Heeb MJ, Cabral KM, Ruan L. Down-regulation of factor IXa in the factor Xase complex by protein Z-dependent protease inhibitor. J Biol Chem. 2005;280:33819–33825. doi: 10.1074/jbc.M506502200. [DOI] [PubMed] [Google Scholar]
- 14.Rezaie AR, Sun MF, Gailani D. Contributions of basic amino acids in the autolysis loop of factorXIa to serpin specificity. Biochemistry. 2006;45:9427–9433. doi: 10.1021/bi060820+. [DOI] [PubMed] [Google Scholar]
- 15.Yin ZF, Huang ZF, Cui J, Fiehler R, Lasky N, Ginsburg D, Broze GJ., Jr Prothrombotic phenotype of protein Z deficiency. Proc Natl Acad Sci U S A. 2000;97:6734–6738. doi: 10.1073/pnas.120081897. [DOI] [PMC free article] [PubMed] [Google Scholar]
- 16.Zhang J, Tu Y, Lu L, Lasky N, Broze GJ., Jr Protein Z-dependent protease inhibitor deficiency produces a more severe murine phenotype than protein Z deficiency. Blood. 2008;111:4973–4978. doi: 10.1182/blood-2007-12-126391. [DOI] [PMC free article] [PubMed] [Google Scholar]
- 17.Corral J, González-Conejero R, Hernández-Espinosa D, Vicente V. Protein Z/Z-dependent protease inhibitor (PZ/ZPI) anticoagulant system and thrombosis. Br J Haematol. 2007;137:99–108. doi: 10.1111/j.1365-2141.2007.06548.x. [DOI] [PubMed] [Google Scholar]
- 18.Santacroce R, Sarno M, Cappucci F, Sessa F, Colaizzo D, Brancaccio V, Grandone E, Margaglione M. Low protein Z levels and risk of occurrence of deep vein thrombosis. J Thromb Haemost. 2006;4:2417–2422. doi: 10.1111/j.1538-7836.2006.02186.x. [DOI] [PubMed] [Google Scholar]
- 19.Vasse M, Guegan-Massardier E, Borg JY, Woimant F, Soria C. Frequency of protein Z deficiency in patients with ischaemic stroke. Lancet. 2001;357:933–934. doi: 10.1016/S0140-6736(00)04218-5. [DOI] [PubMed] [Google Scholar]
- 20.Sofi F, Cesari F, Abbate R, Gensini GF, Broze G, Jr, Fedi S. A meta-analysis of potential risks of low levels of protein Z for diseases related to vascular thrombosis. Thromb Haemost. 2010;103:749–756. doi: 10.1160/TH09-09-0645. [DOI] [PMC free article] [PubMed] [Google Scholar]
- 21.Sofi F, Cesari F, Tu Y, Pratesi G, Pulli R, Pratesi C, Gensini GF, Abbate R, Fedi S, Broze GJ., Jr Protein Z-dependent protease inhibitor and protein Z in peripheral arterial disease patients. J Thromb Haemost. 2009;7:731–735. doi: 10.1111/j.1538-7836.2009.03325.x. [DOI] [PMC free article] [PubMed] [Google Scholar]
- 22.Al-Shanqeeti A, van Hylckama Vlieg A, Berntorp E, Rosendaal FR, Broze GJ., Jr Protein Z and protein Z-dependent protease inhibitor. Determinants of levels and risk of venous thrombosis. Thromb Haemost. 2005;93:411–413. doi: 10.1160/TH04-11-0715. [DOI] [PubMed] [Google Scholar]
- 23.Van de Water N, Tan T, Ashton F, O’Grady A, Day T, Browett P, Ockelford P, Harper P. Mutations within the protein Z-dependent protease inhibitor gene are associated with venous thromboembolic disease: a new form of thrombophilia. Br J Haematol. 2004;127:190–194. doi: 10.1111/j.1365-2141.2004.05189.x. [DOI] [PubMed] [Google Scholar]
- 24.Lehr H-A, Leunig M, Menger MD, Nolte D, Messmer K. Dorsal skinfold chamber technique for intravital microscopy in nude mice. Am J Pathol. 1993;143:1055–1062. [PMC free article] [PubMed] [Google Scholar]
- 25.Slofstra SH, ten Cate H, Spek CA. Low dose endotoxin priming is accountable for coagulation abnormalities and organ damage observed in the Shwartzman reaction. A comparison between a single-dose endotoxemia model and a double-hit endotoxin-induced Shwartzman reaction. Thromb J. 2006;24:13. doi: 10.1186/1477-9560-4-13. [DOI] [PMC free article] [PubMed] [Google Scholar]
- 26.Püschel A, Lindenblatt N, Katzfuß J, Vollmar B, Klar E. Acceleration of microvascular thrombus formation by immunosuppressants in vivo: role of endothelial cell activation. Surgery. 2012;151:26–36. doi: 10.1016/j.surg.2011.06.026. [DOI] [PubMed] [Google Scholar]
- 27.Vollmar B, Schmits R, Kunz D, Menger MD. Lack of in vivo function of CD31 in vascular thrombosis. Thromb Haemost. 2001;85:160–164. [PubMed] [Google Scholar]
- 28.Baker M, Wayland H. On-line volume flow rate and velocity profile measurement for blood in microvessels. Microvasc Res. 1974;7:131–143. doi: 10.1016/0026-2862(74)90043-0. [DOI] [PubMed] [Google Scholar]
- 29.Hol J, Wilhelmsen L, Haraldsen G. The murine IL-8 homologues KC, MIP-2, and LIX are found in endothelial cytoplasmic granules but not in Weibel-Palade bodies. J Leukoc Biol. 2010;87:501–508. doi: 10.1189/jlb.0809532. [DOI] [PubMed] [Google Scholar]
- 30.Ward NS, Casserly B, Ayala A. The compensatory anti-inflammatory response syndrome (CARS) in critically ill patients. Clin Chest Med. 2008;29:617–625. doi: 10.1016/j.ccm.2008.06.010. [DOI] [PMC free article] [PubMed] [Google Scholar]
- 31.Grütz G. New insights into the molecular mechanism of interleukin-10-mediated immunosuppression. J Leukoc Biol. 2005;77:3–15. doi: 10.1189/jlb.0904484. [DOI] [PubMed] [Google Scholar]
- 32.Butcher EC. Leukocyte-endothelial cell recognition: Three (or more) steps to specificity and diversity. Cell. 1991;67:1033–1036. doi: 10.1016/0092-8674(91)90279-8. [DOI] [PubMed] [Google Scholar]
- 33.Brown KA, Brain SD, Pearson JD, Edgeworth JD, Lewies SM, Treacher DF. Neutrophils in development of multiple organ failure in sepsis. Lancet. 2006;368:157–169. doi: 10.1016/S0140-6736(06)69005-3. [DOI] [PubMed] [Google Scholar]
- 34.Rittirsch D, Hoesel LM, Ward PA. The disconnect between animal models of sepsis and human sepsis. J Leukoc Biol. 2007;81:137–143. doi: 10.1189/jlb.0806542. [DOI] [PubMed] [Google Scholar]
- 35.Fink MP, Heard SO. Laboratory models of sepsis and septic shock. J Surg Res. 1990;49:186–196. doi: 10.1016/0022-4804(90)90260-9. [DOI] [PubMed] [Google Scholar]
- 36.Ince C. The microcirculation is the motor of the sepsis. Crit Care. 2005;9(Suppl 4):S13–9. doi: 10.1186/cc3753. [DOI] [PMC free article] [PubMed] [Google Scholar]
- 37.Spronk PE, Zandstra DF, Ince C. Bench-to-bedside review: Sepsis is a disease of the microcirculation. Crit Care. 2004;8:462–468. doi: 10.1186/cc2894. [DOI] [PMC free article] [PubMed] [Google Scholar]
- 38.Hoffmann JN, Vollmar B, Römisch J, Inthorn D, Schildberg FW, Menger MD. Antithrombin effects on endotoxin-induced microcirculatory disorders are mediated mainly by its interaction with microvascular endothelium. Crit Care Med. 2002;30:218–225. doi: 10.1097/00003246-200201000-00031. [DOI] [PubMed] [Google Scholar]
- 39.Hoffmann JN, Vollmar B, Laschke MW, Inthorn D, Fertmann J, Schildberg FW, Menger MD. Microhemodynamic and cellular mechanisms of activated protein C action during endotoxemia. Crit Care Med. 2004;32:1011–1017. doi: 10.1097/01.ccm.0000120058.88975.42. [DOI] [PubMed] [Google Scholar]
- 40.Levi M, Schultz M. Coagulopathy and platelet disorders in critically ill patients. Minerva Anestesiol. 2010;76:851–859. [PubMed] [Google Scholar]
- 41.Lipinski S, Bremer L, Lammers T, Thieme F, Schreiber S, Rosenstiel P. Coagualtion and inflammation. Molecular insights and diagnostic implications. Hamostaseologie. 2011;31:94–102. doi: 10.5482/ha-1134. [DOI] [PubMed] [Google Scholar]
- 42.Gama Sosa MA, De Gasperi R, Elder GA. Animal transgenesis: an overview. Brain Struct Funct. 2010;214:91–109. doi: 10.1007/s00429-009-0230-8. [DOI] [PubMed] [Google Scholar]
- 43.Castrop H. Genetically modified mice-successes and failures of a widely used technology. Pflugers Arch. 2010;459:557–567. doi: 10.1007/s00424-009-0770-z. [DOI] [PubMed] [Google Scholar]
- 44.Ündar L, Karadogan I, Öztürk F. Plasma protein Z levels inversely correlate with plasma interleukin-6 levels in patients with acute leukemia and non-Hodgkin’s Lymphoma. Thromb Res. 1999;94:131–134. doi: 10.1016/s0049-3848(98)00210-2. [DOI] [PubMed] [Google Scholar]
- 45.Cesari F, Gori AM, Fedi S, Abbate R, Gensini GF, Sofi F. Modifications of protein Z and interleukin-6 during the acute phase of coronary artery disease. Blood Coagul Fibrinolysis. 2007;18:85–89. doi: 10.1097/MBC.0b013e3280124f2c. [DOI] [PubMed] [Google Scholar]
- 46.Vasse M, Denoyelle C, Legrand E, Vannier J-P, Soria C. Weak regulation of protein Z biosynthesis by inflammatory cytokines. Thromb Haemost. 2002;87:350–351. [PubMed] [Google Scholar]
- 47.Vasse M, Denoyelle C, Corbière C, Litzler PY, Legrand E, Vannier JP. Human endothelial cells synthesize protein Z, but not the protein Z dependent inhibitor. Thromb Haemost. 2006;95:519–23. doi: 10.1160/TH05-11-0723. [DOI] [PubMed] [Google Scholar]


