

Abstract
In the classic model of the primary visual cortex, upper-layer complex cells are driven by feedforward inputs from layer 4 simple cells. Based on spike cross-correlation, previous in vivo work has suggested that this connection is strong and dense, with a high probability of connection (50%) and significant strength in connected pairs. A much sparser projection has been found in brain slices, however, with the probability of layer 4 cells connecting to layer 2/3 cells being relatively low (10%). Here, we explore this connection in vivo in the cat primary visual cortex by recording simultaneously spikes of layer 4 simple cells and the membrane potential (Vm) of layer 2/3 complex cells. By triggering the average of the complex cell's Vm on the spikes of the simple cell (Vm-STA), we found functional coupling to be very common during visual stimulation: the simple cell's spikes tended to occur near the troughs of the complex cell's Vm fluctuations and were, on average, followed by a significant (∼1 mV) fast-rising (10 ms) depolarization in the complex cell. In the absence of visual stimulation, however, when single simple cells were activated electrically through the recording electrode, no significant depolarization, or at most a very weak input (0.1–0.2 mV), was detected in the complex cell. We suggest that the functional coupling observed during visual stimulation arises from coordinated or nearly synchronous activity among a large population of simple cells, only a small fraction of which are presynaptic to the recorded complex cell.
Introduction
In the feedforward model of primary visual cortex (Hubel and Wiesel, 1962), the input from LGN to layer 4 is thought to construct the mutually antagonistic ON and OFF subfields of layer 4 simple cells (Priebe and Ferster, 2012). Feedforward inputs from multiple overlapping layer 4 simple cells of similar preferred orientations then construct the uniform receptive fields of layer 2/3 complex cells.
To explore the strength of the layer 4 to layer 2/3 connections in vivo, previous authors have constructed spike cross-correlograms from extracellularly recorded simple and complex cells in the same or nearby orientation columns (Alonso and Martinez, 1998; Martinez and Alonso, 2001). Strong functional coupling was found between a high proportion (∼50%) of pairs: firing in the complex cell increased significantly within a narrow window (∼10 ms) after spikes in the simple cell, suggestive of a monosynaptic connection. One question raised by these results, however, is how each simple cell can trigger a significant fraction of the complex cell's spikes at the same time that a high fraction of simple–complex pairs showed strong functional connections.
In cortical slices, the probability of connections between layer 4 and layer 2/3 cells is far lower, on the order of 10% (cf. Thomson et al., 2002; Lefort et al., 2009). This mismatch between methods implies that the in vitro studies underestimated the connectivity, perhaps because of misalignment or truncation of connections during slicing. Alternatively, in vivo studies might overestimate connectivity because of coordinated network activity. For example, correlated firing could occur without a direct connection if the simple cell of a pair fires synchronously with other unrecorded cells that connect to the complex cell.
Intracellular recording provides some hints that synchronous inputs are driving complex-cell responses. Spikes in complex cells almost invariably rise off of strong membrane potential (Vm) fluctuations of 5–20 mV with dominant frequencies at 20–80 Hz (Fig. 1) (Jagadeesh et al., 1992; J. Anderson et al., 2000; Yu and Ferster, 2010). Since unitary monosynaptic connections are far less than 5 mV in amplitude (Thomson and Lamy, 2007), these Vm fluctuations most likely reflect convergent inputs from the relatively synchronized presynaptic population.
Figure 1.

High-frequency components in visually evoked Vm fluctuations. A, Top, Visually evoked and spontaneous (Spont.) Vm fluctuations of an example layer 2/3 complex cell. Bottom, Voltage excursions are identified and labeled for evoked (blue) and spontaneous (gray) Vm fluctuations. The definition of time to peak (Trise) and amplitude (Vrise) of the depolarizing transients is illustrated in the inset. B, Distribution of Trise and Vrise for spontaneous (gray) and visually evoked (blue) activities of the example cell. Red circles mark examples that are highlighted in A. The inset is the cumulative distribution functions (CDF) of Vrise.
With these results in mind, we have reexamined the function of the layer 4-to-layer 2/3 projection by constructing averages of the Vm of the complex cell, triggered on the spikes of a nearby simple cell. During visual stimulation, pairs of simple and complex cells were indeed functionally coupled with very high probability (85%): simple cells fired preferentially near the troughs of the complex cell's Vm fluctuations and just before a consistent and rapid depolarization (∼1 mV). These correlations, however, disappeared almost entirely in the absence of visual stimulation. When a simple cell that showed tightly correlated activity with a complex cell during visual stimulation was activated directly by electrical stimulation, the evoked potentials in complex cells either disappeared entirely or weakened considerably. Our results suggest that during visual stimulation, the activity of complex cells is driven by concerted inputs from multiple simple cells.
Materials and Methods
Animal preparation.
Adult cats of either sex (4–7 months) were prepared for experiments as described previously (Boudreau and Ferster, 2005; Yu and Ferster, 2010). All procedures were approved by the Northwestern University Animal Care and Use Committee. Anesthesia was induced by ketamine hydrochloride and acepromazine (intramuscular, 30 and 0.3 mg/ kg) and maintained throughout the experiment with intravenous infusion of propofol and sufentanil (5–10 mg · kg−1 · h−1 and 0.75–1.5 μg · kg−1 · h−1). Muscle relaxant (pancuronium bromide: 1.5 mg/kg initial dose, 0.2 mg · kg−1 · h−1 maintaining rate) was administered to eliminate eye movements, and animals were artificially ventilated via a tracheal cannula. Nictitating membranes were retracted with phenylepherine hydrochloride (2.5%), and the pupil was dilated with atropine sulfate (1%). Eyes were protected with a pair of contact lenses (artificial pupil, 4 mm in diameter). Two screws, separated by 2 mm, were inserted into the skull above the surface of the left hemisphere to monitor EEG. A feedback-controlled heating lamp and a heating pad were used together to maintain the animal's temperature at 38.2°C. All vital signs (heart rate, end-tidal CO2, temperature, and EEG) were monitored and recorded to ensure that the animal was adequately anesthetized.
Visual stimulation.
With corrective lenses, the retinas were focused on a computer display 50 cm in front of the animal. Drifting sinusoidal gratings were generated with the Psychophysics Toolbox (Brainard, 1997; Pelli, 1997). For each pair of cells, we first mapped their orientation and spatial frequency preferences. To evoke visual responses in a pair of cells, a grating of appropriate location, size, orientation, and spatial frequency was chosen to activate both cells. Visual stimuli were presented monocularly to the dominant eye for most of the recordings.
Electrophysiology.
We performed simultaneous extracellular and whole-cell intracellular recordings from pairs of nearby neurons. In vivo whole-cell recordings were performed as described previously (Jagadeesh et al., 1992; Yu and Ferster, 2010). Patch pipettes (7–12 MΩ) were pulled from borosilicate glasses (Sutter Instruments) and filled with an internal solution (pH 7.3, 292 mOsm) that contained (in mm) 135 K-gluconate, 4 KCl, 10 HEPES, 0.5 EGTA, 10 Na2-phosphocreatine, 4 Mg-ATP, and 0.4 Na2-GTP. Extracellular recordings were made with conventional extracellular tungsten electrodes (FHC or Thomas Recording) or borosilicate patch electrodes. Extracellular signals were filtered (0.3–10 kHz) and sampled at 20 kHz. Spike sorting was performed off-line. For single-unit recording with tungsten electrodes, spike sorting was performed with wavelet decomposition and superparamagnetic clustering (Quiroga et al., 2004). From the raw trace, candidate spikes with height larger than a threshold determined individually for different recordings were identified by the Matlab “findpeaks” function. A segment of the spike (0.55 ms before the peak and 1 ms after the peak, 32 data points for each segment) was then chosen and stored for further cluster analysis. These spike segments were then aligned by their centers of mass around the peak. For feature extraction, wavelet coefficients of these spike events were computed (Letelier and Weber, 2000; Quiroga et al., 2004). Several optimal coefficients were then chosen according to their distribution so that spike waveforms can be classified into a few clusters. Superparamagnetic clustering was then performed to isolate one to three spike classes from each recording (Quiroga et al., 2004). Interspike interval (ISI) histograms, tuning curves, and peristimulus time histograms (PSTHs) were constructed for each unit to confirm its identity. Spike-sorting routines were modified from the Matlab package Wave Clus (written by R. Quian Quiroga, University of Leicester, Leicester, UK).
For juxtacellular recording/stimulation of single neurons (Houweling et al., 2010), patch electrodes were loaded with the same internal solution used for whole-cell recordings or with an extracellular solution that contained (in mm) 135 NaCl, 5.4 KCl, 1.8 CaCl2, 1 MgCl2 and 5 HEPES (pH 7.3, 295 mOsm). Spikes were detected and isolated by thresholding and, when necessary, by the spike-sorting procedure described above. Juxtacellular configuration was established between the electrode tip and the cell in bridge mode. To stimulate single cells, we injected positive current steps (1–10 nA, 1 or 2 Hz, 250 ms) through the patch electrode (Pinault, 1996; Houweling et al., 2010). A high-pass filter was used to remove the DC shift associated with current injection. The waveforms for naturally occurring (ongoing or visually driven) and juxtacellularly activated spikes were similar, confirming that we were stimulating the recorded cell, not nearby cells or axons. A small period (25 ms) after the onset or offset of each stimulation epoch was omitted for analysis because of stimulation artifact.
Data analysis.
Spikes were removed from the raw Vm traces by an interpolation of the beginning (1 ms before the threshold) and the end (4 ms after the threshold) of each spike event that was detected in the high-pass-filtered Vm trace. The Vm trace was further passed through a Savitsky-Golay smoothing filter. To calculate spike-triggered Vm averages (Vm-STAs) under a given stimulus condition, for each trial, we computed the cross-correlation (“xcorr” in Matlab) of the simple-cell spike times and the complex-cell Vm and normalized the result by the spike number. Vm-STAs across trials were then averaged. For each stimulus condition, the shift predictor was computed from the correlation of spikes and Vm of different trials with one trial offset (spikes from trial n were cross-correlated with Vm of trial n+1; the last trial was omitted). Normally, Vm-STAs from different stimulus conditions were not pooled unless the visual responses were similar. For each time lag, spike cross-correlation was measured as the number of synchronous spikes between simple and complex cells at each time bin (1 ms) across all trials.
We also applied the spike-jittering method. Here we perturbed individual spikes by randomly jittering their timing in a defined time window to construct jittered cross-correlations and the confidence limits. Correlated activity that occurs at a time scale finer than the window width will be disrupted after spike jittering, whereas broader correlation is preserved. This method can therefore disentangle the correlation at different time scales. To examine the statistical significance of Vm-STA couplings for each pair, we used a ±25 ms jittering window (see Fig. 4A). To analyze and isolate the postsynaptic effect of the spikes elicited by juxtacellular stimulation, we chose a jittering window of ±15 ms (see Figs. 5, 6). The 95% confidence limits of jittered data were estimated from 1000 iterations as the 2.5th and 97.5th percentiles of the resampling data set, forming acceptance bands for testing the null hypothesis that there was no correlation finer than the jittering window. Functional coupling was considered significant if the raw Vm-STA exceeded the 95% acceptance bands within the jittering window. A similar procedure was applied to estimate the acceptance bands for spike cross-correlations.
Figure 4.

Summary of Vm-STAs from a population of pairs. A, Color-coded Vm-STAs of 34 pairs of cells during visual stimulation. All Vm-STA (shift predictor-corrected) traces are high-pass filtered (>5 Hz) to remove baseline and slow trend. Pairs are aligned vertically and sorted by the amplitude of peak-to-peak Vm deflection (Vpp) across the zero-lag. Circles on the left mark pairs with similar orientation preferences (≤20°, black) and those with different preferences (>20° or unidentified, gray). Blue crosses mark pairs without significant coupling. Red arrows point to two example Vm-STAs that are replotted at the bottom. B, Definitions of the onset (tmin), the peak time (tmax), and the coupling strength (Vpp). C, Distribution of Vpp. D, Distribution of tmin and tmax. Arrows mark the median. E, Distribution of the rise time, tmax-tmin. F, Relationship between Vpp and the orientation difference of cells in each pair. u.d., Undetermined. G, Relationship between Vpp and the mean Vm depolarization during visual stimulation. H, Relationship between Vpp and the Vm fluctuations in the high-frequency range (20–80 Hz) calculated as the squared root of summed Vm power.
Figure 5.
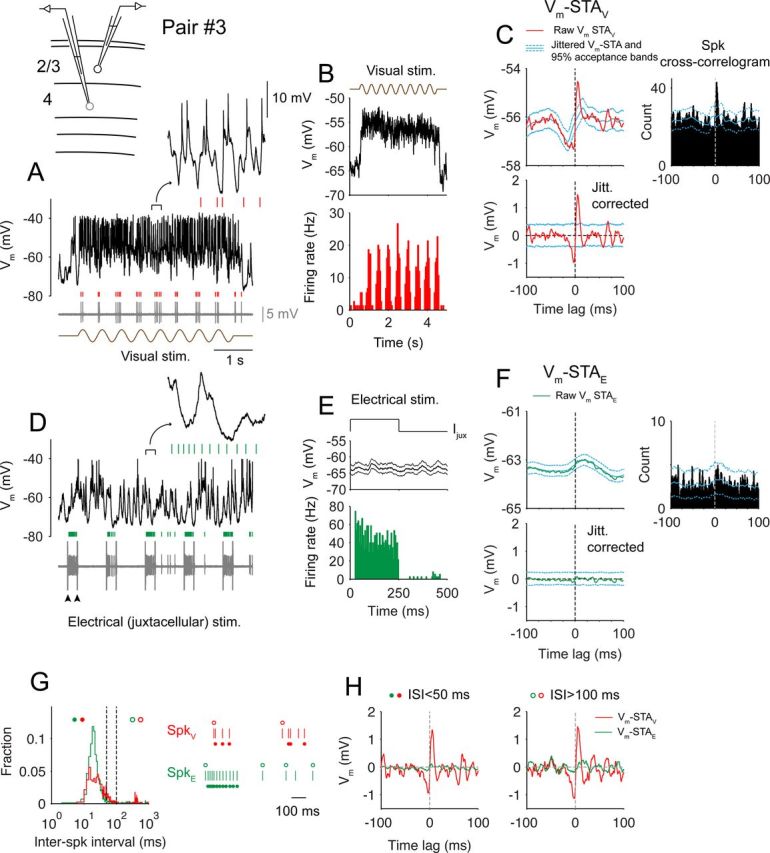
Simple–complex coupling during visual and electrical stimulations. The experiment diagram showing a layer 4 simple cell recorded with a patch pipette for both spike recording and electrical (juxtacellular) stimulation and a layer 2/3 complex cell in the whole-cell configuration are shown. A, A single trial of visual responses of the complex cell (black, Vm) and the simple cell (gray, juxtacellular recording trace; red tick marks are spikes). A 0.25 s segment is expanded at the top. Note the tight coupling of simple-cell spikes and the troughs of Vm fluctuations. B, Average Vm of the complex cell (top) and PSTHs of the simple cell (bottom) during drifting–grating stimulation. C, Top, Vm-STA in visual responses (red). Cyan lines are mean jittered Vm-STA and 95% acceptance bands. Spike cross-correlogram with 95% acceptance bands is on the right. Bottom, jitter-corrected Vm-STA and the 95% acceptance bands. D, A single trial of activity during juxtacellular stimulation. Arrowheads mark the onset and offset of a single epoch of current injection. E, Spike histogram of the simple cell (bottom) and the average Vm of the complex cell (top; thin lines are 95% confidence limits) during juxtacellular stimulation. F, Same as C for juxtacellular stimulation trials. G, Left, Distribution of interspike intervals for visually and electrically evoked spikes (red, visual; green, electrical). Two dashed lines label 50 and 100 ms. Right, Trains of visually (top) and electrically (bottom) evoked spikes. Open circles mark spikes with long (>100 ms) prespike ISIs, and filled circles mark spikes with short (<50 ms) prespike ISIs. H, Jitter-corrected Vm-STAs for spikes with short or long prespike ISIs. stim., Stimulation; jitt. corrected, jitter corrected.
Figure 6.
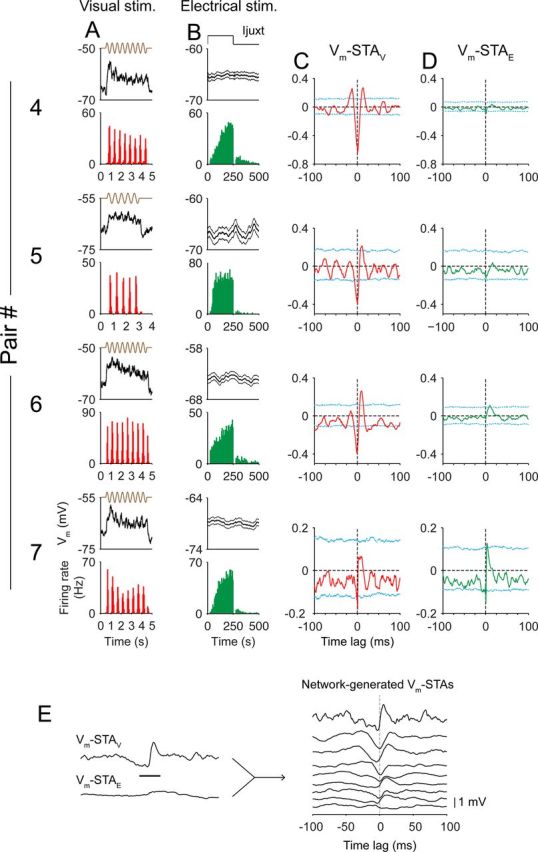
Vm-STA coupling during visual versus electrical stimulations. A–D, Four example pairs where the same experiments were performed as in Figure 5 are shown. For each pair of cells: A, average Vm of the complex cell (top) and PSTH of the simple cell (bottom) during visual stimulation; B, average Vm of the complex cell (top) and PSTH of the simple cell (bottom) during electrical stimulation; C, jitter-corrected Vm-STAV; cyan lines are 95% acceptance bands from jittered data; D, jitter-corrected Vm-STAE. E, Subtracting Vm-STAE from Vm-STAV produces Vm-STA that is attributed to correlated activity in the network (network-generated Vm-STAs).
Analysis of Vm correlation from pairs of cells was performed similar to our previous study (Yu and Ferster, 2010). Here we specifically examined short periods (166 ms) of Vm traces when the simple cell was depolarized or hyperpolarized (see Fig. 8). Before computing the Vm correlation for either condition, an averaged trace across cycles was subtracted from individual traces to remove the stimulus component.
Figure 8.
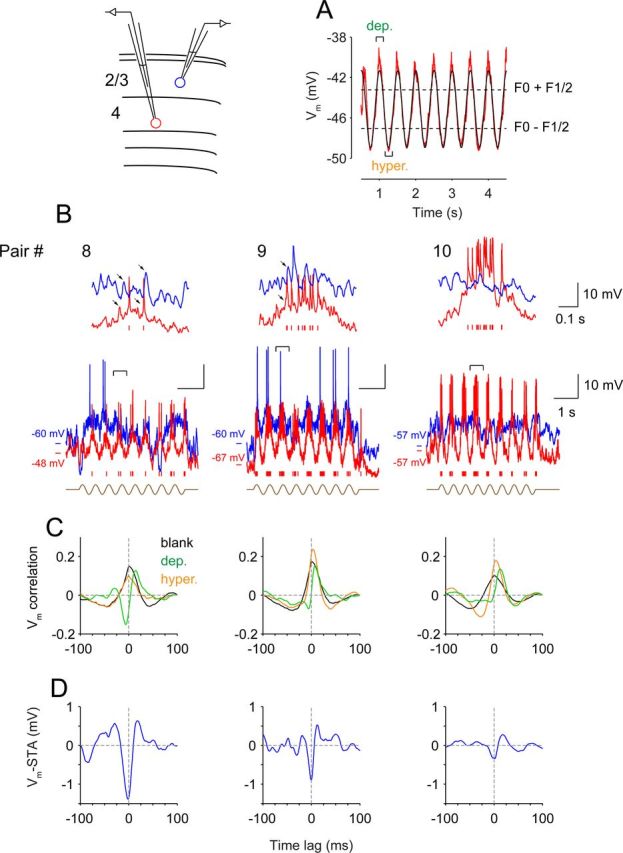
Dual whole-cell recordings revealing propagating synaptic inputs. Shown here are three pairs of cells recorded with dual whole-cell patch-clamp configuration (diagram). A, Example of average simple-cell Vm response (red) and its sinusoidal fit (black) during drifting grating stimulation. The definition of depolarized and hyperpolarized periods is illustrated. B, Raw Vm traces of both cells during visual stimulation. A 0.5 s segment is expanded at the top. Arrows mark synaptic activity that seems to propagate from the simple cell to the complex cell. C, Vm cross-correlations (high-pass filtered at 5 Hz) for blank stimulation (black) and depolarized (green) and hyperpolarized (orange) periods during visual stimulation. D, Vm-STAs during visual stimulation. dep., Depolarized; hyper., hyperpolarized.
Results
To explore the interaction between simple and complex cells, we recorded simultaneously from layer 2/3 complex cells (depth from the pia, <600 μm) and simple cells in or near layer 4 (depth, 650–1200 μm). Pairs of electrodes were separated by 300–400 μm on the surface of the cortex and angled 10–15° from vertical to maximize the likelihood that the recorded cells were located within the same cortical column. The complex cell was recorded in the whole-cell configuration; the simple cell was recorded extracellularly with a tungsten electrode, with a glass patch electrode in the juxtacellular configuration, or in the whole-cell intracellular configuration. From either of these experimental configurations, we derived Vm-STAs of the complex cell triggered on the spikes in the simple cell during visual stimulation. In the juxtacellular and intracellular configurations, we also derived Vm-STAs while stimulating the simple cell electrically, without presenting visual stimuli, to isolate the effect of spikes of single cells from the effect of parallel network activity. From dual whole-cell recordings, we calculated the Vm correlation between the recorded cells to examine the correlation that existed at the synaptic input level. In all Vm-STA calculations, the first peak of the spike waveform was used as the reference time point (zero-lag).
Vm-STA revealed functional coupling between simple and complex cells during visual stimulation
Simple and complex cells were recorded simultaneously in combined extracellular and whole-cell configurations (Fig. 2, diagram). In pair #1 (Fig. 2A), the two cells had nearly identical orientation preference. After previous studies (Carandini and Ferster, 2000; Priebe et al., 2004), simple cells were defined by the magnitude of spike-rate modulation in response to a drifting grating of optimal orientation and spatial frequency. In the simple cell's spike histogram (Fig. 2B, bottom), R1/R0 = 1.5 (orientation, 30°; R1/R0 = 2.2 at 15°), where R1 is half of the peak-to-peak firing rate modulation at the temporal frequency of the drifting grating and R0 is the DC component of firing rate increase. Complex cells lack strong Vm modulation at the grating's temporal frequency. In the complex cell's averaged Vm trace (Fig. 2B, top), V1/V0 = 0.3 (orientation, 30°), where V1 is half of the Vm modulation and V0 is the mean depolarization. The simple cell was recorded at 770 μm below the pia, and the complex was recorded at 440 μm.
Figure 2.
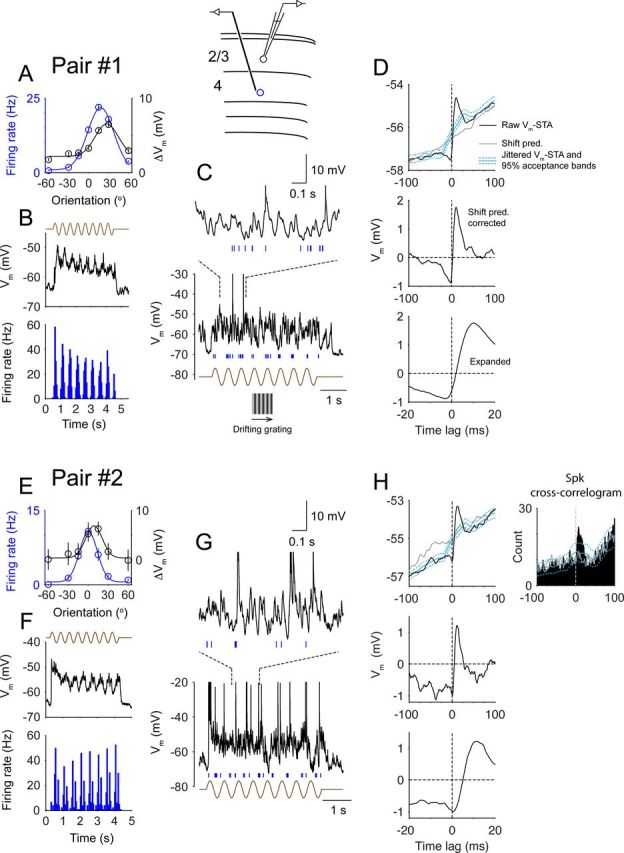
Functional coupling between simple and complex cells in visual responses. The diagram shows an extracellular unit (blue) recorded with a microelectrode in layer 4 and a layer 2/3 cell (black) recorded in the whole-cell configuration. A, Orientation tunings of the simple cell's spikes (blue, F1 components) and the complex cell's mean depolarization (black). Error bars denote SEM. B, Average Vm of the complex cell and the PSTH of the simple cell during visual stimulation (30°). The brown trace depicts the time course of the drifting grating. C, A single trial of visual responses of two cells (black trace, Vm of the complex cell; blue tick marks, spike times of the simple cell). A 1 s segment is expanded at the top. D, Top, Raw Vm-STA (black) and the shift predictor (gray, Shift pred.) derived from visual responses. Cyan lines are mean jittered Vm-STAs and 95% acceptance bands. Middle, Vm-STA with shift predictor subtracted. Bottom, Expanded plot around the zero-lag. E–H, Same as A–D for pair #2. Top right, Spike cross-correlogram (bin size, 1 ms) displaying a highly asymmetrical shape and a significant peak at 7 ms. Gray line, Shift predictor; cyan lines, mean jittered spike cross-correlogram and 95% acceptance bands. Spk, Spike.
In the simple cell, a sinusoidal drifting grating triggered clusters of spikes (Fig. 2C, blue tick marks) at the grating's temporal frequency (2 Hz). Within each cluster, the simple cell fired at around 35 Hz. Notably, individual simple-cell spikes preferentially occurred near the onset of voltage excursions of the simultaneously recorded complex cell (Fig. 2C). As a result, the Vm-STA, calculated by averaging the complex cell's Vm on the spikes of the simple cell, had an asymmetrical shape (Fig. 2D, top, black). We calculated the shift predictor by shifting the Vm of the complex cell by one stimulus trial (i.e., the nth trial of the simple-cell spikes was correlated with the n+1th trial of the complex-cell Vm). The lack of temporal coupling in the shift predictor implied that the coupling was not simply attributable to stimulus-mediated offset in neurons' response latencies (Fig. 2D, top, gray). With the shift predictor subtracted, the Vm-STA showed that the complex cell's depolarization started 3.1 ms before the simple cell's spike time and a majority of Vm depolarization occurred after the spike (Fig. 2D, middle and bottom). The depolarization reached a maximum of 1.8 mV at 10.1 ms. In addition, a small hyperpolarization (−0.9 mV at −3.1 ms) preceded the simple-cell spikes, yielding a peak-to-peak Vm deflection of 2.7 mV across the zero-lag. To study the statistical significance of the coupling, we used a spike-jittering method (Amarasingham et al., 2012) (see Materials and Methods), in which the spikes of the simple cell were randomly jittered within a time window of ±25 ms and jittered Vm-STAs were computed. From a large set of jittered data (1000 iterations), we constructed the 95% acceptance bands to test the null hypothesis that there was no temporal coupling finer than ±25 ms between the signals. Here the peak of the original Vm-STA exceeded the 95% acceptance bands (Fig. 2D, cyan dashed lines), demonstrating a significant coupling with a fast time scale (<25 ms).
In the second pair (Fig. 2E–H), the simple cell was recorded at a depth of 940 μm, and the complex cell (the same cell in Fig. 1A) was recoded at 390 μm. These two cells had very similar orientation tuning. The onsets of the complex cell's depolarization transients were strongly coupled to the spikes of the simple cell (Fig. 2G), as clearly demonstrated by Vm-STA (onset, 0.7 ms; peak, 11.5 ms; peak-to-peak Vm = 2.2 mV; Fig. 2H). In this pair, both cells fired enough spikes during optimal stimulation and a reliable spike cross-correlogram could be constructed, which was highly displaced toward positive time lag (i.e., simple cell leading) with a significant peak occurring at 7 ms (Fig. 2H).
This coupling changed with the spectral content of Vm fluctuations, which is stimulus dependent. For example, with decreasing contrast, the correlation between simple and complex cells became broader and more symmetrical around the zero-lag (Fig. 3A,B,D,E). In the absence of visual stimulation, spontaneous firing of simple cells was low (∼0.2 Hz) and only occurred when the complex cell was more depolarized (“up state”), implying that slow network fluctuations determined the response reliability of these cells under such conditions. Increasing visual contrast gradually suppressed the slow fluctuations and drove the network into a high-frequency mode; meanwhile, asymmetrical coupling between the simple cell's spikes and the complex cell's Vm became stronger (Fig. 3C,F).
Figure 3.
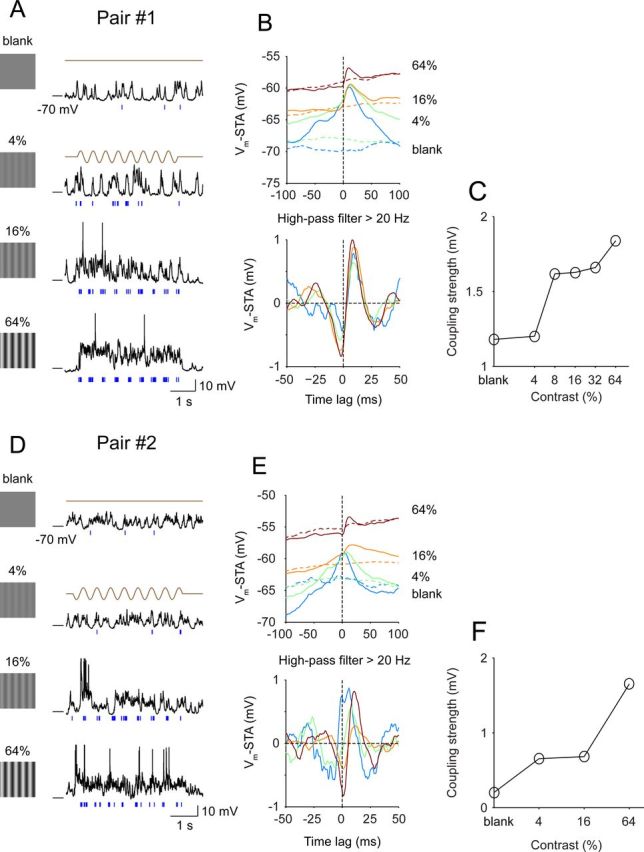
Coupling as a function of stimulus contrast. Shown here are the contrast dependence of visual responses and couplings of pairs #1 and #2. A, Responses of the complex cell (Vm, black) and the simple cell (spike, blue) to different stimulus contrasts (0%, 4%, 16%, and 64%). B, Top, Raw Vm-STAs (solid lines) and the shift predictors (dashed lines) under different stimulus conditions. Bottom, Shift predictor-corrected Vm-STAs were high-pass filtered for a comparison of the fast coupling around zero-lag. C, Coupling as a function of contrast. The coupling strength is derived from filtered Vm-STAs and is calculated as the difference between the trough before the zero-lag and the peak. D–F, Similar to A–C for pair #2. The coupling strength is the difference between the trough after the zero-lag and the peak.
Of 34 recorded pairs of cells, as determined by spike jittering, 29 exhibited a significant coupling in the Vm-STA that crossed zero-lag (Fig. 4A). Data shown here were collected when both cells were driven by the visual stimulus: When the cells preferred the same stimulus orientation, the optimal orientation was presented; when the cells preferred different stimuli, a stimulus intermediate between the two preferred orientations was presented. Strong coupling was more likely to occur between cells with similar orientation preferences (≤20°, Fig. 4A,F, black circles). To summarize the features of the coupling, we extracted four parameters from each Vm-STA waveform (29 pairs): the onset time of the depolarization (tmin), the peak time (tmax), the rise time (tmax-tmin), and the peak-to-peak amplitude (Vpp) (Fig. 4B–E). tmin had a median value of −3.2 ms, and some pairs showed onsets that followed the spike. The median tmax was 11.5 ms. The rise time was 13.4 ms. Vpp showed a wide distribution (median, 1 mV; 25th and 75th percentiles, 0.6 and 2.0 mV, maximum, 2.8 mV). Vpp correlated with the amplitude of visually evoked mean depolarization (Fig. 4G) and the high-frequency (20–80 Hz) components of the Vm fluctuations in the complex cell (Fig. 4H).
The strong association between simple–complex correlations and the amplitude and high-frequency components of the visually evoked responses suggested that the correlations might arise not from monosynaptic connections but from visually evoked network dynamics that lead to synchronization among a large fraction of the cells in the local circuit. We therefore attempted to measure the coupling between cells in the absence of visual stimulation.
The effect of single-cell stimulation
Layer 4 and 2/3 cortical cells spike little (≪1 Hz) in the absence of sensory stimulation (cf. Gilbert, 1977). When using metal electrodes, we could collect a large number of spikes for the Vm-STA analysis only during visual stimulation. Visual stimulation, however, inevitably increases the activity of many cells at once, which might introduce complex neuronal interactions within and across cortical layers. As a result, analyzing the neuronal correlation in visual responses, e.g., calculating Vm-STAs, may not provide an accurate estimate of the influence of a single simple cell on a complex cell. Unfortunately, analyzing Vm-STA during spontaneous activity is limited by the extremely small number (∼50) of spikes and is limited to a regime where the firing of the simple cell is strongly influenced by slow network fluctuations (compare Fig. 3).
To circumvent this problem, we directly drove single simple cells using juxtacellular stimulation, in which a patch electrode tip is brought close to the cell membrane for both spike recording and stimulation (Pinault, 1996; Houweling and Brecht, 2008). Positive current pulses (1–10 nA, 250 ms) delivered through the electrode at a frequency of 1 or 2 Hz electroporate the cell membrane near the pipette tip and discharge the cell (Houweling et al., 2010). Only the cell being recorded is stimulated. In our experiments, juxtacellular stimulation was randomly alternated with visual stimulation, and Vm-STAs were constructed for each stimulation method separately. To test the significance of spike-evoked postsynaptic potentials and minimize the interference of ongoing network fluctuations, we jittered the spikes within a window of ±15 ms and compared the jittered and raw STAs (Hatsopoulos et al., 2003; Fujisawa et al., 2008). Spike jittering will disrupt any correlations of durations shorter than the jittering window, including postsynaptic potentials, which likely occur immediately after the spikes (∼1 ms) and peak within 10 ms (Feldmeyer et al., 2002; Bruno and Sakmann, 2006). Furthermore, we compared the jitter-corrected Vm-STAs between visual and electrical stimulation conditions.
An experiment with juxtacellular recording of the simple cell and whole-cell recording of the complex cell is illustrated in Fig. 5. Visual stimulation evoked strong responses in both cells (Fig. 5A,B), The Vm-STA of this pair during visual stimulation (Vm-STAV) showed the usual asymmetrical shape (Fig. 5C): The complex cell started to depolarize at −3.4 ms relative to the simple-cell spike, and the depolarization reached maximum at 5.3 ms with a peak-to-peak amplitude of 2.8 mV. The spike cross-correlation was also highly asymmetrical with a significant peak at 3 ms (Fig. 5C, top right). Spike jittering eliminated the tight coupling in Vm-STAV and the spike cross-correlation (Fig. 5C, top, cyan). When the simple cell was driven electrically (5 nA, 250 ms duration, 1 Hz, no visual stimulation), it fired at about 44 Hz (Fig. 5D,E), whereas Vm of the complex cell slowly fluctuated because of ongoing spontaneous activity. The raw Vm STA during juxtacellular stimulation (Vm-STAE) did not show tight coupling (Fig. 5F, green). In fact, the jittered Vm-STAE was not statistically different from the raw Vm-STAE (Fig. 5F, compare cyan and green lines), suggesting that juxtacellular spikes did not evoke significant postsynaptic potentials. Similarly, the spike cross-correlation did not show a significant peak (Fig. 5F, top right).
Short-term depression has been reported for synapses between layer 4 and layer 2/3 neurons, although sequential EPSPs summate over time such that postsynaptic depolarization builds up (Feldmeyer et al., 2002; Bannister and Thomson, 2007). To examine whether the absence of coupling in Vm-STAE is caused by synaptic depression, we performed two additional analyses. First, we verified that mean Vm during the 250 ms epochs with juxtacellularly evoked spikes was not significantly different from that during epochs without juxtacellular current injection (p = 0.87, paired t test; see Fig. 5E). Second, we plotted the distribution of ISIs for visually and electrically evoked spikes (Fig. 5G) and found that a majority of ISIs under either condition was between 5 and 50 ms (61% visual, 86% juxtacellular). If high-frequency spikes depressed simple–complex synapses, hence preventing the detection of postsynaptic potentials triggered by electrically evoked spikes, it should also do so during the visually evoked activity. Accordingly, the amplitude of Vm-STAV should be significantly reduced for short ISI spikes. It was not the case, however (Fig. 5H, left, red): when only considering short ISI spikes, we found the amplitude of Vm-STAV similar to that constructed using all spikes and the difference between Vm-STAE and Vm-STAV remained (Fig. 5H, left). Similarly, we built STAs using spikes that were elicited after long ISIs (>100 ms; Fig. 5G), a large fraction of which occurred at the onset of either visual or electrical stimulation (compare spike trains in Fig. 5G). Again, we observed a large difference between Vm-STAE and Vm-STAV (Fig. 5H, right). Given these results, we conclude that short-term depression does not likely account for the contrast between Vm-STAE and Vm-STAV. We suggest that the coupling observed in Vm-STAV was not caused by the spikes of the recorded simple cell but originated instead from other cells that were presynaptic to the recorded complex cell and fired at about the same time as the recorded simple cell.
We also tested connectivity in six pairs with juxtacellular stimulation (four pairs are shown in Fig. 6) and two pairs with intracellular current injection when the simple cell was recorded in the whole-cell configuration. In all but one pair (#7), the waveform of Vm-STAV was different from the waveform of Vm-STAE (Fig. 6A–D, pairs #4–#6). We performed the same analysis as we did in Figure 5, G and H, to confirm that the difference is not caused by short-term depression (data not shown). Finally, subtracting Vm-STAE from Vm-STAV yielded a Vm-STA waveform that corresponded to a network effect when the recorded simple cell fired spikes (Fig. 6E).
In two pairs (Fig. 6, #6 and #7), when the spikes of the simple cells were evoked by juxtacellular stimulation, significant depolarization of the complex cell was detected, suggesting that cells in these pairs were monosynaptically connected. The size of these putative connections in both pairs was small (0.13 and 0.22 mV, estimated as the difference between the peak of Vm-STA and the average between −10 ms and the zero-lag). The latency of the depolarization was 1 ms, estimated as the time from the spike to 5% of the total PSP amplitude), and the depolarization reached the peak in <10 ms (9.4 and 3.8 ms). Although spikes after a long pause (>40 ms) appeared to have slightly larger amplitude (Fig. 7, red traces, 0.17 and 0.25 mV), spikes that followed intervals <40 ms still evoked apparent depolarization (Fig. 7, blue traces, 0.10 and 0.20 mV). In other words, short-term depression could potentially reduce the efficacy of these synapses in vivo but did not dominate such that high-frequency (e.g., >25 Hz) spike trains failed to excite postsynaptic cells. It further suggests that it is not simply because of a strong synaptic depression that single-cell stimulation did not reveal significant connectivity in other pairs.
Figure 7.

Short-term depression of layer 4-to-layer 2/3 synapses. Spikes were divided by prespike ISIs. Vm-STAs were calculated with either short (blue) or long (red) ISI spikes (jittered Vm-STAs corrected; jittering window, ±15 ms; 1000 iterations). Vm-STAs calculated with all spikes are in black. The small dip before the origin is caused by the subtraction of jittered Vm-STAs.
Correlated synaptic inputs
The delayed peak in simple–complex Vm-STAs suggests that when visual information propagates through cortical layers, simple cells in layer 4 are activated before complex cells in layer 2/3. This activity relay likely occurs repeatedly throughout the stimulation period, giving rise to the numerous Vm excursions in visual responses (cf. the complex cell's Vm traces in Figs. 1, 2, and 5). The Vm-STA coupling should also be revealed at the level of the membrane potential: the synaptic inputs that simple and complex cells receive should be correlated but shift in time relative to one another. To test this prediction, we made dual whole-cell recordings from pairs of simple and complex cells (five pairs) and constructed Vm cross-correlations separately for periods of the response when the simple-cell Vm was near the peak of the visually evoked sinusoidal modulation and when the simple-cell Vm was at the trough of the modulation (Fig. 8A). We found that the shift in correlation was only present near the peak.
Figure 8B–D, shows three pairs of cells. In the first pair (pair #8), during the brief moments when both cells were depolarized by the visual stimulus, barrages of inputs arrived at the simple cell (Fig. 8, red) first and reached the complex cell (Fig. 8, blue) roughly 10–20 ms later (two such barrages are labeled with arrows in the expanded traces for pair #8; Fig. 8B). We calculated Vm cross-correlation for these periods and high-pass filtered (>5 Hz) the correlation to compare temporal components that are relevant to the functional coupling (Fig. 8C). When the simple cell was depolarized and both cells were activated, compared with blank stimulation, the Vm cross-correlation shifted by 14.6 ms in the simple-to-complex (positive) direction (Fig. 8C, pair #8, compare green trace with black trace). During the depolarizing period, the shape of the Vm cross-correlation matched the waveform of the Vm-STA, likely explaining the Vm-STA's source (pair #8; Fig. 8, compare C, green trace, D, blue trace). The temporal offset in synaptic inputs was also evident in pairs #9 and #10, with rightward shifts between the black and green traces of 6.5 and 12.6 ms (two additional pairs, 8.6 and 4.0 ms, not shown).
In contrast, the temporal shift was not observed during the hyperpolarized periods (compare orange trace with black trace). During such periods, the simple cell was hyperpolarized and received few excitatory inputs, whereas the complex cell, as predicted from its phase invariance, was still driven strongly (other sets of simple cells with different spatial phases were now driving the complex cells, likely with a similar form of synchronous activity).
Discussion
Using in vivo paired recordings, we have constructed spike-triggered averages of the membrane potential (Vm-STAs) between simple-cell spikes and complex-cell Vm to explore their functional relationship. A majority of pairs (29 of 34, or 85%) exhibit significant Vm-STAs (median, 1 mV) during visual stimulation. When the simple cells are stimulated electrically in the absence of visual stimulation, however, both the likelihood and amplitude of evoked potentials in complex cells fall dramatically (two of nine, or 22%; 0.1–0.2 mV). It does not seem likely, then, that Vm-STAs recorded during visual stimulation arise from direct monosynaptic connections, but rather reflect concerted feedforward inputs from multiple layer 4 simple cells whose spiking activity is synchronized. The direction of coupling in Vm-STA is consistent with Hubel and Wiesel's feedforward model for building the complex receptive fields and may be a general feature of feedforward processing within a cortical column (Atencio and Schreiner, 2010; Takeuchi et al., 2011). Our results can also be compared with synchrony of the presynaptic population in the retinogeniculate and geniculocortical pathways and the output from V1 (Cleland et al., 1971; Alonso et al., 1996; Jia et al., 2013), demonstrating that synchronous activity mediates information transmission across different stages of the early visual system.
Through in vivo intracellular recordings, we and others have reported high-frequency Vm fluctuations during visual stimulation in cat V1 (Jagadeesh et al., 1992; J. Anderson et al., 2000; Volgushev et al., 2003; Cardin et al., 2005; Yu and Ferster, 2010), which likely reflect rapid sequences of correlated excitatory and inhibitory synaptic inputs (Okun and Lampl, 2008). In our hands, the fluctuations are often observed in layer 2/3 complex cells during optimal stimulation with drifting gratings, riding on top of the large mean depolarization characteristic of complex cells. Previous studies have characterized the stimulus dependence and interneuronal correlation of the high-frequency components. Here, we consider their origin.
In simple–complex pairs that showed Vm-STAs of significant amplitude during visual stimulation, the depolarization onset was close to but often preceded the time of spike occurrence. And a hyperpolarization often preceded the depolarization, which itself began tens of milliseconds before the simple cell's spike. These features of the STA waveform suggest that the synaptic connection from the recorded simple cell does not by itself account for the full shape of the STA. On the other hand, common geniculate inputs to these two types of cells with a fixed conduction delay could potentially produce displaced peaks in STAs but cannot explain the long peak time (10 ms) and are not consistent with the anatomy of layer 4-to-layer 2/3 circuits because complex cells that receive a strong direct geniculate input are only found in layer 3 (Ferster and Lindstrom, 1983). We then hypothesize that a number of simple cells firing in concert with the recorded simple cell likely contribute to the Vm-STA coupling. Consistent with this interpretation, when the simple cell was activated using juxtacellular or intracellular stimulation in the absence of visual stimulation, the spike-triggered depolarization in the complex cell was often not statistically significant (seven of nine pairs; Figs. 5, 6). In two pairs, significant spike-triggered depolarizations were observed, and their amplitudes were small (0.1–0.2 mV). The depolarization onsets were around 1 ms after the simple-cell spikes, with a much smaller prior hyperpolarization, more consistent with the expected properties of monosynaptic connections.
The circuit diagram in Figure 9 highlights the population activity that we infer from the data. Within a subset of simple cells that have similar spatial-phase selectivity (Fig. 9, red circle), only some (Fig. 9, bold red circles) connect synaptically to the recorded complex cell (Fig. 9, filled blue circle). When a sufficient number of these simple cells fire, they generate a depolarization in the complex cell (Fig. 9B). The recorded simple cell (Fig. 9, filled red circle) also fires in near synchrony with this subset of simple cells, so that a Vm-STA constructed from its spikes contains a depolarization, which is at least partially generated by its neighbors. The width and rise time of the Vm-STAs reflect an ∼10 ms window of synchrony in the presynaptic population (Fig. 9C, red). The hyperpolarization just before the simple cell spike would reflect the decreased probability of firing that occurs in all the simple cells just before their synchronized spikes. In this simple arrangement, nearby complex cells will likely receive many of their simple cell inputs in common, and their Vm should therefore tend to oscillate in synchrony, which explains the nearly symmetrical Vm-STAs and Vm cross-correlations between nearby complex cells (Lampl et al., 1999; Yu and Ferster, 2010; Fig. 9C, green).
Figure 9.

A circuit diagram for population dynamics in L4 to L2/3 circuits. A, Cortical circuit diagram. Layer 2/3 complex cells show widespread synchronous Vm fluctuations and only a small percentage (bold) of the nearby cells connect to the recorded cell (filled blue circle). In layer 4, simple cells are grouped functionally into different subsets (e.g., red and purple) based on their spatial-phase selectivity. Within each subset, only a small percentage of cells (bold) synaptically connect to the recorded layer 2/3 cell. A recorded simple cell (filled red circle) is shown with its possible connection to the recorded layer 2/3 cell (dashed line). This pair of recorded cells is pair #2 in Figure 2. B, Vm activity of the recorded layer 2/3 cell during visual stimulation (blue). The corresponding drifting grating is shown (brown). Red tick marks are spikes of the recorded simple cell in the pair. A depolarizing transient (13 mV, 12 ms) is highlighted in cyan and expanded. Hypothetical local population activity is illustrated with reference to the Vm depolarization. An increase of layer 4 population activity (red) occurs around the onset of the transient. The recorded simple cell (red tick marks) belongs to the population. Activity of layer 2/3 complex cells (green) grows toward the peak of the transient. C, Different waveforms of couplings in simple–complex pairs (red, 12 pairs) and complex–complex pairs (green, 4 pairs).
The extracellular analog of Vm-STA, spike cross-correlation between pairs of extracellularly recorded neurons, has been applied to the study of interactions between cortical neurons during activity triggered by sensory, motor, or cognitive events (Fetz et al., 1991). Although spike cross-correlations can often miss uncovering intracortical monosynaptic connections that are too weak, the feedforward connections between simple and complex cells are thought to be strong enough to be studied with this technique (Alonso and Martinez, 1998; Martinez and Alonso, 2001). The asymmetrical spike cross-correlograms obtained from simple–complex pairs in layers 4 and 2/3 have similar features to the Vm-STA waveforms we have observed: the spike cross-correlograms are often asymmetrical in time, showing a decrease below baseline before the triggering spike in the simple cell, a rise from this decrease that begins before zero-lag, and a rise time of ∼10 ms. These correlograms have been interpreted as evidence for monosynaptic connections between the recorded cells (Alonso and Martinez, 1998; Martinez and Alonso, 2001). We found, however, that the Vm-STAs that likely underlie these correlations subside in the absence of visual stimulation. When the simple cell was activated independently, the waveform of spike-triggered signals changed dramatically and often dropped below chance (Figs. 5, 6).
To link spike correlations to the underlying synaptic connectivity, the lateral correlations within the presynaptic and postsynaptic populations must be low (Reid, 2001), and the network must be in an asynchronous state (Ginzburg and Sompolinsky, 1994). In the visual system, synchrony has been inferred or recorded for both retinogeniculate and geniculocortical pathways (Cleland et al., 1971; Alonso et al., 1996) as well as intracortical circuits (Ts'o et al., 1986; Kohn and Smith 2005). Fast spike synchrony between layer 4 simple cells has not been thoroughly studied in cat V1 (DeAngelis et al., 1999) but has been demonstrated for layer 4 cells in monkey V1 (Briggs et al., 2013; Smith et al., 2013). It is not implausible that synchrony among simple cells exists, given that there is considerable synchrony in the firing of the LGN cells, which provide the dominant input to layer 4 simple cells (Alonso et al., 1996; Wang et al., 2010). It is also possible that lateral connections between layer 4 simple cells contribute to synchrony. If such connections are an important factor, they likely link groups of simple cells with similar receptive-field spatial phases, since the temporal shift in Vm correlations between simple and complex cells primarily disappeared during the hyperpolarizing phase of the response to drifting gratings (Fig. 8). Additional experiments are necessary to characterize the spike synchrony among simple cells. Our prediction is that the synchrony correlates with the magnitude of high-frequency fluctuations in the upper layers.
Transmission of sensory information in the cortical and thalamocortical systems does not seem to make use of strong individual synaptic connections. In the rat vibrissal pathway, a single thalamic cell only provides a 0.5 mV unitary input to layer 4 cells in vivo (Bruno and Sakmann, 2006). The strength of connections from layer 4 to layer 2/3 have so far only been measured in brain slices, showing a wide range of size distribution: from 0.15–0.2 to 2 mV (Anderson et al., 1994; Feldmeyer et al., 2002; Thomson et al., 2002; Bannister and Thomson, 2007; Thomson and Lamy, 2007; Lefort et al., 2009). Note, however, that the in vitro results may not apply directly to in vivo function. In the intact brain, the membrane conductance of cortical neurons is high because of the increased levels of both ongoing and evoked synaptic activity (Paré et al., 1998; Shadlen and Newsome, 1998; J. S. Anderson et al., 2000; Haider et al., 2006; Kumar et al., 2008). An increase in membrane conductance, along with a depolarized Vm, should considerably reduce the incremental effect of individual synaptic inputs (Kuhn et al., 2004). Additionally, cortical synapses in vivo could maintain a standing level of short-term depression because of strong neural activity (Boudreau and Ferster, 2005). Therefore, considering that simple cells often fire above 20 Hz during visual stimulation, it is quite plausible that simple cells drive complex cells through weak individual synapses.
In summary, we propose that the propagation of activity from layer 4 simple cells to layer 2/3 complex cells is mediated by weak but synchronous synaptic inputs. This proposal is consistent with the correlated firing (i.e., asymmetrical spike cross-correlograms) and Vm-STA coupling between simple and complex cells (Alonso and Martinez, 1998; present study), the large-amplitude and high-frequency Vm fluctuations in complex cells during visual stimulation, and the synchrony of the fluctuations between complex cells (Yu and Ferster, 2010).
Footnotes
This work was supported by NIH Grant R01 EY04726 to D.F. We thank Drs. Nicholas Priebe and Nuo Li for helpful discussions.
References
- Alonso JM, Martinez LM. Functional connectivity between simple cells and complex cells in cat striate cortex. Nat Neurosci. 1998;1:395–403. doi: 10.1038/1609. [DOI] [PubMed] [Google Scholar]
- Alonso JM, Usrey WM, Reid RC. Precisely correlated firing in cells of the lateral geniculate nucleus. Nature. 1996;383:815–819. doi: 10.1038/383815a0. [DOI] [PubMed] [Google Scholar]
- Amarasingham A, Harrison MT, Hatsopoulos NG, Geman S. Conditional modeling and the jitter method of spike resampling. J Neurophysiol. 2012;107:517–531. doi: 10.1152/jn.00633.2011. [DOI] [PMC free article] [PubMed] [Google Scholar]
- Anderson J, Lampl I, Reichova I, Carandini M, Ferster D. Stimulus dependence of two-state fluctuations of membrane potential in cat visual cortex. Nat Neurosci. 2000;3:617–621. doi: 10.1038/75797. [DOI] [PubMed] [Google Scholar]
- Anderson JC, Douglas RJ, Martin KA, Nelson JC. Synaptic output of physiologically identified spiny stellate neurons in cat visual cortex. J Comp Neurol. 1994;341:16–24. doi: 10.1002/cne.903410103. [DOI] [PubMed] [Google Scholar]
- Anderson JS, Carandini M, Ferster D. Orientation tuning of input conductance, excitation, and inhibition in cat primary visual cortex. J Neurophysiol. 2000;84:909–926. doi: 10.1152/jn.2000.84.2.909. [DOI] [PubMed] [Google Scholar]
- Atencio CA, Schreiner CE. Columnar connectivity and laminar processing in cat primary auditory cortex. PLoS One. 2010;5:e9521. doi: 10.1371/journal.pone.0009521. [DOI] [PMC free article] [PubMed] [Google Scholar]
- Bannister AP, Thomson AM. Dynamic properties of excitatory synaptic connections involving layer 4 pyramidal cells in adult rat and cat neocortex. Cereb Cortex. 2007;17:2190–2203. doi: 10.1093/cercor/bhl126. [DOI] [PubMed] [Google Scholar]
- Boudreau CE, Ferster D. Short-term depression in thalamocortical synapses of cat primary visual cortex. J Neurosci. 2005;25:7179–7190. doi: 10.1523/JNEUROSCI.1445-05.2005. [DOI] [PMC free article] [PubMed] [Google Scholar]
- Brainard DH. The Psychophysics Toolbox. Spat Vis. 1997;10:433–436. doi: 10.1163/156856897X00357. [DOI] [PubMed] [Google Scholar]
- Briggs F, Mangun GR, Usrey WM. Attention enhances synaptic efficacy and the signal-to-noise ratio in neural circuits. Nature. 2013;499:476–480. doi: 10.1038/nature12276. [DOI] [PMC free article] [PubMed] [Google Scholar]
- Bruno RM, Sakmann B. Cortex is driven by weak but synchronously active thalamocortical synapses. Science. 2006;312:1622–1627. doi: 10.1126/science.1124593. [DOI] [PubMed] [Google Scholar]
- Carandini M, Ferster D. Membrane potential and firing rate in cat primary visual cortex. J Neurosci. 2000;20:470–484. doi: 10.1523/JNEUROSCI.20-01-00470.2000. [DOI] [PMC free article] [PubMed] [Google Scholar]
- Cardin JA, Palmer LA, Contreras D. Stimulus-dependent gamma (30–50 Hz) oscillations in simple and complex fast rhythmic bursting cells in primary visual cortex. J Neurosci. 2005;25:5339–5350. doi: 10.1523/JNEUROSCI.0374-05.2005. [DOI] [PMC free article] [PubMed] [Google Scholar]
- Cleland BG, Dubin MW, Levick WR. Simultaneous recording of input and output of lateral geniculate neurones. Nat New Biol. 1971;231:191–192. doi: 10.1038/newbio231191a0. [DOI] [PubMed] [Google Scholar]
- DeAngelis GC, Ghose GM, Ohzawa I, Freeman RD. Functional micro-organization of primary visual cortex: receptive field analysis of nearby neurons. J Neurosci. 1999;19:4046–4064. doi: 10.1523/JNEUROSCI.19-10-04046.1999. [DOI] [PMC free article] [PubMed] [Google Scholar]
- Feldmeyer D, Lübke J, Silver RA, Sakmann B. Synaptic connections between layer 4 spiny neurone-layer 2/3 pyramidal cell pairs in juvenile rat barrel cortex: physiology and anatomy of interlaminar signalling within a cortical column. J Physiol. 2002;538:803–822. doi: 10.1113/jphysiol.2001.012959. [DOI] [PMC free article] [PubMed] [Google Scholar]
- Ferster D, Lindström S. An intracellular analysis of geniculo-cortical connectivity in area 17 of the cat. J Physiol. 1983;342:181–215. doi: 10.1113/jphysiol.1983.sp014846. [DOI] [PMC free article] [PubMed] [Google Scholar]
- Fetz E, Toyama K, Smith W. Synaptic interactions between cortical neurons. In: Peters A, Jones EG, editors. Cerebral cortex. New York: Plenum; 1991. pp. 1–47. [Google Scholar]
- Fujisawa S, Amarasingham A, Harrison MT, Buzsáki G. Behavior-dependent short-term assembly dynamics in the medial prefrontal cortex. Nat Neurosci. 2008;11:823–833. doi: 10.1038/nn.2134. [DOI] [PMC free article] [PubMed] [Google Scholar]
- Gilbert CD. Laminar differences in receptive field properties of cells in cat primary visual cortex. J Physiol. 1977;268:391–421. doi: 10.1113/jphysiol.1977.sp011863. [DOI] [PMC free article] [PubMed] [Google Scholar]
- Ginzburg I, Sompolinsky H. Theory of correlations in stochastic neural networks. Phys Rev E Stat Phys Plasmas Fluids Relat Interdiscip Topics. 1994;50:3171–3191. doi: 10.1103/PhysRevE.50.3171. [DOI] [PubMed] [Google Scholar]
- Haider B, Duque A, Hasenstaub AR, McCormick DA. Neocortical network activity in vivo is generated through a dynamic balance of excitation and inhibition. J Neurosci. 2006;26:4535–4545. doi: 10.1523/JNEUROSCI.5297-05.2006. [DOI] [PMC free article] [PubMed] [Google Scholar]
- Hatsopoulos NG, Geman S, Amarasingham A, Bienenstock E. At what time scale does the nervous system operate? Neurocomputing. 2003;52–54:25–29. [Google Scholar]
- Houweling AR, Brecht M. Behavioural report of single neuron stimulation in somatosensory cortex. Nature. 2008;451:65–68. doi: 10.1038/nature06447. [DOI] [PubMed] [Google Scholar]
- Houweling AR, Doron G, Voigt BC, Herfst LJ, Brecht M. Nanostimulation: manipulation of single neuron activity by juxtacellular current injection. J Neurophysiol. 2010;103:1696–1704. doi: 10.1152/jn.00421.2009. [DOI] [PubMed] [Google Scholar]
- Hubel DH, Wiesel TN. Receptive fields, binocular interaction and functional architecture in the cat's visual cortex. J Physiol. 1962;160:106–154. doi: 10.1113/jphysiol.1962.sp006837. [DOI] [PMC free article] [PubMed] [Google Scholar]
- Jagadeesh B, Gray CM, Ferster D. Visually evoked oscillations of membrane potential in cells of cat visual cortex. Science. 1992;257:552–554. doi: 10.1126/science.1636094. [DOI] [PubMed] [Google Scholar]
- Jia X, Tanabe S, Kohn A. Gamma and the coordination of spiking activity in early visual cortex. Neuron. 2013;77:762–774. doi: 10.1016/j.neuron.2012.12.036. [DOI] [PMC free article] [PubMed] [Google Scholar]
- Kohn A, Smith MA. Stimulus dependence of neuronal correlation in primary visual cortex of the macaque. J Neurosci. 2005;25:3661–3673. doi: 10.1523/JNEUROSCI.5106-04.2005. [DOI] [PMC free article] [PubMed] [Google Scholar]
- Kuhn A, Aertsen A, Rotter S. Neuronal integration of synaptic input in the fluctuation-driven regime. J Neurosci. 2004;24:2345–2356. doi: 10.1523/JNEUROSCI.3349-03.2004. [DOI] [PMC free article] [PubMed] [Google Scholar]
- Kumar A, Schrader S, Aertsen A, Rotter S. The high-conductance state of cortical networks. Neural Comput. 2008;20:1–43. doi: 10.1162/neco.2008.20.1.1. [DOI] [PubMed] [Google Scholar]
- Lampl I, Reichova I, Ferster D. Synchronous membrane potential fluctuations in neurons of the cat visual cortex. Neuron. 1999;22:361–374. doi: 10.1016/S0896-6273(00)81096-X. [DOI] [PubMed] [Google Scholar]
- Lefort S, Tomm C, Floyd Sarria JC, Petersen CC. The excitatory neuronal network of the C2 barrel column in mouse primary somatosensory cortex. Neuron. 2009;61:301–316. doi: 10.1016/j.neuron.2008.12.020. [DOI] [PubMed] [Google Scholar]
- Letelier JC, Weber PP. Spike sorting based on discrete wavelet transform coefficients. J Neurosci Methods. 2000;101:93–106. doi: 10.1016/S0165-0270(00)00250-8. [DOI] [PubMed] [Google Scholar]
- Martinez LM, Alonso JM. Construction of complex receptive fields in cat primary visual cortex. Neuron. 2001;32:515–525. doi: 10.1016/S0896-6273(01)00489-5. [DOI] [PubMed] [Google Scholar]
- Okun M, Lampl I. Instantaneous correlation of excitation and inhibition during ongoing and sensory-evoked activities. Nat Neurosci. 2008;11:535–537. doi: 10.1038/nn.2105. [DOI] [PubMed] [Google Scholar]
- Paré D, Shink E, Gaudreau H, Destexhe A, Lang EJ. Impact of spontaneous synaptic activity on the resting properties of cat neocortical pyramidal neurons In vivo. J Neurophysiol. 1998;79:1450–1460. doi: 10.1152/jn.1998.79.3.1450. [DOI] [PubMed] [Google Scholar]
- Pelli DG. The Video Toolbox software for visual psychophysics: transforming numbers into movies. Spat Vis. 1997;10:437–442. doi: 10.1163/156856897X00366. [DOI] [PubMed] [Google Scholar]
- Pinault D. A novel single-cell staining procedure performed in vivo under electrophysiological control: morpho-functional features of juxtacellularly labeled thalamic cells and other central neurons with biocytin or Neurobiotin. J Neurosci Methods. 1996;65:113–136. doi: 10.1016/0165-0270(95)00144-1. [DOI] [PubMed] [Google Scholar]
- Priebe NJ, Ferster D. Mechanisms of neuronal computation in mammalian visual cortex. Neuron. 2012;75:194–208. doi: 10.1016/j.neuron.2012.06.011. [DOI] [PMC free article] [PubMed] [Google Scholar]
- Priebe NJ, Mechler F, Carandini M, Ferster D. The contribution of spike threshold to the dichotomy of cortical simple and complex cells. Nat Neurosci. 2004;7:1113–1122. doi: 10.1038/nn1310. [DOI] [PMC free article] [PubMed] [Google Scholar]
- Quiroga RQ, Nadasdy Z, Ben-Shaul Y. Unsupervised spike detection and sorting with wavelets and superparamagnetic clustering. Neural Comput. 2004;16:1661–1687. doi: 10.1162/089976604774201631. [DOI] [PubMed] [Google Scholar]
- Reid RC. Divergence and reconvergence: multielectrode analysis of feedforward connections in the visual system. Prog Brain Res. 2001;130:141–154. doi: 10.1016/S0079-6123(01)30010-9. [DOI] [PubMed] [Google Scholar]
- Shadlen MN, Newsome WT. The variable discharge of cortical neurons: implications for connectivity, computation, and information coding. J Neurosci. 1998;18:3870–3896. doi: 10.1523/JNEUROSCI.18-10-03870.1998. [DOI] [PMC free article] [PubMed] [Google Scholar]
- Smith MA, Jia X, Zandvakili A, Kohn A. Laminar dependence of neuronal correlations in visual cortex. J Neurophysiol. 2013;109:940–947. doi: 10.1152/jn.00846.2012. [DOI] [PMC free article] [PubMed] [Google Scholar]
- Takeuchi D, Hirabayashi T, Tamura K, Miyashita Y. Reversal of interlaminar signal between sensory and memory processing in monkey temporal cortex. Science. 2011;331:1443–1447. doi: 10.1126/science.1199967. [DOI] [PubMed] [Google Scholar]
- Thomson AM, Lamy C. Functional maps of neocortical local circuitry. Front Neurosci. 2007;1:19–42. doi: 10.3389/neuro.01.1.1.002.2007. [DOI] [PMC free article] [PubMed] [Google Scholar]
- Thomson AM, West DC, Wang Y, Bannister AP. Synaptic connections and small circuits involving excitatory and inhibitory neurons in layers 2–5 of adult rat and cat neocortex: triple intracellular recordings and biocytin labelling in vitro. Cereb Cortex. 2002;12:936–953. doi: 10.1093/cercor/12.9.936. [DOI] [PubMed] [Google Scholar]
- Ts'o DY, Gilbert CD, Wiesel TN. Relationships between horizontal interactions and functional architecture in cat striate cortex as revealed by cross-correlation analysis. J Neurosci. 1986;6:1160–1170. doi: 10.1523/JNEUROSCI.06-04-01160.1986. [DOI] [PMC free article] [PubMed] [Google Scholar]
- Volgushev M, Pernberg J, Eysel UT. Gamma-frequency fluctuations of the membrane potential and response selectivity in visual cortical neurons. Eur J Neurosci. 2003;17:1768–1776. doi: 10.1046/j.1460-9568.2003.02609.x. [DOI] [PubMed] [Google Scholar]
- Wang HP, Spencer D, Fellous JM, Sejnowski TJ. Synchrony of thalamocortical inputs maximizes cortical reliability. Science. 2010;328:106–109. doi: 10.1126/science.1183108. [DOI] [PMC free article] [PubMed] [Google Scholar]
- Yu J, Ferster D. Membrane potential synchrony in primary visual cortex during sensory stimulation. Neuron. 2010;68:1187–1201. doi: 10.1016/j.neuron.2010.11.027. [DOI] [PMC free article] [PubMed] [Google Scholar]