Abstract
Computed tomography (CT) chest is widely used as an adjunct to clinical examination and pulmonary function tests in the evaluation of unexplained dyspnoea. In such patients, heterogeneous lung attenuation is a common finding on CT. Heterogeneous lungs can be caused by varying regional aeration, varying regional perfusion, and ground glass opacities (GGO) representing airspace or interstitial pathology. It does not serve the referring clinicians or the patients well if the radiology report simply mentions the heterogeneity of the lungs without due analysis of the cause of heterogeneity and a meaningful differential diagnosis. Therefore, it is imperative for the radiologist and the treating pulmonologist to have an in-depth understanding of the pathogenesis of pulmonary heterogeneity. This, in conjunction with clinical data, can narrow the differential diagnosis or, at times, lead to specific diagnoses. The purpose of this review is to familiarize readers with the CT representation of heterogeneities in aeration and perfusion of the lung, relate patterns of GGO to underlying pathology, and provide illustrative case studies highlighting the radiological approach to heterogeneous lungs.
KEY WORDS: Ground glass opacity, heterogeneous lungs, heterogeneous lung attenuation, mosaic attenuation, mosaic perfusion
INTRODUCTION
Computed tomography (CT) of the lungs is an invaluable adjunct in the diagnostic work-up of lung disease. The normal lung has a characteristic pattern of X-ray attenuation, with each region's attenuation (in Hounsfield units) being determined by the average of the relative content of air (most negative), fatty tissue, normal tissue, water (zero), blood, and exogenous contrast (most positive), excluding bone that comprises a part of the chest wall. The attenuation pattern is converted to a composite grayscale image corresponding to the anatomical structures such as airspaces, airways, and blood vessels. In a normal lung, the overall attenuation depends mostly on the degree of aeration (air content) and the degree of perfusion (blood content). Thus, any regional abnormality of either perfusion or aeration translates into visible heterogeneity on CT study of the lungs, referred to as heterogeneous lung attenuation.[1] Another important mechanism of heterogeneity is increased lung attenuation, caused either by thickening of interstitium or filling of alveoli with fluid, cells, or both [Table 1]. Systematic analysis and interpretation of heterogeneous lung attenuation is therefore a valuable tool for diagnosis of lung disease.
Table 1.
Primary causes of heterogeneous lung attenuation

BACKGROUND
The topic of interpreting heterogeneous lung attenuation is extensively covered in specialized radiology literature, but is not well-known outside the specialty. Heterogeneous lung attenuation has been described in the literature with terms such as mosaic perfusion (MP), ground glass opacification (GGO), and mosaic attenuation (MA).[2] These terms are often interchangeably used without consideration of the subtle underlying pathophysiological differences that were intended when these terms were coined. Herein, we have presented a simple schema of how pathological changes in lung correspond to changes in CT appearance. We have highlighted these differences using illustrative cases and have provided an algorithmic approach to relating them back to the underlying pathogenesis. We have intentionally avoided using the term “mosaic” because heterogeneity is not always a mosaic patchwork limited by interlobular septa, as defined by the Fleischner Society[2,3] and illustrated by a case example in [Figure 1]. We have also preferred to explicitly make the distinction between heterogeneous aeration/perfusion, where possible, based on CT features.
Figure 1.
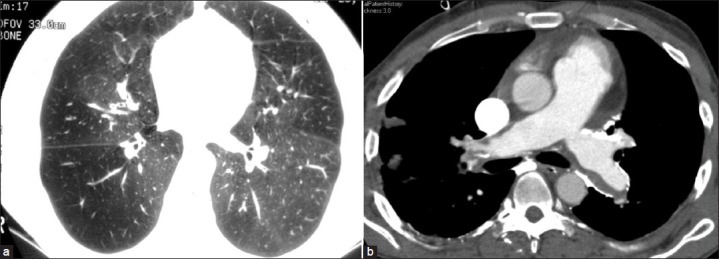
(a) Heterogeneous lungs without a polygonal “mosaic” pattern (b) in a case of chronic pulmonary thromboembolism evident by dilated main pulmonary artery, eccentric filling defects, and mural calcifications
APPROACH TO INTERPRETING HETEROGENEOUS LUNG ATTENUATION
For the systematic analysis of heterogeneous lung attenuation, the first question to be addressed should be-Which region is abnormal? Is it the dense or the lucent region? One can be easily be tempted into regarding the denser region as abnormal when encountered in the lungs. For example, in cases with GGO, the dense region will be clearly much more attenuating than a normal lung, leading the radiologist to confidently conclude the presence of GGO. However, when the attenuation differences are subtle, the help of ancillary findings becomes essential. This is where we must ask the question whether the heterogeneity corresponds to differences in blood flow or due to differences in aeration.
Blood flow into the lung depends upon a number of factors, including the concentration of blood vessels, their calibre, and the driving pressure. The last can be usually neglected since it is a systemic parameter and not a regional one. Blood vessel concentration can be reduced by destruction of vessels, as in vasculitis or advanced emphysema. The calibre of blood vessels can be affected either by occlusion as in chronic thromboembolism, remodeling, or redistribution as in pulmonary arterial or venous hypertension or reflex vasoconstriction secondary to hypoxia, bronchoconstriction, or bronchial obstruction. The final result of each of these mechanisms, whether primarily vascular or not, is varying perfusion and heterogeneous attenuation. Regions with increased blood flow will be denser than regions with decreased perfusion and usually represent the relatively normal appearing lung, which is easy to confuse with a GGO. An illustrative case is shown in [Figure 2]. Heterogeneity of the lungs can be easily seen. The regions of relative hyperlucency show diminished calibre of vessels, but the total number of vessels is normal. This suggests that the dense area is the normal lung and there is vasoconstriction leading to reduced blood flow and, therefore, increased lucency in the diseased portion of the lung, which is commonly secondary to local small airway disease. Clinically, this was a patient with unexplained progressive obstructive lung disease, with no history of smoking but a history of chemical fume exposure. The lungs demonstrate no architectural distortion other than mild dilatation of the bronchi and no evidence of emphysema. Given the clinical context of significant chemical fume exposure and progressive obstructive disease with a lack of response to glucocorticoids or bronchodilators, the possibility of bronchiolitis obliterans was suggested.[4,5,6,7] Detailed pulmonary function testing by impulse oscillometry confirmed that there was a severe fixed, small airways obstruction, with near normal upper airway resistance, consistent with the diagnosis. Due to the lack of definitive therapeutic options such as transplant, conservative medical management was followed without biopsy. This vignette represents a typical scenario, where a finer interpretation of the heterogeneous lungs was helpful in guiding clinical diagnosis. Notably, the relatively increased attenuation of the adjacent lung was originally misconstrued as GGO. It was most likely redistribution of blood flow, away from the diseased lung and toward the normal lung leading to slight hyperattenuation.
Figure 2.
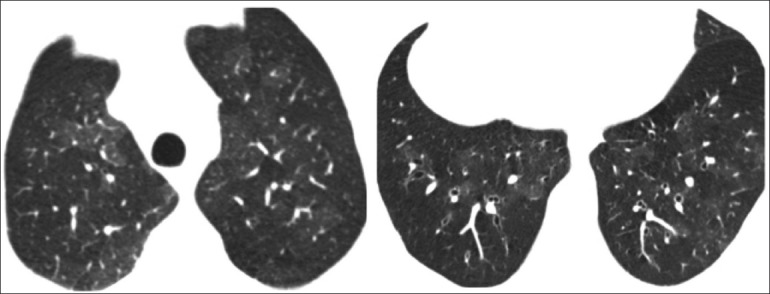
HRCT sections of a 45-year-old male with severe shortness of breath. The hyperlucent regions show diminished calibre of vessels and mild segmental and subsegmental bronchial dilatation. The patient was diagnosed to have fixed small airway disease. A clinical diagnosis of bronchiolitis obliterans was made in view of history of chemical fume exposure, progressive disease, and lack of response to glucocorticoids
Distinguishing between primarily aeration (airway) from perfusion (vascular) etiologies on a single set of images is not straightforward and must be clinically correlated. For example, a history of deep venous thrombosis and no wheeze in the above patient would have been more consistent with prior pulmonary thromboembolism to the affected area with reduction in vascular calibre. Comparing the usual inspiratory CT scans to an expiratory scan can sometimes be helpful, since airway disease-related heterogeneity is further enhanced during expiration, as in the case of asthma [Figure 3],[8] while vascular disease is relatively unaffected. This is rarely needed or done in actual practice because of the availability of other tests as well as cumulative radiation concerns and is not discussed further. However, an important corollary is that a modest degree of heterogeneity can be seen in normal individuals, especially on unintentional expiratory scans [Figure 4].[9] A give-away for an expiratory scan is the bowing of the trachea, as seen in [Figure 4]. These do not need further investigation and must be differentiated from GGO.
Figure 3.
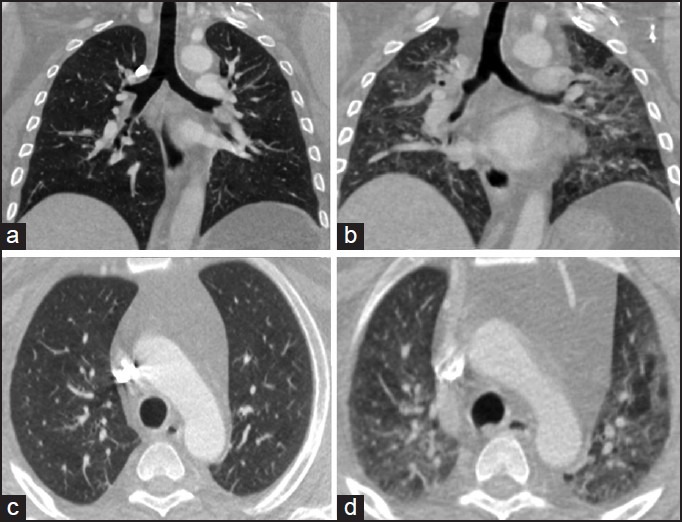
Inspiratory (a) and expiratory (b) thin-section CT images of a 35-year-old male with known asthma and shortness of breath. The lungs demonstrate heterogeneous attenuation, more pronounced on the expiratory scan, indicating areas of air trapping
Figure 4.
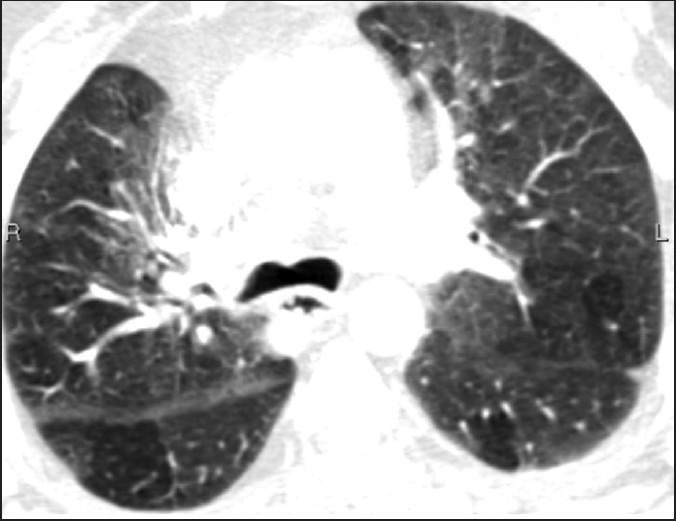
Unintentional expiratory scan in a patient involved in a car accident demonstrating inhomogeneous lungs due to air trapping. Bowing of the posterior wall of the trachea indicates an expiratory phase examination
Patients with pulmonary hypertension may also demonstrate heterogeneous perfusion on CT chest resulting from a redistribution of blood flow to the central zones caused by peripheral vasoconstriction or due to variable lung perfusion [Figure 5]. This is more common in patients with pulmonary artery hypertension (PAH) due to vascular disease as compared to PAH secondary to cardiac or primary lung disease.[10] There are other signs of pulmonary hypertension such as dilated central pulmonary arteries, larger geographic hyperlucent areas in the lung peripheries, or segmental and subsegmental patterns of variable attenuation.[11]
Figure 5.
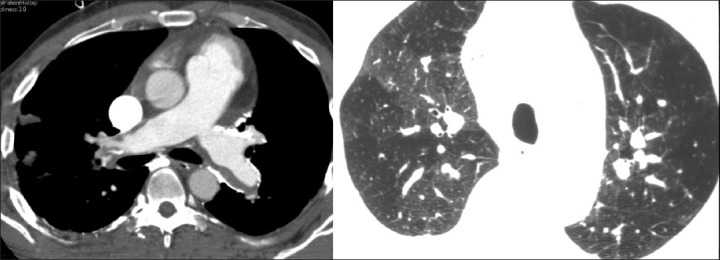
A patient with chronic pulmonary thromboembolism with dilated main pulmonary arteries, wall calcifications, and heterogeneous lungs. Peripheral pruning of the vessels and variable vessel calibre indicate a vascular etiology
GGO refers to increased attenuation of the lung parenchyma on high-resolution CT (HRCT) without obscuring the underlying vascular or bronchial margins, thus differentiating it from consolidation [Figure 6].[9] GGO results from volume averaging of abnormalities that are too small to be clearly delineated on HRCT, such as thickened interstitium, minimal fluid, cells, or fibrosis in the alveoli.[7,12] In a case of patchy GGO, the size and the number of vessels are generally similar in the hazy lung parenchyma as compared to the rest of the lung [Figure 7a]. In some situations, there may even be reduced vascularity in the dense portions of the lung because of shunting of blood away from the affected areas of the lung, such as in acute chest syndrome in a case of sickle cell disease due to pulmonary microvascular occlusion [Figure 7b].[13] This is opposite to what is seen in heterogeneous perfusion, where the increased attenuation is due to increased blood flow [Figure 7c].
Figure 6.
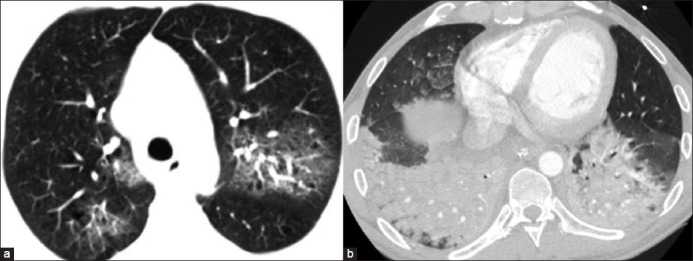
(a) GGO seen as increased attenuation of the lung parenchyma on HRCT without obscuring the underlying vascular or bronchial margins. (b) Consolidation in a case of aspiration pneumonia presents as homogeneous increased parenchymal attenuation in the lower lobes obscuring the vascular and bronchial margins with air bronchogram
Figure 7.

(a) A case of atypical pneumonia demonstrating similar size of vessels in hazy and normal areas of the lungs. (b) A 6-year-old with sickle cell disease with GGO in the posterobasal segment of the right lower lobe and decreased vascularity within the GGO as compared to the normal lung. (c) A case of bronchiolitis obliterans demonstrating heterogeneous attenuation in which the abnormal hyperlucent areas demonstrate diminished vascularity
In an acute setting, the presence of GGO on HRCT usually indicates active and ongoing process, such as active inflammation or edema. It is also essential to assess the distribution of GGO. A lobar or segmental distribution can be seen with bacterial pneumonias or infarcts [Figure 8]. A diffuse and symmetric distribution may be associated with either intrinsic or extrinsic factors. Intrinsic causes are usually systemic in origin. For example, central and posterior-dependent distribution is present in early hydrostatic edema and, often, there is associated septal thickening, with underlying redistribution of blood flow [Figure 9a];[14] peripheral and basal distribution is seen in capillary endothelial damage associated with intrinsic hypersensitivity disorders such as early scleroderma lung [Figure 9b] and other early idiopathic interstitial lung diseases.[15] Extrinsic conditions that manifest as diffuse and symmetric GGO include acute injury caused by toxic fume inhalation, hypersensitivity reactions, acute disseminated air-borne infection, or opportunistic and viral infections [Figures 10a and b]. Other pathological conditions such as inflamed or neoplastic regions of the lung may also manifest as GGO [Figure 11].[16]
Figure 8.

Pulmonary thromboembolism with wedge-shaped GGOs in a segmental distribution suggestive of infarcts
Figure 9.
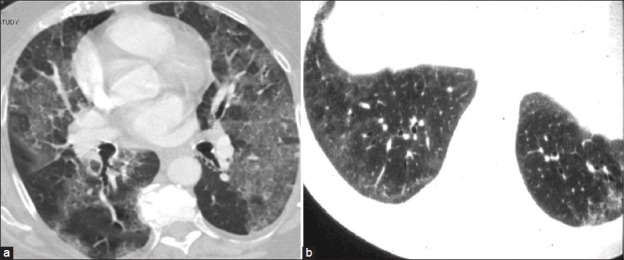
(a) Congestive heart failure with diffuse bilateral GGO and septal thickening. (b) Early scleroderma with peripheral basal distribution of GGO
Figure 10.

(a) A case of H1N1 pneumonia with bilateral GGO with a predominant bronchovascular and subpleural distribution and consolidation. (b) Atypical pnenumonia of unknown microbiological origin with a peripheral distribution
Figure 11.
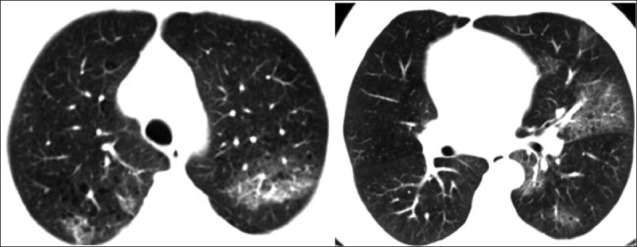
A 53-year-old male with SOB and hemoptysis with patchy GGO and septal thickening on HRCT, diagnosed as brochioloalveolar carcinoma on pathology
Effects of gravity and the resultant dependent distribution help distinguish aspiration from other conditions. The poorly demarcated GGOs in [Figure 12a] have a posterior and gravity dependent distribution. Clinical history is also critical. In another case [Figure 12b], the clinical history was of shortness of breath, chest tightness, and spitting of blood, indicating pulmonary hemorrhage as the most likely etiology of the GGO. Focal, geographic non-segmental GGO in the setting of trauma and usually with a peripheral distribution is indicative of pulmonary contusions [Figure 12c].[17]
Figure 12.

(a) A 56-year-old male with a history of chest pain and fall on CT shows GGOs in a posterior distribution, suggestive of aspiration. (b) Pulmonary hemorrhage presenting as diffuse GGO. (c) Pulmonary contusion seen as peripheral GGO with a fracture of the right scapula
CONCLUSION
Inhomogeneous attenuation secondary to airway or vascular disease and GGO represent distinct processes within the general category of heterogeneous lung attenuation, as depicted schematically in [Figure 13]. Table 2 mentions the most important features of each of these processes on CT study of the lungs that permit reliable discrimination from each other. Often, the picture can be mixed due to multiple processes existing simultaneously with heterogeneity due to some combination of regional differences in aeration, perfusion, and abnormal alveolar filling or interstitial thickening. This combination is encountered more frequently in real practice because of the close interdependence of lung aeration and perfusion through complex reflex mechanisms. For example, in [Figure 14], the patient with pulmonary arterial hypertension is additionally suffering from pulmonary edema, seen as GGO and septal thickening. A similar picture may be seen when patients with airway disease additionally develop lower respiratory infections. In such settings, it is important for the interpreting physician to identify each process and provide a differential diagnosis so that correct therapeutic decisions can be made. A decision-tree algorithm that highlights key steps of the thought process is also presented [Figure 15] that can help in the differential diagnoses. While such aids are only an adjunct to experience and clinical follow-up, they can be useful in providing guidance at clinical crossroads.
Figure 13.
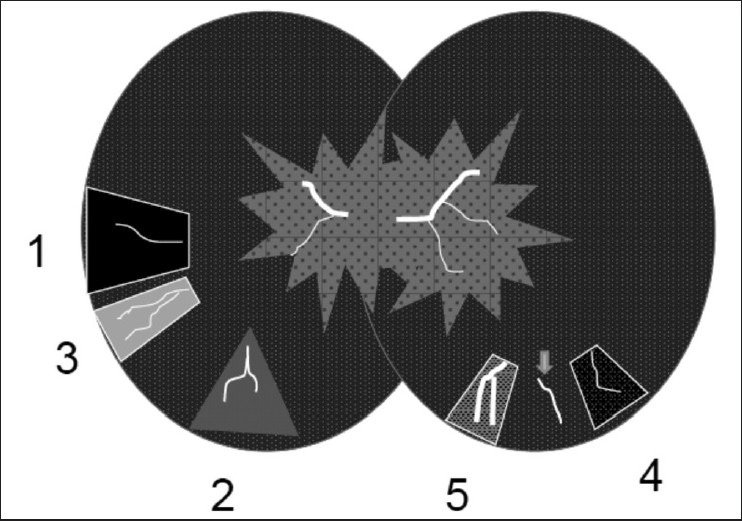
Schematic model of heterogeneous lung attenuation. Airway disease (left) can lead to (1) gas trapping and reflex vasoconstriction seen as hypoattenuating regions with fewer or thinner blood vessels. (2) Diversion of blood flow to normal lung can make it hyperattenuating. (3) Complete loss of ventilation can lead to atelectasis, crowding of blood vessels, and hyperattenuation. Vascular disease can also lead to heterogeneous lungs (right) due to (4) increased vascular resistance and hypoperfusion (e.g., pulmonary hypertension) that contrasts with normal lungs and vascularity (arrow) and (5) regions of increased perfusion
Table 2.
Features of forms of heterogeneous lung attenuation

Figure 14.
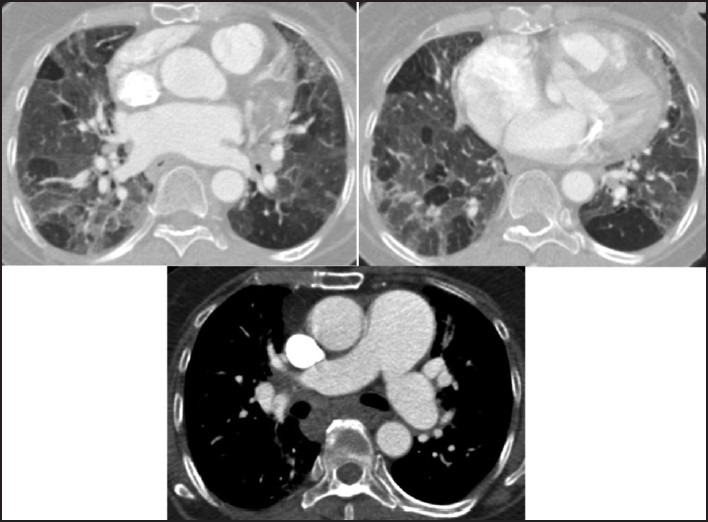
A patient with PAH is additionally suffering from pulmonary edema, seen as diffuse bilateral GGO, and septal thickening. Variable perfusion and GGO contribute to lung heterogeneity
Figure 15.
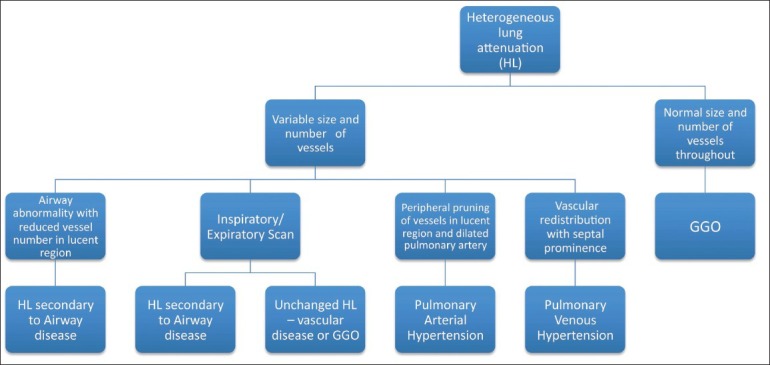
Flowchart for assessment of heterogeneous lung attenuation
In summary, heterogeneous lung attenuation, a commonly encountered finding on CT of the lungs, is not as non-specific as commonly thought and systematic analysis can illuminate the diagnostic road.
Footnotes
Source of Support: Nil
Conflict of Interest: None declared.
REFERENCES
- 1.Hansell DM. Thin-section CT of the lungs: The hinterland of normal. Radiology. 2010;256:695–711. doi: 10.1148/radiol.10092307. [DOI] [PubMed] [Google Scholar]
- 2.Hansell DM, Bankier AA, MacMohan H, McLoud TC, Muller NL, Remy J. Fleischner Society: Glossary of terms for thoracic imaging. Radiology. 2008;246:697–722. doi: 10.1148/radiol.2462070712. [DOI] [PubMed] [Google Scholar]
- 3.Ridge CA, Bankier AA, Eisenberg RL. Pattern of the month: Mosaic attenuation. Am J Roentgenol. 2011;197:W970–7. doi: 10.2214/AJR.11.7067. [DOI] [PubMed] [Google Scholar]
- 4.Padley SP, Adler BD, Hansell DM, Müller NL. Bronchiolitis obliterans: High resolution CT findings and correlation with pulmonary function tests. Clin Radiol 993. 7:236–40. doi: 10.1016/s0009-9260(05)81129-8. [DOI] [PubMed] [Google Scholar]
- 5.Gunn ML, Godwin JD, Kanne JP, Flowers ME, Chien JW. High-resolution CT findings of bronchiolitis obliterans syndrome after hematopoietic stem cell transplantation. J Thorac Imaging. 2008;23:244–50. doi: 10.1097/RTI.0b013e3181809df0. [DOI] [PMC free article] [PubMed] [Google Scholar]
- 6.Garg K, Lynch DA, Newell JD, King TE., Jr Proliferative and constrictive bronchiolitis: Classification and radiologic features. Am J Roentgenol. 1994;162:803–8. doi: 10.2214/ajr.162.4.8140994. [DOI] [PubMed] [Google Scholar]
- 7.Webb WR. High resolution lung computed tomography: Normal anatomic and pathologic findings. Radiol Clin North Am. 1991;29:1051–63. [PubMed] [Google Scholar]
- 8.Silva CI, Colby TV, Muller NL. Asthma and associated conditions: High resolution CT and pathologic findings. AJR Am J Roentgenol. 2004;183:817–24. doi: 10.2214/ajr.183.3.1830817. [DOI] [PubMed] [Google Scholar]
- 9.Webb WR, Stern EJ, Kanth N, Gamsu G. Dynamic pulmonary CT: Findings in healthy adult men. Radiology. 1993;186:117–24. doi: 10.1148/radiology.186.1.8416550. [DOI] [PubMed] [Google Scholar]
- 10.Sherrick AD, Swensen SJ, Hartman TE. Mosaic pattern of lung attenuation on CT scans: Frequency among patients with pulmonary artery hypertension of different causes. Am J Roentgenol. 1997;169:179–82. doi: 10.2214/ajr.169.1.9207504. [DOI] [PubMed] [Google Scholar]
- 11.Grosse C, Grosse A. CT findings in diseases associated with pulmonary hypertension: A current review. Radiographics. 2010;30:1753–77. doi: 10.1148/rg.307105710. [DOI] [PubMed] [Google Scholar]
- 12.Austin JH, Müller NL, Friedman PJ, Hansell DM, Naidich DP, Remy-Jardin M, et al. Glossary of terms for CT of the lungs: Recommendations of the Nomenclature Committee of the Fleischner Society. Radiology. 1996;200:327–31. doi: 10.1148/radiology.200.2.8685321. [DOI] [PubMed] [Google Scholar]
- 13.Bhalla M, Abboud MR, McLoud TC, Shepard JA, Munden MM, Jackson SM, et al. Acute chest syndrome in sickle cell disease: CT evidence of microvascular occlusion. Radiology. 1993;187:45–9. doi: 10.1148/radiology.187.1.8451435. [DOI] [PubMed] [Google Scholar]
- 14.Storto ML, Kee ST, Golden JA, Webb WR. Hydrostatic pulmonary edema: High resolution CT findings. Am J Roentgenol. 1995;165:817–20. doi: 10.2214/ajr.165.4.7676973. [DOI] [PubMed] [Google Scholar]
- 15.Muller NL, Staples CA, Miller RR, Vedal S, Thurlbeck WM, Ostrow DN. Disease activity in idiopathic pulmonary fibrosis: CT and pathologic correlation. Radiology. 1987;165:731–4. doi: 10.1148/radiology.165.3.3685351. [DOI] [PubMed] [Google Scholar]
- 16.Akira M, Atagi S, Kawahara M, Luchi K, Johkoh T. High-Resolution CT findings of diffuse bronchioloalveolar carcinoma in 38 patients. Am J Roentgenol. 1999;173:1623–9. doi: 10.2214/ajr.173.6.10584811. [DOI] [PubMed] [Google Scholar]
- 17.Kerns SR, Gay SB. CT of blunt chest trauma. Am J Roentgenol. 1990;154:55–60. doi: 10.2214/ajr.154.1.2104726. [DOI] [PubMed] [Google Scholar]


