Abstract
In many mammalian species, the removal of one lung [pneumonectomy (PNX)] is associated with the compensatory growth of the remaining lung. To investigate the hypothesis that parenchymal deformation may trigger lung regeneration, we used respiratory-gated micro-computed tomography scanning to create three-dimensional finite-element geometric models of the murine cardiac lobe with cyclic breathing. Models were constructed of respiratory-gated micro-computed tomography scans pre-PNX and 24 h post-PNX. The computational models demonstrated that the maximum stretch ratio map was patchy and heterogeneous, particularly in subpleural, juxta-diaphragmatic, and cephalad regions of the lobe. In these parenchymal regions, the material line segments at peak inspiration were frequently two- to fourfold greater after PNX; some regions of the post-PNX cardiac lobe demonstrated parenchymal compression at peak inspiration. Similarly, analyses of parenchymal maximum shear strain demonstrated heterogeneous regions of mechanical stress with focal regions demonstrating a threefold increase in shear strain after PNX. Consistent with previously identified growth patterns, these subpleural regions of enhanced stretch and shear strain are compatible with a mechanical signal, likely involving cyclic parenchymal stretch, triggering lung growth.
Keywords: finite element, lung, image registration, regeneration, pneumonectomy
the shape of the lung, reflecting the elastic properties of alveolar septae and transpleural pressures, is relevant to both normal respiratory function and lung regeneration. During normal tidal breathing, the lung demonstrates relative shape stability and geometric similarity (19); that is, the shape of the lung remains relatively constant, despite a change in lung volume. Computational modeling during normal breathing has largely focused on the mapping of lung motion relevant to the targeting of radiation therapy for lung tumors (1, 22).
In contrast, there is a fundamental change in the shape of the lung, independent of tidal ventilation, after the surgical removal of lung tissue. In rodents, micro-computed tomography (CT) imaging after the removal of the left lung [pneumonectomy (PNX)] has suggested a significant change in the shape of the remaining right lung (8) and heterogeneity in parenchymal deformation when assessed at static midthoracic (20 cmH2O) lung volumes (4). Analyses of the remaining lung, and the cardiac lobe in particular, have demonstrated significant increases in volume, weight, and cell number (3, 15, 16). Based on midthoracic lung volumes, regions of cell proliferation and angiogenesis correlated with areas of maximal deformation. These data, together with others (23, 24), suggest the importance of parenchymal stretch as a high-level regulator of lung growth; however, the deformational changes with tidal ventilation in the remaining lung after PNX are not known.
In this report, we used respiratory-gated micro-CT scanning to create finite-element models of the murine cardiac lobe during post-PNX tidal ventilation. We characterized the deformation of the post-PNX lung with an iterative nonrigid spatial transformation. Our finite-element models were used to map cyclic lobar deformation and predict regions of regenerative growth within the murine cardiac lobe.
METHODS
Mice.
C57/B6 mice (Jackson Laboratory, Bar Harbor, ME), 30–35 g (N = 40), were used in all experiments. The care of the animals was consistent with guidelines of the American Association for Accreditation of Laboratory Animal Care (Bethesda, MD) with the protocol reviewed and approved by the Harvard Medical School Institutional Animal Care and Use Committee.
Orotracheal intubation and ventilation.
Orotracheal intubation was performed with the animal suspended by the incisors and the tongue gently retracted anteriorly. A 20-G angiocatheter (BD Insyte, Sandy, UT) was passed between the vocal cords under direct illumination. Anesthesia for orotracheal intubation was a mixture of 100 mg/kg ketamine (Fort Dodge Animal Health) and 0.6 mg/kg xylazine (Phoenix Scientific, St. Joseph, MO) administered intraperitoneally. For subsequent CT imaging, pressure-controlled ventilation was used with 0.5% isofluorane and a rate of 50 beats/min. Oxygen saturation monitoring and ambient temperature monitoring were performed as previously described (8, 9).
PNX.
Mice were intubated with a 20-G angiocatheter (BD Insyte, Sandy, UT) and ventilated with a Flexivent rodent ventilator (SciReq, Montreal, QC, Canada) using standard settings of 200 beats/min, 10 ml/kg, a pressure limit of 30 cmH2O, and a positive end-expiratory pressure of 3 cmH2O (9). A left thoracotomy was performed through the fifth intercostal space, the hilum ligated with a 6–0 silk tie (Ethicon, Somerville, NJ), and the lung sharply excised distal to the ligature. A recruitment maneuver was performed to recruit the contralateral lung and medialize the mediastinum as the thoracotomy was closed. The mouse was extubated and transferred to a warmed cage until it recovered from the anesthesia. Postoperative pulmonary function studies have demonstrated variability, but no significant difference between PNX and control mice within 24 h of surgery (25).
CT scanning.
Before all imaging sessions, the CT scanner (eXplore CT 120 micro-CT, GE Healthcare, Waukesha, WI) was set to a potential of 40 kV and a current of 140 μA. Cranial and caudal end points were defined, and the animal imaged at resolutions from 50 to 120 μm/slice. Respiratory gating was obtained prospectively. Respiratory gating was achieved by incorporating the “respiratory pillow” transducer into the ventilator circuit. Complete thoracic images were obtained within 15 min; typical image stacks were 525 images. For mice, the reconstructed images were assumed to be isotropic; the voxel size of the CT images were isotropic in the X-, Y- and Z-axes. After reconstruction, the scans were evaluated for 1) technical adequacy, 2) cardiac lobe displacement, and 3) cardiac lobe deformation. Based on these criteria, a modal scan was selected for finite-element modeling. The serial DICOM (digital imaging and communication in medicine) images of the representative animal from each group were exported for use in custom finite-element software previously described (5, 12).
Morphometric measurements.
The micro-CT images were archived as DICOM files and imported into MetaMorph 7.7 (Molecular Devices, Downingtown, PA) software, as previously described (8). After routine distance calibration, the micro-CT image stacks were analyzed using the MetaMorph integrated morphometry application. The apical-basilar distance was measured in coronal and parasagittal projections using an orthogonal transept line drawn from the apex of each hemithorax. The axial transverse projections were measured in the lateral and anteroposterior dimensions at the T8-T9 vertebral body (8).
Geometric model.
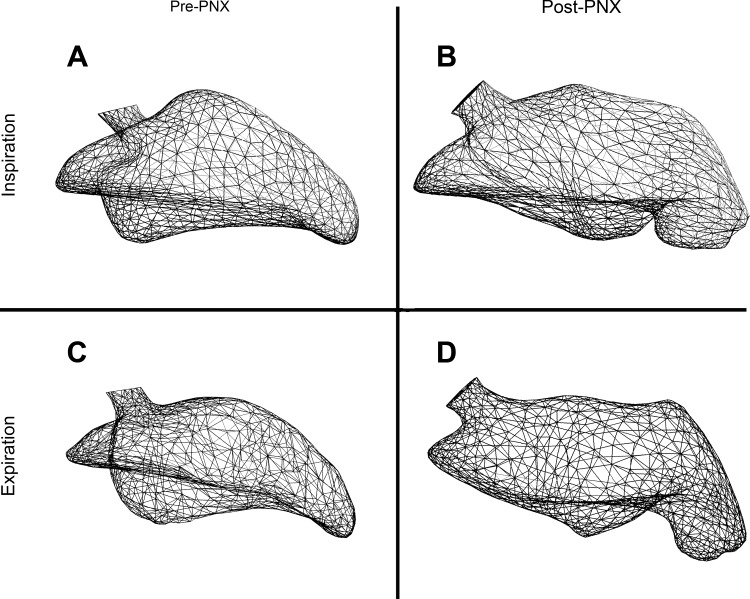
We used a detailed image algorithm based on the three-dimensional (3D) image reconstruction of the cardiac lobe both pre- and post-PNX (4). The 3D image model was created by combining the 525 sequential two-dimensional (2D) segmented images (each 564 × 444 pixels) into one matrix image file (see Fig. 4). Using the matrix file, the boundary surface of the 3D mesh was constructed based on the marching cubes algorithm (5). The surface was idealized using a standard Laplacian smoothing algorithm and surface cleaning. Using a connectivity analysis previously described (21), the cardiac lobe was isolated from the rest of the lung (Fig. 5). The resulting geometric models, typically about 84,564 3D eight-node finite elements using unstructured discretization, provided a faithful reproduction of the cardiac lobe observed in vivo. The central axis of the cardiac lobe airway, branching from the right mainstem bronchus, was used as a reference point for translation and a reference axis for rotation calculations. The registration of pre- and post-PNX lung images was approached using a nonrigid spatial transformation with iterative steps, as previously described (4).
Fig. 4.
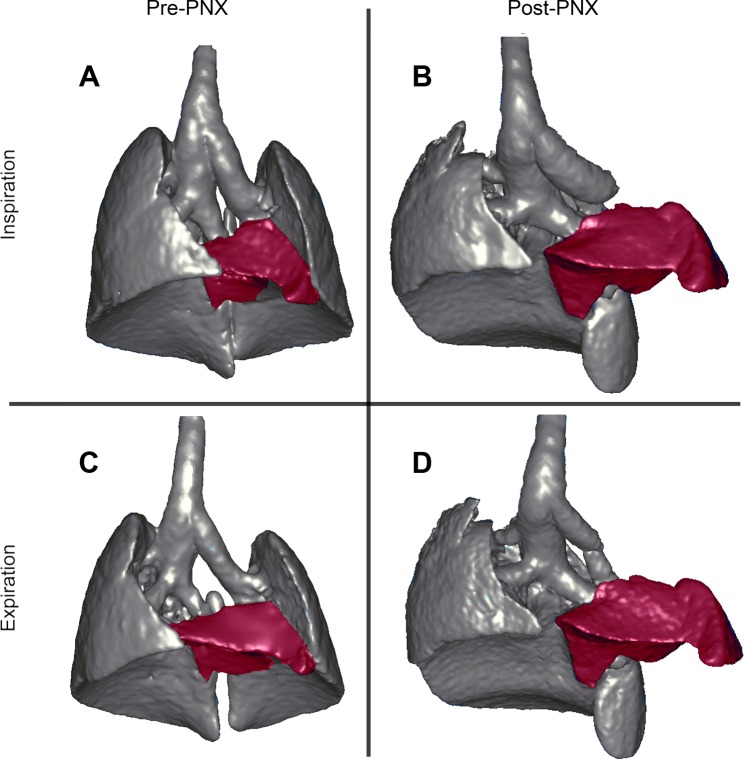
Three-dimensional (3D) reconstructions of the lungs and airways during inspiration (A and B) and expiration (C and D) based on respiratory-gated micro-CT imaging with an eXplore CT 120 micro-CT scanner. The preoperative lungs (A and C) were compared with the remaining lung 24 h after left pneumonectomy (PNX) (B and D). The cardiac lobe was selectively pseudocolored red. Note the significant displacement and increase in size of the cardiac lobe post-PNX.
Fig. 5.
Geometric models of the cardiac lobe in a preoperative mouse (A and C) and a mouse 24 h after left PNX (B and D). The models demonstrate the shape and volume of the cardiac lobe at peak inspiration (A and B) and peak expiration (C and D).
Numerical procedure.
To examine the effects of PNX on the tissues during tidal ventilation, we considered the lung at the peak expiration (minimum volume) as the un-deformed configuration and at the peak inspiration (maximum volume) as the most deformed configuration. Specifically, the effects of tidal ventilation on the configuration of the cardiac lobe was compared between pre- and post-PNX mice; n = 20 mice in each group. After CT reconstruction, a modal image was selected. The finite-element models were based on a single case to ensure internal consistency. The following numerical procedure (also see Fig. 1) was performed using an Intel Core 2 Duo CPU E8500 at 3.16 GHz; CPU time was ∼4 h for each run.
Fig. 1.
Flowchart of numerical procedure.
Step 1: Using image registration analysis previously described (4), achieve a 1:1 material point correspondence between the configurations at peak expiration and peak inspiration based on ∼40 landmarks (4).
Step 2: Based on the results of step 1, discretize the peak expiration and peak inspiration surface configurations.
Step 3: Determine total displacement1 field of the surface from the two surface finite-element meshes.
Step 4: Fill the interior, bound by the surface configuration, with elastic material (see Young's modulus and Poisson's ratio below) and discretize the interior.
Step 5: Setting a large number (N) of steps, determine the intermediate surface configuration by linearly interpolating displacement vector between the initial (i = 0) and final positions (i = N) for surface nodes.
Step 6: Check whether N is large enough to achieving equilibrium convergence. If “not”, increase N and repeat step 5. If “yes”, go to the next step.
Step 7: Iterate i = 0 (peak expiration) to i = N (peak inspiration), with N steps to obtain the intermediate configuration. Perform “principal stretch analysis” and “shear strain analysis” and record the results at every intermediate configuration (see Fig. 6).
Fig. 6.
Principal stretch and maximum shear strain (γmax) analysis. At each material point (x1, x2, x3), the strain tensor eij (i,j = 1, 2, 3), was calculated. A: by solving the eigenvalue problem, the principal stretch directions (x1p, x2p, x3p) and magnitude, λi = dLi/dL0i, i = 1, 2, 3, were determined; here dL0i and dLi are the initial and current lengths, respectively, of material line segments (λ1 > λ2 > λ3 were assumed). B: the γmax was obtained based on the Mohr's circle analysis (7, 12). Mohr's circle for strain was plotted normal vs. shear strains, and the principal values of the Green-Lagrange strains were obtained as Ei = 1/2(λi2 − 1), i = 1, 2, 3. Note that the shear strains were equal to zero in the principal direction (i.e., on the Normal strain axis of the Mohr's circle). The γmax (equal to double tensorial shear strain) was obtained graphically as γmax = E1 − E3.
Step 8: At i = N (at the peak inspiration), the protocol is completed.
Young's modulus and Poisson's ratio.
Based on the available data, the material properties of the lung tissue were treated as an elastic material described by Young's modulus (E) and Poisson's ratio (ν). E, characterizing the stiffness of an elastic material, was assumed to be ∼25 kPa (6); our laboratory has used this value previously (13, 14, 17, 18). To validate the use of this value for our study, we ensured that our results were consistent over a 100-fold variation in E.
The ν of our lung tissue sample was determined by linear interpolation of the lung volume. First, at each iteration, we calculated mean stress (σ̄k) for each material point (k)
Then we defined the σ̄ for the whole cardiac lobe at each iteration by summing all σ̄k and dividing by the number of material points (n)
Based on linear interpolation of the lung volume, the ν during that intermediate iteration was determined as,
where Vinitial and Vinterm denote the initial and the intermediate volume of the lobe, respectively. An incremental displacement was performed until the cardiac lobe volume became the final lobe volume.
In our calculation, the initial value of ν (0.3) converged to a value of 0.25 at the final value lobe volume.
Principal stretch analysis.
At each material point (material is considered isotropic), the strain2 tensor εij, i,j = 1, 2, 3, was calculated, and the principal values and the principal vectors were obtained by solving the following eigenvalue problem,
where Ei denoted the principal strain, and xip (i = 1, 2, 3) were the principal axes (see Fig. 6). The Green-Lagrange strains (7) were used in our analysis, and the principal stretches were calculated as λi = (i = 1, 2, 3).
Maximum shear analysis.
Using the Mohr's circle analysis for strain, the value of the maximum shear strain (γmax) was obtained as,
Note here, we assume λ1 > λ2 > λ3 without loss of generality.
RESULTS
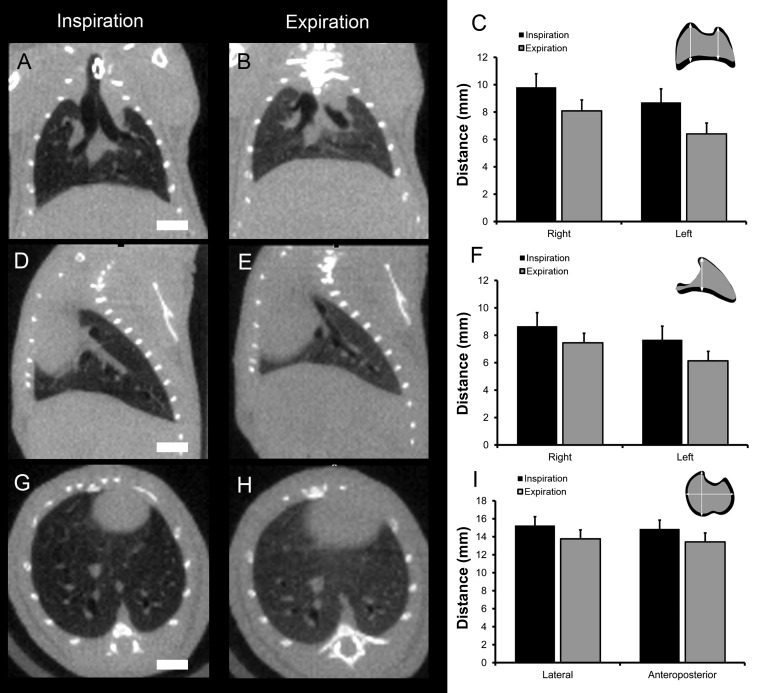
Both pre- and post-PNX mice were imaged by respiratory-gated micro-CT (Fig. 2). In pre-PNX mice, tidal ventilation was associated with both diaphragmatic and chest wall excursion (Fig. 3).
Fig. 2.
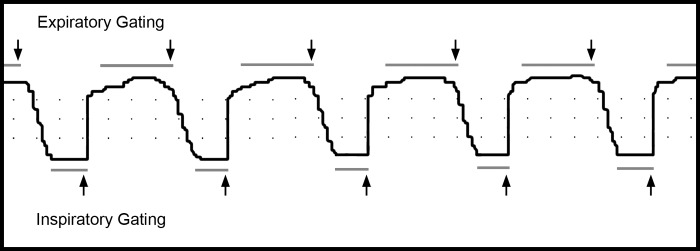
Representative tracing of phased-based respiratory gating obtained with an eXplore CT 120 micro-computed tomography (CT) scanner. The mice were ventilated with a FlexiVent (SciReq) rodent ventilator at 50 breaths/min and a 1:2 inspiratory-to-expiratory ratio. The micro-CT images were obtained at end expiration and end inspiration (arrows). Dots in the SAM-PC software (Small Animal Instruments, Stony Brook, NY) reflected 200-ms intervals in the horizontal axis.
Fig. 3.
Anatomic changes associated with tidal ventilation in the preoperative adult mice were obtained with coronal (A–C), parasagital (D–F), and axial transverse (G–I) projections. The scans were obtained with an eXplore CT 120 micro-CT scanner. The mice were ventilated with a FlexiVent (SciReq) rodent ventilator at 50 breaths/min and a 1:2 inspiratory-to-expiratory ratio. The DICOM files were exported and analyzed using Metamorph 7.7 (MDS) software. The anatomic changes with tidal ventilation in 3 age-matched (30–35 g) mice, scanned with identical resolution, were compared by morphometry. The apical-basilar distance was analyzed in coronal (C) and parasagittal (F) projections; the axial transverse projections (I) were compared in the lateral and anteroposterior dimensions. Error bars = 1 SD; bar = 4 mm.
In post-PNX mice, there was a significant shift of the cardiac lobe into the left hemithorax (Fig. 4).
The micro-CT scans were used to construct 3D geometric finite-element models of the pre-PNX and post-PNX cardiac lobe at peak inspiration and peak expiration (Fig. 5). The changes in the shape of the cardiac lobe (i.e., deformation3) were mathematically expressed as second-order strain tensors (εij, i,j = 1, 2, 3) at each of 88,548 material points; the strain tensor was decomposed into normal (diagonal part) and shear (off-diagonal part) components. By solving the eigenvalue problem (see methods), we diagonalized the strain tensor and expressed it as principal strains, Ei (i = 1, 2, 3), along the direction of three orthogonal principal axes, xip (i = 1, 2, 3), where shear strain is zero, as well as the γmax (Fig. 6).
To determine the effect of PNX on the principal stretch4, λi = () (i = 1, 2, 3), the maximum stretch ratio (λmax) was mapped at peak inspiration (Fig. 7). In both pre-PNX and post-PNX models, the λmax map was patchy and heterogeneous, particularly in subpleural, juxta-diaphragmatic, and cephalad regions of the lobe (Figs. 7 and 8). In these parenchymal regions, the material line segments at peak inspiration were frequently more than twofold the length of the same line segments at peak expiration (Fig. 8). Importantly, the post-PNX map was distinct from the pre-PNX map in both the distribution and relative magnitude of stretch. In some focal regions, the stretch of the post-PNX cardiac lobe was more than fourfold greater at peak inspiration than at peak expiration (λmax = 4, shown in red). Notably, regions of the post-PNX cardiac lobe, particularly in the central regions of the lobe, showed little stretch during tidal ventilation. In some central areas, the λmax was less than 1 (λmax < 1; light blue and gray), indicating that the post-PNX lung parenchyma was compressed at peak inspiration (Figs. 7 and 8).
Fig. 7.
Maximum principal stretch map of the cardiac lobe. Axial transverse and coronal sections of the cardiac lobe, analogous to histological sections, were defined for distinct planes in the pre-PNX (A) and post-PNX (B) cardiac lobe. The relative stretch index (RSI) was defined as the ratio between the inspiratory and expiratory length of each material line segment in the finite-element model (see methods). After PNX, regions of high stretch were observed in the paramediastinal (>), juxta-diaphragmatic (□), and cephalad (<) subpleural regions of the cardiac lobe.
Fig. 8.
Principal stretch of the pre-PNX and post-PNX cardiac lobe at the peak inspiration relative to the peak expiration. Transept regions of interest were drawn across the lobar section in five lines (A1–B1 to A5–B5). The relative stretch, plotted as a function of distance, is shown for the pre-PNX (gray) and post-PNX (black) models. Stretch in the subpleural regions was consistently greater than in the center of the cardiac lobe.
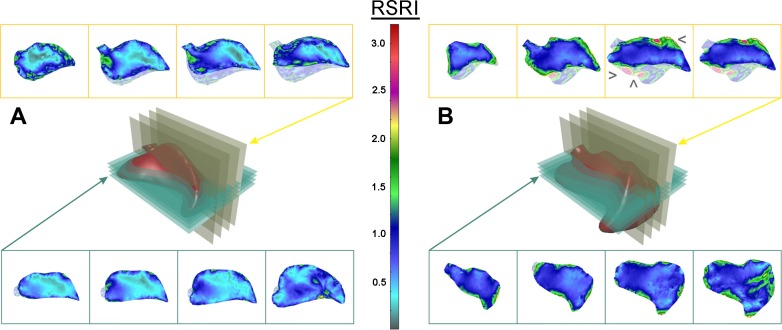
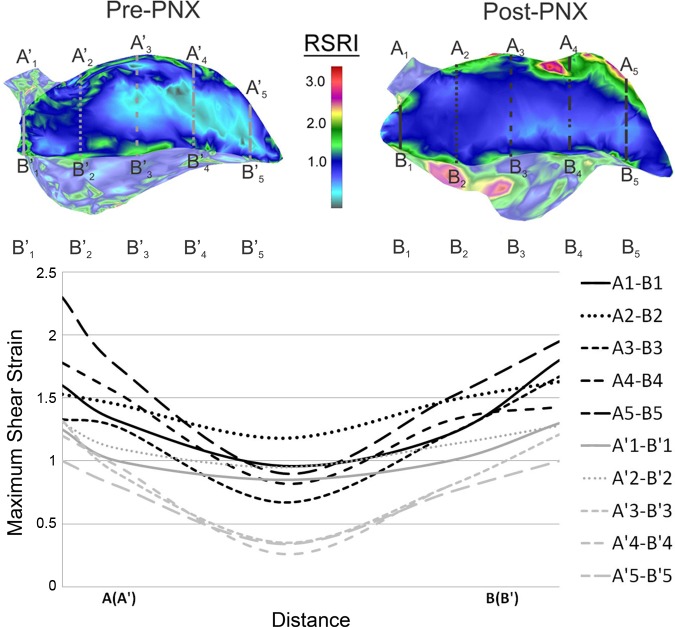
To determine the effect of PNX on the γmax = E1 − E3 (where we assume λ1 > λ2 > λ3), the shear strain of the cardiac lobe was mapped pre- and post-PNX. Compared with the preoperative map, cyclic ventilation after PNX resulted in marked heterogeneous deformation of the cardiac lobe (Fig. 9). Prominent regions reflecting mechanical stress5 were again localized to the juxta-diaphragmatic and cephalad regions of the lobe. Similar to the results of the principal stretch analysis, the difference between subpleural and central regions of the cardiac lobe was more pronounced after PNX (Fig. 10). In some parenchymal regions of the post-PNX cardiac lobe, cyclic ventilation was associated with a threefold increase in shear strain.
Fig. 9.
γmax map of the cardiac lobe. Axial transverse and coronal sections of the cardiac lobe, analogous to histological sections, were defined for distinct planes in the pre- (A) and post-PNX (B) cardiac lobe. The relative shear strain index (RSRI) is defined as E1–E3 (see methods). After PNX, regions of high strain were observed in the paramediastinal (>), juxta-diaphragmatic (□), and cephalad (<) subpleural regions of the cardiac lobe.
Fig. 10.
γmax of the pre-PNX and post-PNX cardiac lobe at the peak inspiration relative to the peak expiration. Transept regions of interest were drawn across the lobar section in five lines (A1-B1 to A5-B5). The γmax, plotted as a function of distance, is shown for the pre-PNX (gray) and post-PNX (black) models. Shear strain in the subpleural regions was consistently greater than in the center of the cardiac lobe.
DISCUSSION
In this report, we used respiratory-gated micro-CT imaging to develop finite-element models of the pre- and post-PNX murine lung. In particular, geometric models of the cardiac lobe were used to demonstrate deformation with tidal ventilation. 2D “maps” of the cardiac lobe deformation were strikingly similar to regions of growth previously demonstrated by cell cycle histology and corrosion cast scanning electron microscopy (15); specifically, both deformation and growth occurred in discontinuous or “patchy” subpleural regions of the cardiac lobe. The spatial coincidence of parenchymal deformation and lung growth in the cardiac lobe suggests that cyclic stretch is a regulatory signal in lung regeneration.
Here, the principal finding was the significant heterogeneity in stretch and shear strain associated with cyclic ventilation of the cardiac lobe after PNX. Previous postoperative micro-CT scanning demonstrated marked displacement and shape change within 24 h of PNX (8); that is, the cardiac lobe was displaced into the empty left hemithorax. The larger pleural cavity allowed for greater volumetric expansion. In addition, the cardiac lobe was uniquely juxtaposed to both diaphragms, a finding qualitatively consistent with previous work (10, 24). With continued diaphragmatic function bilaterally, the cardiac lobe was exposed to an altered mechanical milieu. This mechanical microenvironment may account for the increased growth observed in the cardiac lobe (15). We anticipate that a biological test of our computational predictions could be obtained by spatial sampling techniques such as laser capture microdissection. We are currently using laser capture microdissection to evaluate the angiogenesis-related transcriptional activity in the subpleural cardiac lobe.
We recognize that micro-CT images alone were insufficient to perform viscoelastic dynamic analyses of lung mechanics. Nonetheless, micro-CT images, obtained at two specifically designed time points (pre- and post-PNX), were sufficient to achieve our main goal; namely, to qualitatively estimate the effects of PNX on the changes in lung configuration during tidal ventilation. Furthermore, our analysis of the lung configuration allowed the comparison of pre- and post-PNX mice, providing a predictive map of stretch-related lung growth.
Importantly, our maps of cyclic stretch and shear strain were based on three assumptions. First, we assumed that the surface configuration of the lung at an “intermediate” stage between expiration and inspiration could be linearly interpolated from the lung surface configurations obtained at peak expiration and inspiration. This assumption is likely to be valid because of the relative geometric similarity of the lung at peak expiration and peak inspiration. Second, we assumed that the lung at peak expiration was the nonstressed condition. The deformation of a nonstressed condition permitted the relative comparison between inspiration and expiration of pre- and post-PNX lungs. Finally, we assumed that the lung could be treated as a homogeneous elastic material with E of 25 kPa (6) and ν of 0.25, ignoring the potential nonlinearities of the lung microstructure. Our laboratory has successfully used Fukaya's value previously as a first estimate of the lung's material properties (11, 14, 17, 18). The ν of our lung tissue sample was calculated based on the experimental data obtained by CT imaging.
Cyclic stretch provides an additional mechanical dimension to the structural realignment and regeneration of the lung after PNX. In previous work, our laboratory has demonstrated that the post-PNX cardiac lobe is stretched and deformed as it is displaced into the left hemithorax (4, 8). Superimposed on this underlying parenchymal distortion is the cyclic stretch associated with tidal ventilation. We suspect that the cumulative effect of cyclic stretch and strain in this setting is a proscription for tissue injury, analogous to the notion of material “fatigue” in solid mechanics. The absence of histological evidence of injury in the post-PNX lung (2) likely reflects the active repair and regeneration in these regions of the lung. This predicted response suggests that 1) stretch and strain is a participant in, if not controlling signal for, lung repair; and 2) the regions of stretch and strain defined in this work provide predictive maps of lung growth. Furthermore, we speculate that the cumulative effect of cyclic stretch superimposed on distorted parenchyma likely participates in the lung injury associated with mechanical ventilation (20).
In summary, we used micro-CT imaging and finite-element modeling of the remaining lung after left PNX to demonstrate significant change in the shape, stretch, and shear strain of the cardiac lobe. Stretch and shear strain of the cardiac lobe was heterogeneous, but concentrated in the subpleural regions of the lobe. Based on the spatial distribution of stretch and shear strain in post-PNX mice, we speculate that parenchymal deformation is a controlling element in regenerative lung growth.
GRANTS
This study was supported in part by National Heart, Lung, and Blood Institute Grants HL-94567, HL-75426, and HL-07734.
DISCLOSURES
No conflicts of interest, financial or otherwise, are declared by the author(s).
AUTHOR CONTRIBUTIONS
Author contributions: N.F., B.C.G., M.K., D.N., V.I., and A.B.Y. performed experiments; M.K., S.J.M., and A.T. analyzed data; M.A.K. and A.T. approved final version of manuscript; S.J.M. and A.T. conception and design of research; A.T. interpreted results of experiments; A.T. prepared figures; A.T. drafted manuscript; A.T. edited and revised manuscript.
ACKNOWLEDGMENTS
The authors thank Drs. Karen Inouye, Gokhan Hotamisligil, and Mi-Ae Park for invaluable assistance in micro-CT imaging.
Footnotes
Displacements represent change of position in space of each material point.
Strains (normal and shear) are generally used to describe material deformation. Normal strain is given as the ratio of the increment of an elementary material line segment (of infinitesimal length) with respect to its original length. Taken for all directions, normal strains provide a measure of material elongation or compression. In contrast, shear strain is a measure of material distortion, i.e., relative rotation of elementary material segments at a material point. Since number of line segments at a point is infinitely large (for the entire 360°), a coordinate system is used, and strains refer to the segments along the coordinate directions. Strain is mathematically expressed by six values, among which three are normal and three are shear components; these components form a quantity called strain tensor. With these components, calculated by using deformation gradients, it is possible to determine normal strain for any direction and shear strain within any plane in space, at a considered material point.
Deformation is due to relative displacements. To quantify material deformation, strains and stretches are used as the mechanical measures of deformation. Strain and stretch depend on the gradient of displacements, mathematically expressed by derivatives of displacements with respect to the coordinates of the material points.
Stretch represents the ratio of length of a material line segment in the deformed state, with respect to initial length in the un-deformed state. Stretch can be used as a measure of deformation, particularly by calculating the principal values. The principal stretches occur in directions that define principal planes where shear is equal to zero.
Stresses represent the measure of internal material forces. The relationship between stresses and strains is specified as a constitutive law. The simplest is an elastic constitutive law in which the relationships between stress and strain components are linear.
REFERENCES
- 1.Al-Mayah A, Moseley J, Brock KK. Contact surface and material nonlinearity modeling of human lungs. Phys Med Biol 53: 305–317, 2008 [DOI] [PubMed] [Google Scholar]
- 2.Chamoto K, Gibney BC, Lee GS, Ackermann M, Konerding MA, Tsuda A, Mentzer SJ. Migration of CD11b+ accessory cells during murine lung regeneration. Stem Cell Res 10: 267–277, 2013 [DOI] [PMC free article] [PubMed] [Google Scholar]
- 3.Chamoto K, Gibney BC, Lee GS, Lin M, Simpson DC, Voswinckel R, Konerding MA, Tsuda A, Mentzer SJ. CD34+ progenitor to endothelial cell transition in post-pneumonectomy angiogenesis. Am J Respir Cell Mol Biol 46: 283–289, 2012 [DOI] [PMC free article] [PubMed] [Google Scholar]
- 4.Filipovic N, Gibney BC, Nikolic D, Konerding MA, Mentzer SJ, Tsuda A. Computational analysis of lung deformation after murine pneumonectomy. Comput Methods Biomech Biomed Engin. September 17, 2012 [DOI] [PMC free article] [PubMed] [Google Scholar]
- 5.Filipovic N, Milasinovic D, Zdravkovic N, Boeckler D, von Tengg-Kobligk H. Impact of aortic repair based on flow field computer simulation within the thoracic aorta. Comput Methods Programs Biomed 101: 243–252, 2011 [DOI] [PubMed] [Google Scholar]
- 6.Fukaya H, Martin CJ, Young AC, Katsura S. Mechanical properties of alveolar walls. J Appl Physiol 25: 689–695, 1968 [DOI] [PubMed] [Google Scholar]
- 7.Fung YC. Biomechanics: Mechanical Properties of Living Tissues. New York: Springer-Verlag, 1993 [Google Scholar]
- 8.Gibney B, Houdek J, Lee GS, Ackermann M, Lin M, Simpson DC, Chamoto K, Konerding MA, Tsuda A, Mentzer SJ. Mechanostructural adaptations preceding post-pneumonectomy lung growth. Exp Lung Res 38: 396–405, 2012 [DOI] [PMC free article] [PubMed] [Google Scholar]
- 9.Gibney B, Lee GS, Houdek J, Lin M, Chamoto K, Konerding MA, Tsuda A, Mentzer SJ. Dynamic determination of oxygenation and lung compliance in murine pneumonectomy. Exp Lung Res 37: 301–309, 2011 [DOI] [PMC free article] [PubMed] [Google Scholar]
- 10.Hsia CCW, Tawhai MH. What can imaging tell us about physiology? Lung growth and regional mechanical strain. J Appl Physiol 113: 937–946, 2012 [DOI] [PMC free article] [PubMed] [Google Scholar]
- 11.Kojic M, Butler JP, Vlastelica I, Stojanovic B, Rankovic V, Tsuda A. Geometric hysteresis of alveolated ductal architecture. J Biomech Eng 133: 1–11, 2011 [DOI] [PMC free article] [PubMed] [Google Scholar]
- 12.Kojic M, Filipovic N, Stojanovic B, Kojic N. Computer Modeling in Bioengineering: Theoretical Background, Examples and Software. Chichester, UK: Wiley, 2008 [Google Scholar]
- 13.Kojic M, Vlastelica I, Decuzzi P, Granik VT, Ferrari M. A finite element formulation for the doublet mechanics modeling of microstructural materials. Comp Methods Appl Mech Eng 200: 1446–1454, 2011 [Google Scholar]
- 14.Kojic M, Vlastelica I, Stojanovic B, Rankovic V, Tsuda A. Stress integration procedures for a biaxial isotropic material model of biological membranes and for hysteretic models of muscle fibres and surfactant. Int J Numer Methods Eng 68: 893–909, 2006 [Google Scholar]
- 15.Konerding MA, Gibney BC, Houdek J, Chamoto K, Ackermann M, Lee G, Lin M, Tsuda A, Mentzer SJ. Spatial dependence of alveolar angiogenesis in post-pneumonectomy lung growth. Angiogenesis 15: 23–32, 2012 [DOI] [PMC free article] [PubMed] [Google Scholar]
- 16.Lin M, Chamoto K, Gibney B, Lee GS, Collings-Simpson D, Houdek J, Konerding MA, Tsuda A, Mentzer SJ. Angiogenesis gene expression in murine endothelial cells during post-pneumonectomy lung growth. Respir Res 12: 98, 2011 [DOI] [PMC free article] [PubMed] [Google Scholar]
- 17.Mijailovich SM, Hamada K, Tsuda A. IL-8 response of cyclically stretching alveolar epithelial cells exposed to non-fibrous particles. Ann Biomed Eng 35: 582–594, 2007 [DOI] [PubMed] [Google Scholar]
- 18.Mijailovich SM, Kojic M, Tsuda A. Particle-induced indentation of the alveolar epithelium caused by surface tension forces. J Appl Physiol 109: 1179–1194, 2010 [DOI] [PMC free article] [PubMed] [Google Scholar]
- 19.Miki H, Butler JP, Rogers RA, Lehr JL. Geometric hysteresis in pulmonary surface-to-volume ratio during tidal breathing. J Appl Physiol 75: 1630–1636, 1993 [DOI] [PubMed] [Google Scholar]
- 20.Thammanomai A, Majumdar A, Bartolak-Suki E, Suki B. Effects of reduced tidal volume ventilation on pulmonary function in mice before and after acute lung injury. J Appl Physiol 103: 1551–1559, 2007 [DOI] [PubMed] [Google Scholar]
- 21.Tsuda A, Filipovic N, Haberthur D, Dickie R, Matsui Y, Stampanoni M, Schittny JC. Finite element 3D reconstruction of the pulmonary acinus imaged by synchrotron X-ray tomography. J Appl Physiol 105: 964–976, 2008 [DOI] [PMC free article] [PubMed] [Google Scholar]
- 22.Werner R, Ehrhardt J, Schmidt R, Handels H. Patient-specific finite element modeling of respiratory lung motion using 4D CT image data. Med Phys 36: 1500–1511, 2009 [DOI] [PubMed] [Google Scholar]
- 23.Yilmaz C, Ravikumar P, Dane DM, Bellotto DJ, Johnson RL, Hsia CCW. Noninvasive quantification of heterogeneous lung growth following extensive lung resection by high-resolution computed tomography. J Appl Physiol 107: 1569–1578, 2009 [DOI] [PMC free article] [PubMed] [Google Scholar]
- 24.Yilmaz C, Tustison NJ, Dane DM, Ravikumar P, Takahashi M, Gee JC, Hsia CCW. Progressive adaptation in regional parenchyma mechanics following extensive lung resection assessed by functional computed tomography. J Appl Physiol 111: 1150–1158, 2011 [DOI] [PMC free article] [PubMed] [Google Scholar]
- 25.Ysasi AB, Belle JM, Gibney BC, Fedulov AV, Wagner W, Tsuda A, Konerding MA, Mentzer SJ. Effect of unilateral diaphragmatic paralysis on post-pneumonectomy lung growth. Am J Physiol Lung Cell Mol Physiol 305: L439–L445, 2013 [DOI] [PMC free article] [PubMed] [Google Scholar]


