Abstract
We often look at and sometimes reach for visible targets. Looking at a target is fast and relatively easy. By comparison, reaching for an object is slower and is associated with a larger cost. We hypothesized that, as a result of these differences, abrupt visual onsets may drive the circuits involved in saccade planning more directly and with less intermediate regulation than the circuits involved in reach planning. To test this hypothesis, we recorded discharge activity of neurons in the parietal oculomotor system (area LIP) and in the parietal somatomotor system (area PRR) while monkeys performed a visually guided movement task and a choice task. We found that in the visually guided movement task LIP neurons show a prominent transient response to target onset. PRR neurons also show a transient response, although this response is reduced in amplitude, is delayed, and has a slower rise time compared with LIP. A more striking difference is observed in the choice task. The transient response of PRR neurons is almost completely abolished and replaced with a slow buildup of activity, while the LIP response is merely delayed and reduced in amplitude. Our findings suggest that the oculomotor system is more closely and obligatorily coupled to the visual system, whereas the somatomotor system operates in a more discriminating manner.
Keywords: LIP, decision, parietal reach region, reward, transient
behavior is often guided or influenced by objects appearing on the visual scene. The appearance or movement of an object often elicits a rapid eye movement, or saccade, to that object. The benefit of this behavior is to bring the object onto the fovea to acquire more detailed visual information about it. Saccades can be deployed quickly and therefore are relatively inexpensive. In comparison, the appearance or movement of an object rarely elicits an immediate reach, although a subject may choose to reach after a delay. Reaching is slower and requires a greater commitment of resources and more involved planning, including the trajectory to follow and what the hand will do when it arrives. In general, we are much more likely to immediately look at a new visual target than we are to immediately reach for it.
Targets of visually guided saccades and reaches are encoded by many neurons in posterior parietal cortex. Specifically, neurons in the lateral intraparietal area (LIP) and the parietal reach region (PRR) respond to the appearance of a task-relevant visual target in their response field (RF) with a transient increase in activity (Goldberg and Bruce 1985; Blatt et al. 1990; Colby et al. 1996; Gottlieb et al. 1998; Colby and Goldberg 1999; Snyder et al. 1997, 2000; Calton et al. 2002; Scherberger and Andersen 2007; Cui and Andersen 2007, 2011; Pesaran et al. 2008). The parietal regions LIP and PRR might thus be thought of as equivalent in regard to their response to target onset.
However, LIP and PRR also exhibit some differences. LIP activity appears to be more tightly linked to attentional and saccadic oculomotor systems, whereas PRR activity might be more tightly linked to the somatomotor system (Colby et al. 1993, 1996; Snyder et al. 1997; Calton et al. 2002; Dickinson et al. 2003; Quian Quiroga et al. 2006). Furthermore, an inspection of data in a visually guided task (Snyder et al. 2000, their Fig. 4) suggests that the onset of a single target results in earlier, crisper responses in LIP compared with PRR. Nonetheless, other studies recording from LIP or from PRR in visually guided tasks do not suggest a marked difference between the responses to target onset in the two regions (Goldberg and Bruce 1985; Blatt et al. 1990; Colby et al. 1996; Gottlieb et al. 1998; Colby and Goldberg 1999; Snyder et al. 1997; Calton et al. 2002; Scherberger and Andersen 2007; Cui and Andersen 2007; Pesaran et al. 2008; Cui and Andersen 2011). An interpretation of these inconclusive data is complicated by the fact that no study to date has compared neuronal responses in the two regions in the same animals and in the same tasks.
Fig. 4.
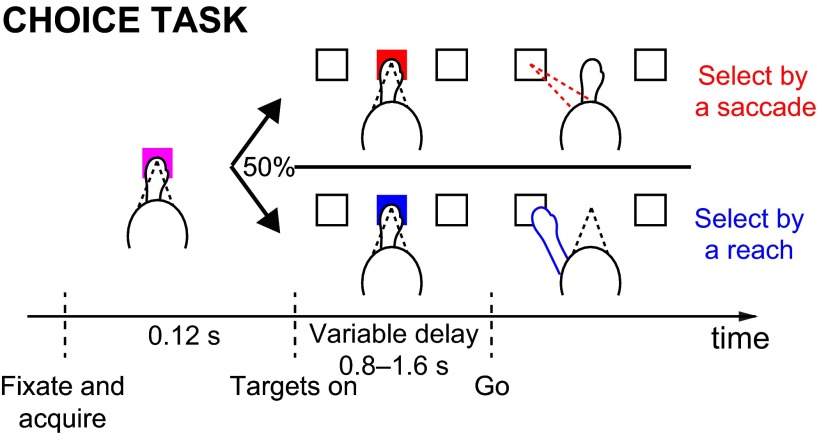
Choice task. Animal chooses to move to either a RF target or an opposite target based on the recent history of rewards associated with each target (see materials and methods for details). Color of a central cue (red or blue) instructs the animal to move a particular effector (a saccade or a reach, respectively).
We hypothesize that an attentional and oculomotor node-like LIP might receive relatively unprocessed visual inputs that are suitable for supporting the putative role of LIP in the rapid deployment of eye movements. In contrast, as part of the somatomotor network, PRR might receive relatively more processed information about the visual world, suitable for supporting a more deliberative role in deciding whether and where to reach. To test whether transient responses following abrupt visual onsets are of similar natures in LIP and PRR, we recorded from these two regions while monkeys performed a visually guided movement task and a reward-based choice task. We first replicate previous results that suggest that the transient responses of PRR neurons are reduced in amplitude and delayed in time compared with the transient responses in LIP. We then show that this effect is substantially greater in a reward-based choice task. We find that in this task, PRR neurons do not show a visual transient and instead exhibit a gradual build up of activity. These markedly distinct target-related responses in the two parietal regions, particularly prominent in a choice task, suggest that the two regions have different functional roles within their respective oculomotor and somatomotor networks.
MATERIALS AND METHODS
Subjects.
We trained two male rhesus monkeys (macaca mulatta, 7 kg and 8 kg) to make a saccade or a reach to a target (visually guided task) or to one of two targets (choice task). In both monkeys, we recorded from the hemisphere that is contralateral to the reaching arm. All procedures conformed to the Guide for the Care and Use of Laboratory Animals and were approved by the Washington University Institutional Animal Care and Use Committee. The animals sat head-fixed in a custom designed monkey chair (Crist Instrument) in a completely dark room. Visual stimuli were back projected by a CRT projector onto a custom touch panel positioned 25 cm in front of the animals' eyes. Eye position was monitored by a scleral search coil system (CNC Engineering).
Choice task.
In the choice task, the animal first fixates on and puts his hand on a purple central target (a square of 1 by 1 visual degrees). After 120 ms, two white targets appear, one in the RF of the recorded neuron and one at the opposite location. At the same time, the central target changes color randomly to either red or blue. After a variable delay of 800–1,600 ms, the central target disappears, thus cueing the animal to move. To receive a drop of liquid reward, the animal must make a saccade or a reach (if the central target is red or blue, respectively) to within 6 visual degrees of the chosen target. Trials in which the animal moved the wrong effector, moved prematurely, or moved inaccurately were aborted and not subsequently analyzed. In this task, each target is associated with a reward on each trial. The reward consists of a drop of water, delivered by the opening of a valve for a particular length of time. The associated rewards have a ratio of either 3:1 or 1.5:1. The ratio is held constant in blocks of 7–17 trials (exponentially distributed with a mean of 11) and then changed to either 1:3 or 1:1.5. The time that the reward valve is held open is drawn from a truncated exponential distribution that ranges from 20 to 400 ms. The mean of the exponential distribution differs for each target and depends on the reward ratio for that block. For reward ratios of 1.5:1 (3:1), the means for the richer and poorer target are 140 and 70 ms (250 and 35 ms), respectively. This randomization prevented the animals from stereotypically choosing the more valuable option. To help prevent animals from overlearning the specific distributions of reward durations, we further randomized reward delivery by multiplying valve open times by a value between 80% and 120%. This value was changed on average every 70 trials (exponential distribution truncated to between 50 and 100). An auditory cue was presented to the monkeys during the time the valve was open.
In this task, although one target was worth on average only 50 or 33% as much as the other, since rewards are drawn from truncated exponential distributions that changed every 7 to 17 trials, animals successfully chose the more valuable target on only 63% of trials. Interestingly, in this task, in about three to four trials following a switch of a reward ratio, the animals' behavior converges to a level dictated by the strict matching law (i.e., the proportion of choices of a given option is equal to the proportion of the average reward obtained for that option). We analyze this interesting behavior in a separate study.
Visually guided task.
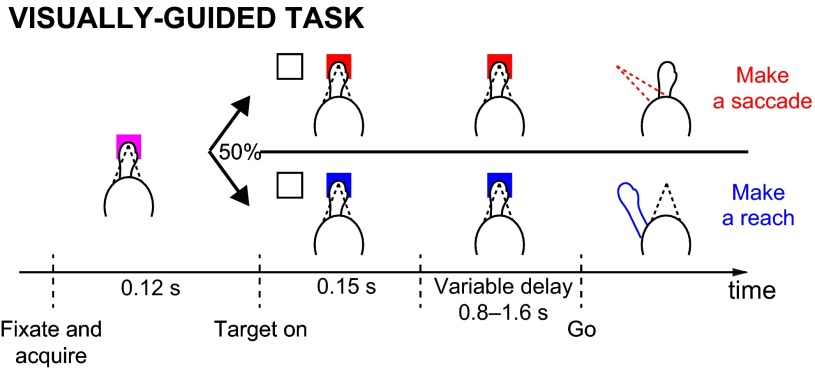
The visually guided task was identical to the choice task except that only one white target appears randomly either inside the RF or at the opposite location, and the target is extinguished after 150 ms following its appearance. To receive a drop of liquid reward in this task, the animal must make a saccade or a reach (if the central target is red or blue, respectively) to within 6 visual degrees of the remembered location of the white target. The reward in the visually guided task was fixed and equal to the mean reward in the choice task. Trials in which the animal moved the wrong effector, moved prematurely, or moved inaccurately were aborted and not subsequently analyzed.
Electrophysiological recordings.
We lowered glass-coated tungsten electrodes (Alpha Omega, impedance 0.5–3 MΩ at 1 kHz) 2.8–10.8 mm below the dura into LIP, and 2.1–11.6 mm below the dura into PRR. We detected individual action potentials using a dual-window discriminator (BAK Electronics). A custom program ran the task and collected the neural and behavioral data. Anatomical MR scans were used to localize the lateral and medial bank of the intraparietal sulcus. We next identified a region midway along the lateral bank containing a high proportion of neurons with transient responses to visual stimulation, strong perisaccadic responses, and sustained activity on saccade trials that was greater or equal to that on reach trials (LIP); and a second region towards the posterior end of the medial bank containing a high proportion of neurons with transient responses to visual stimulation and sustained activity that was greater on reach than saccade trials (PRR). The requirement of sustained activity was considered as one of the defining properties of areas LIP and PRR. Once a cell was isolated, we characterized its response RF. Specifically, we tested responses to targets at one of eight equally spaced polar angles and two radial eccentricities (12 or 18 visual degrees) and defined the RF by the direction and eccentricity that elicited the maximal transient response from a given neuron. We recorded from cells that showed maintained activity during the delay period for either a saccade or a reach (about half of all cells in LIP and in PRR). Next, we recorded neural data in the visually guided task [at least 10 valid trials for each movement (saccades, reaches, into RF, out of RF), that is, at least valid 40 trials overall; 52 trials on average]. We then recorded as many trials as possible using the choice task (average of 340 valid trials).
Measurement of neuronal activity.
We quantified neuronal effects in the visually guided and choice tasks by counting, separately for each cell, the number of spikes occurring in the interval from 100 to 200 ms following target onset and converting to a firing rate by dividing by the duration, i.e., 100 ms. In all analyses, neuronal activity was assessed relative to baseline firing rate (mean 21.5 sp/s in LIP and 15.8 sp/s in PRR) measured in the interval 50 ms before to 20 ms after target onset. This baseline interval was chosen to avoid contamination from any residual movement-related activity that follows the acquisition of the central target during the short period (120 ms) between the acquisition of the central target and peripheral target onset. We chose this relatively short period because robust visual responses were elicited regardless of whether we used a longer or the shorter interval. Similar results were obtained using raw firing rates, i.e., when firing rates were not measured relative to a baseline. The difference between target-related responses in the two regions is marked and does not depend on a particular choice of the interval in which neural activity is measured. For instance, a significant difference in target-related responses in the two regions is observed also when responses are quantified in an earlier interval from the time of target onset to 100 ms following target onset.
Analysis of response latency.
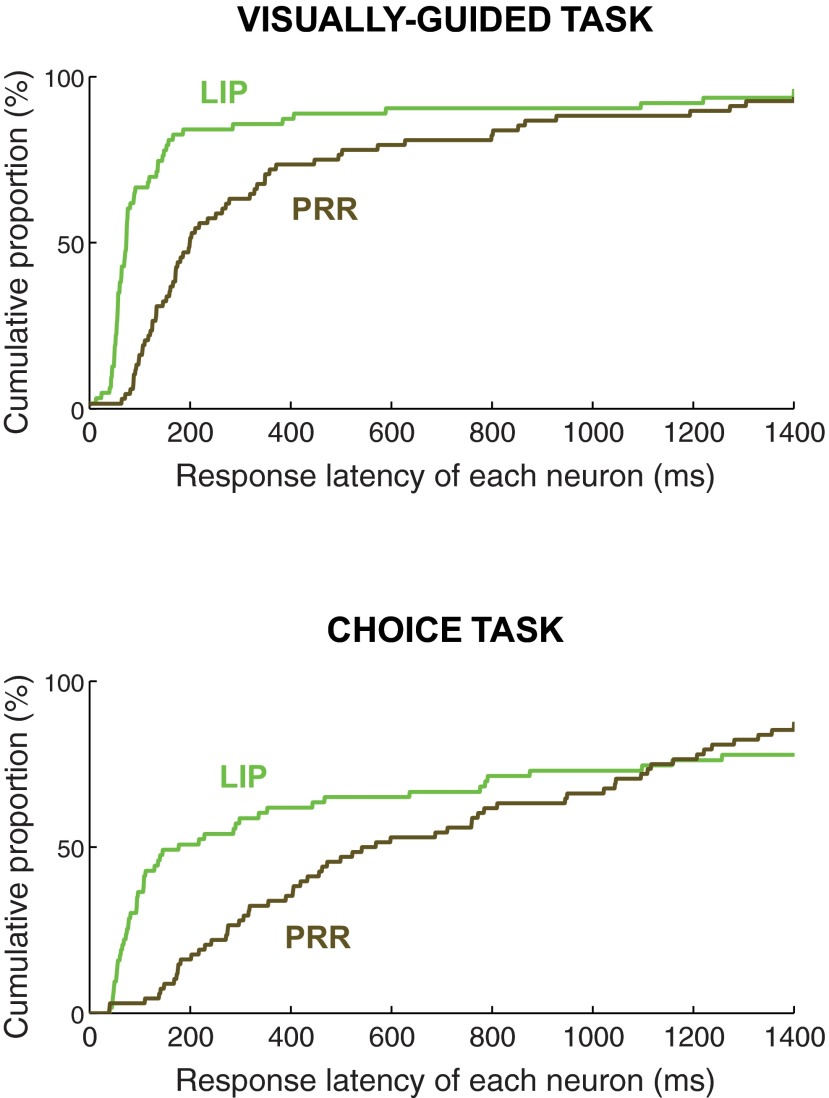
We detected the latency of the response to target onset in each cell (see Fig. 8) using two methods: the Poisson spike train analysis and the Poisson fit analysis. In the Poisson fit approach (e.g., Maunsell and Gibson 1992), spike data are cumulated into consecutive bins of 20-ms time windows, overlapping by 1 ms. The spike count rates in each bin (i.e., the number of spikes in each bin divided by the bin width and the number of trials) are then tested against the Poisson distribution with the mean equal to the spike count rate determined over a baseline period spanning the interval from 250 ms preceding target onset to the time of target onset. The time of response onset is then taken as the first time bin in which the probability that the bin spike rate of a given bin is drawn from the baseline Poisson distribution is lower than a threshold (P = 0.01); this requirement must be fulfilled also for all the consecutive bins up to a certain time point (50 ms in our case).
Fig. 8.
Latency of neuronal responses to target onset. The curves give the cumulative distribution of the response latency of each neuron (60 neurons in LIP and 65 neurons in PRR) relatively to target onset (time 0). The analysis includes all saccades into RF (LIP) and all reaches into RF (PRR). Data are displayed separately for LIP neurons (green traces) and PRR neurons (brown traces), for the visually guided task (top) and the choice task (bottom). This analysis reveals that PRR neurons have substantially longer response latencies compared with LIP neurons. The effect is particularly pronounced in the choice task (bottom). Not all neurons show a significant response relative to the baseline and so the cumulative traces fall short of the 100% of neurons.
The Poisson spike train analysis (e.g., Legendy and Salcman 1985; Hanes et al. 1995; Thompson et al. 1996; Schmolesky et al. 1998; Pouget et al. 2005) compares the interspike intervals (ISI) between individual pairs of spikes against an ISI distribution the mean of which is estimated over the entire trial period. The time of response onset is then detected as the first time in which the probability that a given ISI is shorter than that of the background distribution drops below a predefined threshold. We used the p_burst() implementation of the Schall lab available at http://www.psy.vanderbilt.edu/faculty/schall/scientific-tools/ with default settings (threshold P = 0.01). We found that the method gives more robust results when spike times are cumulated from each trial and when latency is computed over this cumulated spike train, compared with when latency is computed for each trial with the results averaged over the individual trials.
Both methods report the same principal effects. In particular, in the visually guided task, which gives rise to prominent neural responses to target onset, the median latencies established using the two methods are statistically indistinguishable [median latency in LIP: 74 and 76 ms for the Poisson fit and for the Poisson spike train method, respectively, difference in the medians P = 0.95 (Wilcoxon signed rank test); PRR: 193 and 200 ms, P = 0.57]. Therefore, for simplicity, we report the neuronal response latencies using just the former method.
Visualization of time course.
For visual purposes, we estimated the time course of neuronal firing rate in each region. Peristimulus time histograms, evaluated in 1-ms bins, were low-pass filtered using a 181-point low-pass digital filter with a transition band from 2 to 15 Hz and a −3 dB point at 9 Hz. The filter was not applied to quantify the differences between target-related responses in LIP and PRR, i.e., the filter was applied neither in the measurement of neural activity in an interval of interest (Measurement of neuronal activity) nor in the analysis of response latency in each cell (Analysis of response latency). In these quantitative analyses, we work with the raw spike times data.
RESULTS
We compared the responses of 60 LIP and 65 PRR neurons to abrupt visual onsets in a visually guided task and in a choice task. In the first part of the article we briefly present neuronal responses in the often used visually guided task. We then compare these data to the responses observed in a reward-based choice task.
In the visually guided task (Fig. 1), animals are instructed to move, after a short delay period, to a single visual target placed either inside the neuronal RF or in the opposite location. Animals were cued to make either an eye movement or an arm movement on each trial. Unless specified otherwise, we focus on responses to saccade trials in LIP and reach trials in PRR. Further in the article, we show that our findings hold also for reaches in LIP and saccades in PRR. We also specifically analyze, unless stated otherwise, all trials in which a movement is made to a target in the RF of the recorded cell.
Fig. 1.
Visually guided task. A single target is flashed inside or outside of the neuronal response field (RF). After a delay, the animal makes a movement to that target and receives a reward. Ccolor of a central cue (red or blue) instructs the animal to move a particular effector (a saccade or a reach, respectively).
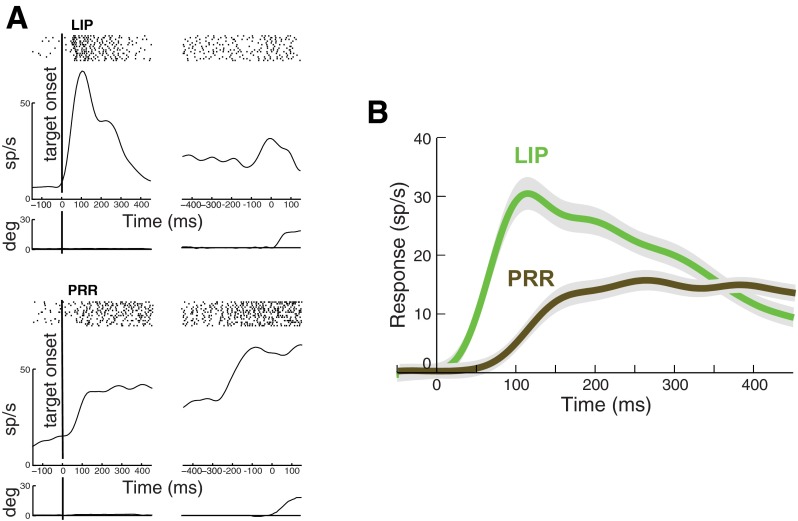
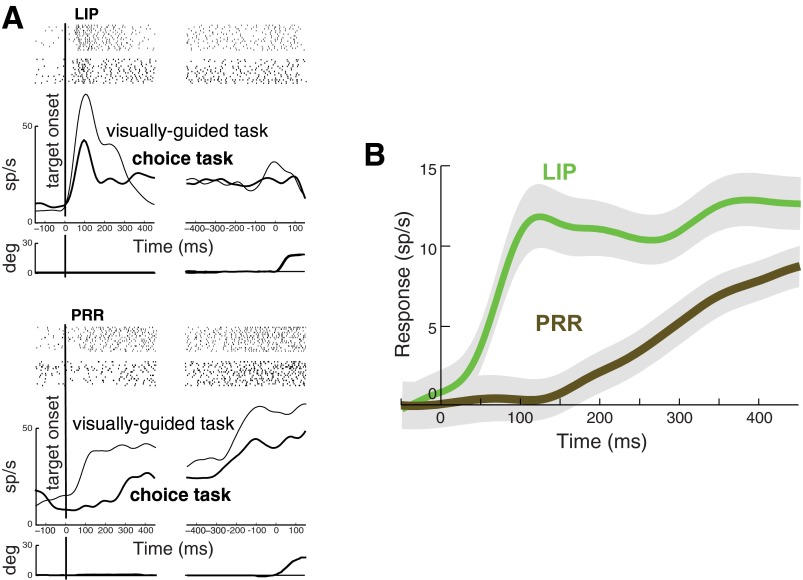
The responses of an LIP neuron for saccades into the RF and a PRR neuron for reaches into the RF in the visually guided task are given in Fig. 2A. Both the LIP and the PRR cell show a brisk response to the onset of the target in the RF, significantly diverging from the baseline (see materials and methods) at 41 and 65 ms following target onset, respectively.
Fig. 2.
Responses of lateral intraparietal area (LIP) and parietal reach region (PRR) neurons in the visually guided task. A: responses of an LIP and a PRR neuron. Shown are mean responses in the first 15 trials in which the animal makes a saccade (LIP) or a reach (PRR) into the neuron RF. Activity is aligned to the onset of the target (left) and to movement onset (right). Top: raster plot indicates the times of the cell discharge during each trial. Bottom: average eye (LIP) and arm (PRR) position traces. B: response of the LIP and PRR neuronal populations. All trials from each neuron in which the animal makes a saccade (LIP) or a reach (PRR) into the RF are included. Time course of the averaged responses in LIP (green, n = 60 cells) and PRR (brown, n = 65 cells) are given. Activity is aligned to target onset. Peristimulus time histogram was smoothed with a low-pass filter (see materials and methods). Responses are plotted relative to a baseline in the interval from 50 ms preceding target onset to 20 ms following target onset (see materials and methods).
The time course of the responses of the populations of 60 LIP and 65 PRR neurons to target onset in the visually guided task are shown in Fig. 2B. Figure 2B demonstrates that both LIP and PRR neurons show a prominent transient response to target onset, in accord with previous studies (Goldberg and Bruce 1985; Colby et al. 1996; Dickinson et al. 2003; Snyder et al. 1997; Calton et al. 2002; Cui and Andersen 2007, 2011). In this task, LIP cells respond with a median latency (see materials and methods) of 74 ms following target onset. Such a brisk response is in line with previous findings (Bisley and Goldberg 2003; Bisley et al. 2004; Gottlieb et al. 2005; Ipata et al. 2006, 2009). In comparison, PRR neurons show a slower response, with a median latency of 193 ms following target onset.
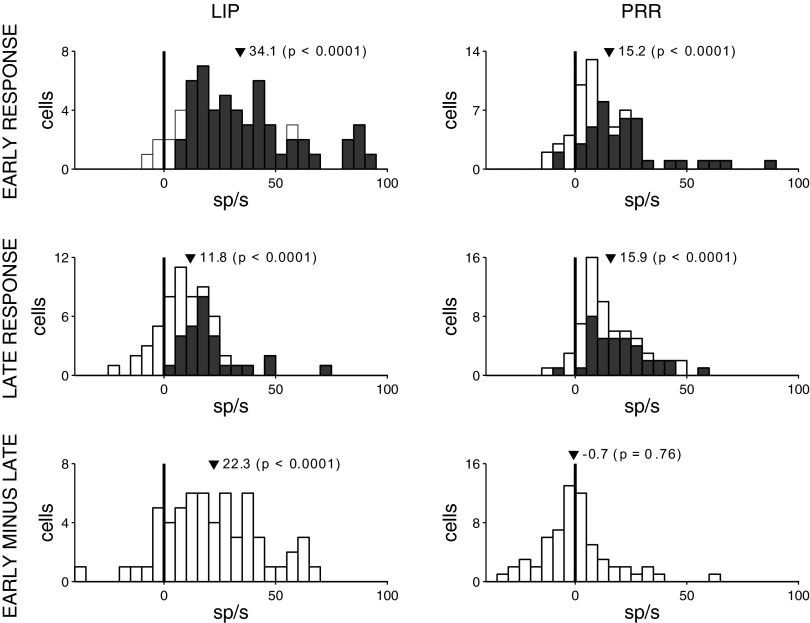
We quantified these responses in an early interval (100–200 ms following target onset) and in a late interval (400–500 ms following target onset), relative to the baseline. Figure 3 shows the responses in the two intervals separately for each cell, for saccades into RF in LIP and reaches into RF in PRR. Figure 3, top, demonstrates that both LIP and PRR neurons respond prominently to target onset. Specifically, in the early interval, LIP and PRR neurons, respectively, show a 34.1 and 15.2 sp/s increase in activity relative to the baseline (P < 0.0001 and P < 0.0001, two-tailed t-test, n = 60 and n = 65). The target-related increase is significant (P < 0.05, two-tailed t-test) in 87% of cells in LIP and in 60% of cells in PRR. Previous studies report that LIP neurons show a stronger transient response to target onset compared with PRR neurons (Goldberg and Bruce 1985; Colby et al. 1996; Dickinson et al. 2003; Snyder et al. 1997; Calton et al. 2002; Cui and Andersen 2007, 2011). Indeed, we found that the difference in the early response in LIP and PRR is significant (P < 0.0001, two-tailed t-test, n1 = 60, n2 = 65; monkey 1, P = 0.0067, nLIP = 40, nPRR = 34; monkey 2, P < 0.001, nLIP = 20, nPRR = 31). Furthermore, previous studies demonstrate that shortly following the initial transient, LIP neurons decrease their activity (Goldberg and Bruce 1985; Colby et al. 1996; Dickinson et al. 2003), whereas PRR neurons do not show a marked decrease (Snyder et al. 1997; Calton et al. 2002). Indeed, in the late interval compared with the early interval, LIP neurons showed a decrease from 34.1 to 11.8 sp/s (Fig. 3, left middle), and the difference of 22.3 sp/s is significant (P < 0.0001, Fig. 3, left bottom). In comparison, the response of PRR neurons in the late interval, 15.9 sp/s (Fig. 3, right middle), is statistically indistinguishable from the early response 15.2 sp/s (difference −0.7 sp/s not significant, P = 0.76; Fig. 3, right bottom).
Fig. 3.
Responses of each cell in the visually guided task. All trials from each neuron in which the animal makes a saccade (LIP) or a reach (PRR) into the RF are included. Data are given separately for LIP (left) and PRR (right) and are measured relative to a baseline interval from 50 ms preceding the onset of the target to 20 ms following the onset. Responses are taken in an early interval (100–200 ms after target onset, top), and a late interval (400–500 ms after target onset, middle). Bottom: difference in the early and late responses. In each histogram, the dark triangle gives the mean, and the P value the outcome of the associated two-tailed t-test. Dark parts at top and middle denote the cells that show a statistically significant (P < 0.05) response compared with the baseline.
The data in the visually guided task reproduce the findings of previous studies. Crucially, we next investigated how the same populations of parietal neurons respond to target onset during choice. In the choice task (Fig. 4), animals select, after a short delay period, between two targets, one placed inside the RF and one in the opposite location. One target offers, on average, a higher amount of liquid reward than the other target. The precise amount of liquid reward delivered on each trial is subject to exponentially distributed noise (see materials and methods for details), and the assignment of the more valuable target flipped frequently and unpredictably. As a result, our animals switched frequently in their choices between the two targets (30.8% of trials in one monkey and 31.0% in the other).
The responses of the same LIP and PRR example cells in the choice task, compared with the visually guided task, are presented in Fig. 5A, for saccades into RF in LIP and reaches into RF in PRR. The LIP cell exhibits a prominent transient response to target onset in the choice task, with response latency of 47 ms (compared to 41 ms in the visually guided task). In a striking contrast, the PRR cell in the choice task shows effectively no transient; its activity significantly deviates from the baseline first after more than a second following target onset, at 1161 ms (compared with 65 ms in the visually guided task).
Fig. 5.
Responses of LIP and PRR neurons in the choice task. A: responses of the same LIP and PRR neurons in the choice task, compared with the visually guided task. Same format as in Fig. 2A, with thick (thin) traces and rasters representing data in the choice task (visually guided task). B: responses of the LIP and PRR neuronal populations in the choice task. Same format as in Fig. 2B, for the choice task.
The responses of the LIP and PRR populations to target onset in the choice task are given in Fig. 5B. This figure reveals that LIP neurons respond vigorously to target onset. The median response latency is 109 ms. In a striking contrast, no such response is observed in PRR. Activity in PRR builds up much more gradually, with a median response latency 468 ms.
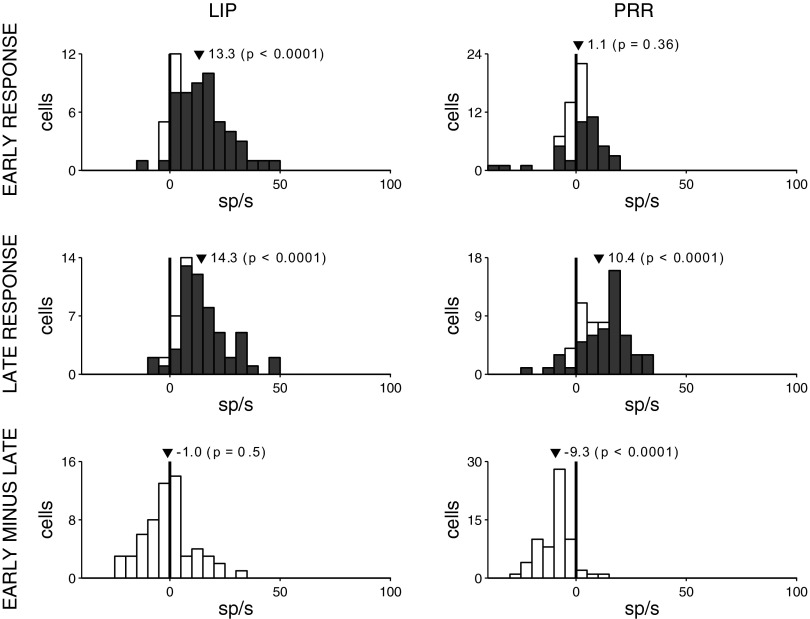
We quantify the responses in the choice task for each individual cell in Fig. 6 in the same way as in Fig. 3. This figure confirms the impression of Fig. 5B that target onset in the choice task evokes a robust transient response in LIP (Fig. 6, top left) but not in PRR (Fig. 6, top right). The mean response in LIP is a 13.3 sp/s increase in firing (P < 0.0001, two-tailed t-test, n = 60), and a substantial proportion of cells (83%; P < 0.05, two-tailed t-test, response vs. baseline) shows a significant increase in response to target onset. In comparison, the mean response in PRR (Fig. 6, top right) is a nonsignificant 1.1 sp/s increase in firing (P = 0.36, two-tailed t-test, n = 65), and 45% of cells show a significant increase. The effect in LIP is substantially and significantly stronger than the effect in PRR, both at the population level and when the data from each individual monkey are considered separately (P < 0.0001, two-tailed t-test, nLIP = 60 cells, nPRR = 65 cells; monkey 1, P < 0.0001, nLIP = 40, nPRR = 34; monkey 2, P < 0.001, nLIP = 20, nPRR = 31). The striking absence of a transient in the choice task in PRR is specific to the early interval; in the late interval (Fig. 6, middle right), PRR neurons show a robust response (10.4 sp/s, P < 0.0001). The difference of −9.3 sp/s is significant (P < 0.0001; Fig. 6, bottom right). In LIP, the late response (14.3 sp/s; Fig. 6, middle left) is indistinguishable from the early response (P = 0.5).
Fig. 6.
Responses of each cell in the choice task. Same format as in Fig. 3.
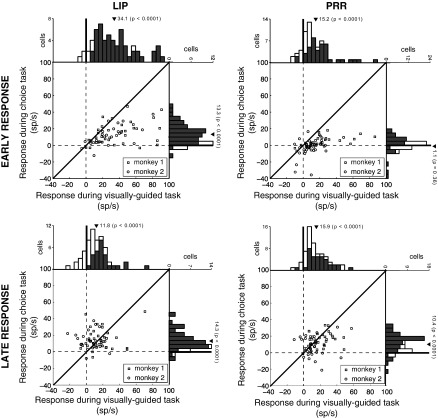
It is possible that the reduced responses to target onset in PRR compared with LIP are in part due to a generally lower rate of neural discharge in PRR compared with LIP. The responses of LIP neurons significantly differ from the responses of PRR neurons in both the visually guided task (mean response in LIP 34.1 sp/s; in PRR: 15.2 sp/s; difference P < 0.0001, two-tailed t-test) and in the choice task (mean response in LIP 13.3 sp/s; in PRR: 1.1 sp/s; difference P < 0.0001, two-tailed t-test). However, later in the trial, the responses in LIP and PRR are comparable in both the visually guided task (mean response in LIP 11.8 sp/s; in PRR: 15.9 sp/s; difference P = 0.06, two-tailed t-test) and in the choice task (mean response in LIP 14.3 sp/s; in PRR: 10.4 sp/s; difference P = 0.12, two-tailed t-test). Thus, later in the trial, the two regions show statistically indistinguishable responses. The marked difference between LIP and PRR in the choice task is therefore specific to the early time window following target onset. Next, we compared the responses in the visually guided and the choice tasks for each cell (Fig. 7). The early responses are higher in the visually guided task compared with the choice task (difference 20.8 10 sp/s, P < 0.0001 in LIP; 14.1 sp/s, P < 0.0001 in PRR). In the late period, the difference between the responses in the two tasks vanishes in LIP (difference 2.5 sp/s, P = 0.30) and is reduced but significant in PRR (difference 5.5 sp/s, P = 0.0057). Two recent studies (Hwang and Andersen 2011, 2012) suggest the existence of two classes of neurons within PRR. The visuo-motor class shows both an early transient response and a movement-related response, whereas the motor class exhibits only movement-related build up of activity. In other words, the two classes of neurons differ in the magnitude of their early response. Figure 7 allows us to assess whether our dataset can distinguish distinct classes of neurons based on the early response in the visually guided and choice tasks. The figure does not provide evidence for distinct subpopulations of neurons within PRR or LIP in our tasks.
Fig. 7.
Comparison of responses of LIP and PRR neurons in the visually guided and the choice tasks. All trials from each neuron in which the animal makes a saccade (LIP) or a reach (PRR) into the RF are included. Plots give the response of each LIP (left) and PRR (right) cell in the interval from 100 to 200 ms after target onset (early response, top), and 400 to 500 ms after target onset (late response, bottom), relative to the baseline. Histograms quantify the number of cells in each bin of response magnitude. Dark triangle gives the mean. P value is the outcome of the associated two-tailed t-test. While LIP neurons show substantial early responses in both the visually guided and choice tasks, PRR neurons show early responses only in the visually guided task. In the choice task, the early response in PRR is absent. As a control, PRR neurons exhibit a robust response in the choice task in the late period (bottom).
Next, we compared the distributions of response onsets (latencies) for each cell in the two areas and in each task. We computed response latency by counting the number of spikes occurring within 20-ms bins overlapping by 1 ms. For each of the bins, we then computed the probability that the spike count rate for the bin is drawn from the Poisson distribution whose mean equals the spike count rate over a 250-ms baseline period (Maunsell and Gibson 1992; see materials and methods). The time of response onset then corresponds to the time of the first bin in which the probability drops below a predefined threshold (P < 0.01) and stays low for a predefined number of consecutive bins (for 50 ms).
The analysis of response latency (Fig. 8) reveals that LIP neurons show in the visually guided task (green top trace) a crisp transient response. The median latency of the LIP population in this task is 74 ms. Such brisk response is in line with previous studies (Goldberg and Bruce 1985; Bisley et al. 2004). A clear transient in LIP is notable also in the choice task (green bottom trace; median latency 109 ms). In contrast, PRR neurons respond substantially later compared with LIP. The effect is noticeable in the visually guided task (brown top trace; median latency 193 ms compared with 74 ms in LIP, P < 0.0001, Wilcoxon rank sum test), and is particularly pronounced in the choice task (Fig. 8, brown bottom trace; median latency 468 ms compared with 109 ms in LIP, P < 0.0001) in which the PRR population shows effectively no early transient. This analysis corroborates the results of the analysis of the differences in the early discharge activity in the two regions. Both analyses indicate that in the choice task PRR neurons are activated much more gradually than LIP neurons.
We tested whether the transient response of parietal neurons is a function of which target the animal chooses in the choice task (Fig. 9). When animals move to the RF or the opposite direction, respectively, the mean early LIP responses relative to baseline are 13.3 sp/s (P < 0.0001, t-test, n = 60) and 10.3 sp/s (P < 0.0001, t-test, n = 60 cells). The difference (2.9 sp/s) is small but significant (paired two-tailed t-test P = 0.0011, n = 60). In contrast, PRR neurons fail to show an early visual transient when animals choose the RF target (mean 1.1 sp/s, P = 0.36, t-test, n = 65 cells) and also fail to show an early visual transient when animals choose the opposite target (mean −2.7 sp/s, P = 0.0073, t-test, n = 65). The difference (3.8 sp/s) is small but significant (paired two-tailed t-test P = 0.014, n = 65) In both areas, as expected, the animals' choice has a substantial effect later in the trial (LIP: RF choice, 14.3 sp/s, antiRF choice, 5.9 sp/s; difference P < 0.0001; PRR: RF choice, 10.4 sp/s, antiRF choice, −3.4 sp/s; difference P < 0.0001). Early in the trial, however, the difference between early transient responses in LIP and PRR is largely independent of the animals' choice.
Fig. 9.

Target-related response difference between LIP and PRR is independent of animals' choice. A: responses of LIP and PRR neurons in the choice task, separately for choices of the RF target and choices of the opposite target. Saccade trials in LIP and reach trials in PRR are included. B: responses of each cell in each area during RF and antiRF choices, separately for the early and late periods.
The reduction in response magnitude by LIP neurons in the choice task compared with the visually guided task could be related to the different reward structures in the two tasks. Responses of LIP neurons are modulated by reward size (Platt and Glimcher 1999; Sugrue et al. 2004; Dorris and Glimcher 2004; Seo et al. 2009). However, since the mean reward sizes in the visually guided task and in the choice task were fixed at 110 ms of valve opening time, mean reward size cannot explain the difference in the neuronal responses in the two tasks. We also considered whether LIP neurons might respond in the choice task more vigorously on those trials in which the monkey might expect a large reward. To test this, we conditioned the neuronal responses in the interval 100–200 ms following target onset on the size of the reward received on the preceding trial. For choices into the RF, trials that followed the top 50% of rewards obtained for RF choices on the previous trial were associated with a mean response of only 0.2 sp/s more than trials that followed the bottom 50% of rewards. This difference is minimal compared with the 20.8 sp/s difference in early neuronal response between the choice and visually guided tasks. Using more complex models to estimate the animals' expectation of reward resulted in no more than a 4 sp/s reward-based modulation, an amount that is still too small to explain the observed 20.8 sp/s drop in activity between the visually guided and the choice tasks.
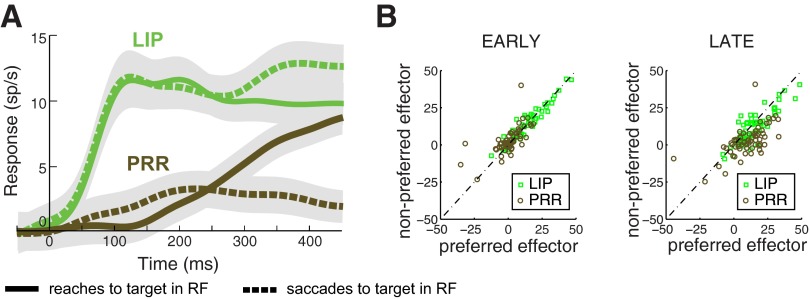
Finally, we investigated whether the transient response is a function of the effector animals choose with. In particular, we tested whether the observations made for saccades in LIP and reaches in PRR (Fig. 5B) also hold for saccades in PRR and reaches in LIP. Indeed, this is the case (Fig. 10). In the early period, the mean LIP response for reaches relative to baseline is 13.7 sp/s, indistinguishable from the responses for saccades (P = 0.83, paired t-test, n = 60). The mean PRR response for saccades relative to baseline is 3.0 sp/s, similar to the response for reaches (P = 0.039, paired t-test, n = 65). In the late period, the movement effector has a substantial effect on firing rate in both areas (LIP: saccades, 14.3 sp/s, reaches, 11.2 sp/s, difference P < 0.001; PRR: reaches, 10.4 sp/s, saccades, 2.8 sp/s, difference P < 0.0001).
Fig. 10.
Target-related response difference between LIP and PRR is independent of movement effector. A: same format as in Fig. 5B, with data shown separately for each effector. B: early and late responses of each cell in each area during choices made using the preferred effector (saccades in LIP and reaches in PRR) and the nonpreferred effector (reaches in LIP and saccades in PRR).
DISCUSSION
In this study, we compared the early transient responses of LIP and PRR neurons to target onset while monkeys performed a visually guided movement task and a reward-based choice task. We based our investigation on an inspection of data in a visually guided task (Snyder et al. 2000, their Fig. 4) that suggest that LIP and PRR neurons may respond differently to the onset of task-relevant stimuli. Figure 4 suggests that the early response of PRR neurons is lower in amplitude and occurs later in time compared with the brisker response observed in LIP. This effect has not been systematically investigated. Data in other studies that assessed responses to target onset separately in LIP or in PRR suggest that the difference between the early responses of LIP and PRR neurons is subtle (Goldberg and Bruce 1985; Blatt et al. 1990; Colby et al. 1996; Gottlieb et al. 1998; Colby and Goldberg 1999; Snyder et al. 1997; Calton et al. 2002; Scherberger and Andersen 2007; Cui and Andersen 2007; Pesaran et al. 2008; Cui and Andersen 2011). Indeed, we found that the difference in the visual task was relatively slight. However, in a reward-based choice task, PRR neurons strikingly show no transient to target onset. The PRR transient that has been consistently observed in visually guided tasks (Snyder et al. 1997; Calton et al. 2002; Scherberger and Andersen 2007; Cui and Andersen 2007; Pesaran et al. 2008; Cui and Andersen 2011 and in the present study) is in this choice task instead replaced with a gradual build up of activity. This contrasts the responses of LIP neurons which show a clear transient in the choice task.
A possibly simple explanation that may account for this difference between LIP and PRR is that information from visual cortex arrives to PRR through an intermediate node, such as LIP itself, which causes a delay in the PRR response. In this case, one would expect the response in PRR, compared with LIP, to be delayed by a small multiple of the synaptic transmission delay, i.e., by up to a few tens of milliseconds (Lin and Faber 2002). However, we found (Fig. 8 bottom) that the difference in median latency between LIP and PRR amounts to 350 ms. This long delay is unlikely to be explained through a simple synaptic delay in information flow. It is to note that our data do not exclude the possibility that information arrives into PRR from LIP; our data only suggest that there is substantial intermediate processing of information before its reaching PRR.
We propose that the difference between the transient responses of LIP and PRR neurons, respectively, reflects the different computations the oculomotor and the somatomotor systems perform during the animal's interaction with visual objects in the environment. While it is possible to rapidly scan a visual scene by making multiple saccades to visual targets within a second, it is likely undesirable and sometimes impossible to make limb or bodily movements at such a rapid pace. In particular, there is a higher cost to making multiple rapid arm movements compared with multiple saccades. A rapid sequence of arm movements takes more time than the same sequence of eye movements, requires much more energy, is likely more distracting, and could even lead to injury. Thus, unless there is just a single clear target in sight, the animal should carefully assess whether a given visual object is worth reaching for. A neural consequence may be that there is more processing in the visual pathways leading into early somatomotor circuits compared with oculomotor circuits and hence less autonomy in response to target onset in PRR compared with LIP neurons.
Behavioral experiments also suggest that saccades and reaches to visual targets involve different computations. Hick's law states that, in general, reaction time increases with the number of possible choices (Hick 1952; Hyman 1953). However, for visually guided saccades, Hick's law is violated: response time does not change or is even reduced when the number of possible targets is increased (Kveraga et al. 2002; Lawrence et al. 2008). Thus the mechanism of programming saccades to a suddenly appearing target is not substantially taxed by the number of possible saccade alternatives, that is, by the predictability of the target location. One way the nervous system might achieve such an efficient sensory to motor transformation is to closely link the visual and saccadic pathways. That is, the system may be configured such that the sudden appearance of a target may more or less automatically introduce a transient into the oculomotor circuitry, as observed in LIP.
In contrast to the case of visually guided saccades, Hick's law is obeyed for visually guided reaches. Reach reaction times vary inversely with the number of potential targets (Kveraga et al. 2002; Lawrence et al. 2008; Lawrence and Gardella 2009). This suggests that choosing a target for a reach is a more deliberate process than choosing a target for a saccade. This more deliberate process may be reflected in the slower rise of activity in PRR neurons observed in our study.
Furthermore, the amount of processing that occurs before the appearance of a visually evoked transient response in PRR may depend on the demands of the task at hand. There may be more processing for a task that requires a choice between two targets compared with a task in which only a single salient stimulus is presented, and this difference may explain why the transient response in PRR is more reduced and more delayed in time in the choice task compared with the PRR transient in the visually guided movement task. There are discrepancies in the literature in the extent to which the earliest portion of the transient in PRR is modifiable by cognitive factors (Snyder et al. 1997, 2000; Scherberger and Andersen 2007; Pesaran et al. 2008; Cui and Andersen 2011). We now report that in a demanding reward-based choice task, there is no transient. The lack of the transient suggests that the input to this parietal region reflects the involvement of a higher order cognitive process likely related to the animal's decision of whether and where to reach. This process may incorporate a combination of one or more subprocesses, including behavioral relevance, valuation, attention, and movement selection. Our data encourage future investigators to vary task demands and to attempt to isolate the individual factors that give rise to the prominent modulation of PRR activity observed in our study.
In summary, we found that in a visually guided task and in a choice task, the response to target onset in parietal oculomotor circuits differs dramatically from the response to target onset in parietal somatomotor circuits. While LIP neurons show crisp transient responses to target onsets, PRR neurons respond much more sluggishly or deliberately. The difference in responses in the two areas is greater in a more difficult task. The differences in the timing and slope of the transient response suggest that the oculomotor and somatomotor parietal systems are differentially coupled to visual input. The oculomotor system is tightly coupled while the somatomotor system is more loosely coupled. We propose that this neural architecture supports the performance of distinct computations in the two systems. The tight coupling of the oculomotor system to visual input is suitable to support the rapid deployment of eye movements to visual targets. In contrast, the relatively loose coupling of the somatomotor system to visual input supports a more deliberative operation of this system reflecting the decisions of whether and where to reach.
GRANTS
This work was supported by National Eye Institute Grants EY-012135 and EY-002687.
DISCLOSURES
No conflicts of interest, financial or otherwise, are declared by the author(s).
AUTHOR CONTRIBUTIONS
Author contributions: J.K. and C.W. performed experiments; J.K. and L.H.S. analyzed data; J.K. and L.H.S. interpreted results of experiments; J.K. and L.H.S. prepared figures; J.K. and L.H.S. edited and revised manuscript; J.K. and L.H.S. approved final version of manuscript; J.K. and L.H.S. conception and design of research; J.K. and L.H.S. drafted manuscript.
REFERENCES
- Bisley JW, Krishna BS, Goldberg ME. A rapid and precise on-response in posterior parietal cortex. J Neurosci 24: 1833–1838, 2004 [DOI] [PMC free article] [PubMed] [Google Scholar]
- Bisley J, Goldberg M. Neuronal activity in the lateral intraparietal area and spatial attention. Science 299: 81–86, 2003 [DOI] [PubMed] [Google Scholar]
- Blatt G, Andersen R, Stoner G. Visual receptive field organization and cortico-cortical connections of the lateral intraparietal area (area lip) in the macaque. J Comp Neurol 299: 421–445, 1990 [DOI] [PubMed] [Google Scholar]
- Calton JL, Dickinson AR, Snyder LH. Non-spatial, motor-specific activation in posterior parietal cortex. Nat Neurosci 5: 580–588, 2002 [DOI] [PubMed] [Google Scholar]
- Colby C, Duhamel J, Goldberg M. The analysis of visual space by the lateral intraparietal area of the monkey: the role of extraretinal signals. Prog Brain Res 95: 307–316, 1993 [DOI] [PubMed] [Google Scholar]
- Colby C, Duhamel J, Goldberg M. Visual, presaccadic, and cognitive activation of single neurons in monkey lateral intraparietal area. J Neurophysiol 76: 2841–2852, 1996 [DOI] [PubMed] [Google Scholar]
- Colby C, Goldberg M. Space and attention in parietal cortex. Annu Rev Neurosci 22: 319–349, 1999 [DOI] [PubMed] [Google Scholar]
- Cui H, Andersen R. Different representations of potential and selected motor plans by distinct parietal areas. J Neurosci 31: 18130–18136, 2011 [DOI] [PMC free article] [PubMed] [Google Scholar]
- Cui H, Andersen RA. Posterior parietal cortex encodes autonomously selected motor plans. Neuron 56: 552–559, 2007 [DOI] [PMC free article] [PubMed] [Google Scholar]
- Dickinson AR, Calton JL, Snyder LH. Nonspatial saccade-specific activation in area lip of monkey parietal cortex. J Neurophysiol 90: 2460–2464, 2003 [DOI] [PubMed] [Google Scholar]
- Dorris MC, Glimcher PW. Activity in posterior parietal cortex is correlated with the relative subjective desirability of action. Neuron 44: 365–378, 2004 [DOI] [PubMed] [Google Scholar]
- Goldberg M, Bruce C. Cerebral cortical activity associated with the orientation of visual attention in the rhesus monkey. Vision Res 25: 471–481, 1985 [DOI] [PubMed] [Google Scholar]
- Gottlieb J, Kusunoki M, Goldberg M. Simultaneous representation of saccade targets and visual onsets in monkey lateral intraparietal area. Cereb Cortex 15: 1198–1206, 2005 [DOI] [PMC free article] [PubMed] [Google Scholar]
- Gottlieb J, Kusunoki M, Goldberg M. The representation of visual salience in monkey parietal cortex. Nature 391: 481–484, 1998 [DOI] [PubMed] [Google Scholar]
- Hanes D, Thompson K, Schall J. Relationship of presaccadic activity in frontal eye field and supplementary eye field to saccade initiation in macaque: Poisson spike train analysis. Exp Brain Res 103: 85–96, 1995 [DOI] [PubMed] [Google Scholar]
- Hick W. On the rate of gain of information. Q J Exp Psychol B 4: 11–26, 1952 [Google Scholar]
- Hwang E, Andersen R. Effects of visual stimulation on LFPs, spikes, and LFP-spike relations in PRR. J Neurophysiol 105: 1850–1860, 2011 [DOI] [PMC free article] [PubMed] [Google Scholar]
- Hwang E, Andersen R. Spiking and lfp activity in prr during symbolically instructed reaches. J Neurophysiol 107: 836–849, 2012 [DOI] [PMC free article] [PubMed] [Google Scholar]
- Hyman R. Stimulus information as a determinant of reaction time. J Exp Psychol 45: 188, 1953 [DOI] [PubMed] [Google Scholar]
- Ipata A, Gee A, Bisley J, Goldberg M. Neurons in the lateral intraparietal area create a priority map by the combination of disparate signals. Exp Brain Res 192: 479–488, 2009 [DOI] [PMC free article] [PubMed] [Google Scholar]
- Ipata A, Gee A, Gottlieb J, Bisley J, Goldberg M. Lip responses to a popout stimulus are reduced if it is overtly ignored. Nat Neurosci 9: 1071–1076, 2006 [DOI] [PMC free article] [PubMed] [Google Scholar]
- Kveraga K, Boucher L, Hughes H. Saccades operate in violation of hick's law. Exp Brain Res 146: 307–314, 2002 [DOI] [PubMed] [Google Scholar]
- Lawrence B, Gardella A. Saccades and reaches, behaving differently. Exp Brain Res 195: 413–418, 2009 [DOI] [PubMed] [Google Scholar]
- Lawrence B, John A, Abrams R, Snyder L. An anti-hick's effect in monkey and human saccade reaction times. J Vis 8: 1–7, 2008 [DOI] [PubMed] [Google Scholar]
- Legendy C, Salcman M. Bursts and recurrences of bursts in the spike trains of spontaneously active striate cortex neurons. J Neurophysiol 53: 926–939, 1985 [DOI] [PubMed] [Google Scholar]
- Lin JW, Faber DS. Modulation of synaptic delay during synaptic plasticity. Trends Neurosci 25: 449, 2002 [DOI] [PubMed] [Google Scholar]
- Maunsell JH, Gibson JR. Visual response latencies in striate cortex of the macaque monkey. J Neurophysiol 68: 1332–1344, 1992 [DOI] [PubMed] [Google Scholar]
- Pesaran B, Nelson M, Andersen R. Free choice activates a decision circuit between frontal and parietal cortex. Nature 453: 406–409, 2008 [DOI] [PMC free article] [PubMed] [Google Scholar]
- Platt ML, Glimcher PW. Neural correlates of decision variables in parietal cortex. Nature 400: 233–238, 1999 [DOI] [PubMed] [Google Scholar]
- Pouget P, Emeric E, Stuphorn V, Reis K, Schall J. Chronometry of visual responses in frontal eye field, supplementary eye field, and anterior cingulate cortex. J Neurophysiol 94: 2086–2092, 2005 [DOI] [PubMed] [Google Scholar]
- Quian Quiroga R, Snyder L, Batista A, Cui H, Andersen R. Movement intention is better predicted than attention in the posterior parietal cortex. J Neurosci 26: 3615–3620, 2006 [DOI] [PMC free article] [PubMed] [Google Scholar]
- Scherberger H, Andersen RA. Target selection signals for arm reaching in the posterior parietal cortex. J Neurosci 27: 2001–2012, 2007 [DOI] [PMC free article] [PubMed] [Google Scholar]
- Schmolesky M, Wang Y, Hanes D, Thompson K, Leutgeb S, Schall J, Leventhal A. Signal timing across the macaque visual system. J Neurophysiol 79: 3272–3278, 1998 [DOI] [PubMed] [Google Scholar]
- Seo H, Barraclough DJ, Lee D. Lateral intraparietal cortex and reinforcement learning during a mixed-strategy game. J Neurosci 29: 7278–7289, 2009 [DOI] [PMC free article] [PubMed] [Google Scholar]
- Snyder LH, Batista AP, Andersen RA. Coding of intention in the posterior parietal cortex. Nature 386: 167–170, 1997 [DOI] [PubMed] [Google Scholar]
- Snyder L, Batista A, Andersen R. Intention-related activity in the posterior parietal cortex: a review. Vision Res 40: 1433–1441, 2000 [DOI] [PubMed] [Google Scholar]
- Sugrue LP, Corrado GS, Newsome WT. Matching behavior and the representation of value in the parietal cortex. Science 304: 1782–1787, 2004 [DOI] [PubMed] [Google Scholar]
- Thompson K, Hanes D, Bichot N, Schall J. Perceptual and motor processing stages identified in the activity of macaque frontal eye field neurons during visual search. J Neurophysiol 76: 4040–4055, 1996 [DOI] [PubMed] [Google Scholar]


