

Abstract
Fibroblast growth factor (FGF) signaling mutations are a frequent contributor to craniofacial malformations including midfacial anomalies and craniosynostosis. FGF signaling has been shown to control cellular mechanisms that contribute to facial morphogenesis and growth such as proliferation, survival, migration and differentiation. We hypothesized that FGF signaling not only controls the magnitude of growth during facial morphogenesis but also regulates the direction of growth via cell polarity. To test this idea, we infected migrating neural crest cells of chicken embryos with replication-competent avian sarcoma virus expressing either FgfR2C278F, a receptor mutation found in Crouzon syndrome or the ligand Fgf8. Treated embryos exhibited craniofacial malformations resembling facial dysmorphologies in craniosynostosis syndrome. Consistent with our hypothesis, ectopic activation of FGF signaling resulted in decreased cell proliferation, increased expression of the Sprouty class of FGF signaling inhibitors, and repressed phosphorylation of ERK/MAPK. Furthermore, quantification of cell polarity in facial mesenchymal cells showed that while orientation of the Golgi body matches the direction of facial prominence outgrowth in normal cells, in FGF-treated embryos this direction is randomized, consistent with aberrant growth that we observed. Together, these data demonstrate that FGF signaling regulates cell proliferation and cell polarity and that these cell processes contribute to facial morphogenesis.
INTRODUCTION
Since the beginning of the last century, embryologists, morphologists and evolutionary biologists have focused on identifying mechanisms and processes by which cell aggregates, tissues, organs and organisms attain their form (1). During this period of time, much progress has been made in identifying and understanding major processes that regulate morphogenesis. Two major cellular processes contribute to morphogenesis during vertebrate development. First, regions of differential cell proliferation and apoptosis have been observed and proposed to underlie divergent morphologies (2–4). Secondly, more recently polarized cell behaviors, such as collective migration, convergence extension and oriented cell division, have been shown to give rise to complex three-dimensional structure in a variety of tissues and organs (5–8). Understanding how the developing vertebrate face attains its shape is extremely important, because this will allow us to understand the mechanisms that underlie disease phenotypes in humans with genetic alterations.
Craniofacial morphogenesis is a complex developmental process. The amniote face is formed from a series of anlagen that are comprised of neural crest mesenchyme surrounding a mesodermal core and encased by epithelia of neural or surface ectodermal origin. Five primordia form the upper and lower jaw. The frontonasal process (FNP) forms the middle part of the upper jaw, the paired maxillary processes (MxP) form the lateral part of the upper jaw and the paired mandibular processes form the lower jaw. During the formation of each of these primordia, a series of iterative signaling interactions among epithelial layers and mesenchymal cells control patterned growth (9,10). Understanding the role that these signaling interactions play in controlling morphogenesis is essential to understand the basic cellular processes that control growth and patterning during normal and diseased development.
The fibroblast growth factor (FGF) signaling pathway is essential for normal development. In chick embryos, Fgf8 is expressed in the ectoderm of the FNP prior to the formation and onset of FNP outgrowth. However, once outgrowth commences, Shh expression is induced the ectoderm of the FNP and this expression domains form a boundary with the cells that express Fgf8 (11–14). Concomitant with the onset of Shh expression, Fgf8 expression is downregulated across the midline of the FNP and becomes restricted to the nasal pits (14). A similar pattern of expression is observed during the development of mouse embryos (12,15), suggesting a conserved role for Fgf8 during the development of the amniote face.
Genetic removal of Fgf8 creates significant malformations in the face (15,16). In particular, the absence of FGF8 signaling leads to increased apoptosis of the facial mesenchyme, and this creates dysmorphology. Importantly, mesenchymal cells throughout the FNP of mice and chicks express fibroblast growth factor receptor 2 (FgfR2) (17), and this pattern is also observed in humans (18,19). Taken together, these observations indicate that FGF signaling from the ectoderm to the mesenchyme may be a central component of the epithelial–mesenchymal interactions that regulate facial morphogenesis.
In humans, aberrant FGF signaling results in a variety of skeletal disorders that often include facial dysmorphology (20–23). Loss-of-function mutations in FGF8, FGF10 and Fgf receptors have been found in patients with non-syndromic cleft lip and palate (24,25). Mutations in FgfR2 that reduces FGF signaling have been associated with Bent Bone Dysplasia (OMIM 614592) and Lacrimoauriculodentodigital syndrome (OMIM 149730) (26–28). In contrast, mutations that create gain-of-function Fgf receptors are found in a series of craniosynostosis syndromes. In a 10-year prospective cohort of craniosynostosis at the Oxford clinic, Fgf receptors accounted for almost half of the identified genetic cases (21). FgfR2 activating mutations (P253, S252, C278, C342) consist of ∼81% cases of FgfR2 mutation series (22,29). Patients with craniosynostosis syndromes, including Jackson–Weiss Syndrome (OMIM 123150), Apert Syndrome (OMIM 101200), Pfeiffer Syndrome (OMIM 101600) and Crouzon Syndrome (OMIM 123500), have premature suture closure and midfacial malformations such as hypertelorism and midfacial hypoplasia (21,30–32).
Crouzon syndrome mainly results from gain-of-function mutations in FgfR2. Two of the most frequent mutations found in patients with Crouzon syndrome are FgfR2C278F and FgfR2C342Y. These mutations produce receptors that are activated independently of ligand and affect two different splice variants of FgfR2 (33). The mutation C342Y only affects the c isoform, and the C278F is located in exon 7 of FgfR2 and influences both b and c isoforms of FgfR2 proteins in vivo. Thus, malformations produced by C278F mutations may be more severe in general. While the mechanisms by which these mutations cause premature suture closure have been extensively investigated (33–42), the effect that these mutations have on early development of the facial primordia have not been explored in great detail.
Here, our goal was to understand that how activating mutations in the FGF pathway may contribute to the facial dysmorphology observed in human patients by examining the effect of activation of the FGF pathway on early stages of facial development. We manipulated the FGF pathway in a model organism and examined the cellular basis for the morphological outcomes that were produced. Specifically, we infected chicken embryos with avian retroviruses expressing Fgf8 or FgfR2C278F. Ectopic activation of FGF signaling produced midfacial hypoplasia and hypertelorism during the early stages of facial morphogenesis. These morphogenetic changes were associated with decreased cell proliferation, increased expression of FGF signaling inhibitors, reduced phosphorylation of ERK and randomized cell polarity within the neural crest cell population. Together, our results support the hypothesis that FGF signaling participates in morphogenesis by controlling the magnitude of cell proliferation and directed cellular behaviors, such as collective cell migration, convergence extension and/or oriented cell division during the early stages of facial development.
RESULTS
Ectopic activation of FGF signaling results in facial malformation
To investigate the effects of activating the FGF pathway on development of the midface, we infected cranial neural crest cells destined for the FNP and MxP at HH10 by injecting retroviruses encoding Fgf8, FgfR2C278F, or alkaline phosphatase as a control, into the mesenchyme adjacent to the prosencephalon. In previous experiments, these methods lead to widespread infection of the neural crest cells that comprise the developing upper jaw (43). Here, we examined embryos at 72 h postinfection (HH22) with RCAS::Fgf8 and observed expression in the mesenchyme (Supplementary Material, Fig. S1) and in the ectoderm (Fig. 3A). By this time embryos infected with RCAS::Fgf8 and RCAS::FgfR2C278F had severe facial malformations compared with control and uninfected embryos (Fig. 1A–D). The faces were wider (Fig. 1C, D and G). The FNP was not undergoing proximodistal extension (Supplementary Material, Fig. S2C, D and E), and this made the nasal pits appear to be located more dorsally (Fig. 1C and D; Supplementary Material, Fig. S2A and B). Our embryos did not survive to later stages of development for a thorough analysis of the skeleton.
Figure 3.

Analysis of gene expression in FGF signaling in normal and RCAS::Fgf8 infected embryos at HH22. (A and C) qPCR shows gene expression levels in the ectoderm of normal embryos (white bars) and embryos infected with RCAS::Fgf8 (black bars). Gene expression is relative to GAPDH. (A) The ectoderm of embryos infected with RCAS::Fgf8 showed signs of slight infection including GAG expression and increased Fgf8 expression. Downstream targets and (C) expression of the FGF signaling antagonists were not affected in the ectoderm of infected embryos. (B and D) Comparison of gene expression levels in the mesenchyme of normal embryos (white bars) and embryos infected with RCAS::Fgf8 (black bars). (B) Viral infection of the mesenchyme is apparent as increased GAG and Fgf8 expression. The downstream targets Pea3, Er81 and Erm were significantly upregulated in the mesenchyme of infected embryos. (D) The FGF signaling antagonists Spred1, Spred2, Spry1, Spry2 and Dusp6/Mkp3 were significantly upregulated in the infected embryos. (E) Western blot analysis shows that embryos infected with RCAS::Fgf8 had decreased levels of pERK, but no change in pPLCg and pAKT. DF-1 cells were used as a positive control for the western blot. Addition of FGF2 protein to DF-1 cultures illustrates increases in pPLCg, pERK and pAKT, and these increases could be blocked by the addition of SU5402, an FgfR inhibitor, to the media. These results demonstrate that our detection method is sufficient to detect changes in levels of these proteins.
Figure 1.

Analysis of shape change after activating the FGF pathway. (A) Normal and (B) control embryos have similar morphology at HH22 whereas embryos infected with (C) RCAS::Fgf8 and (D) RCAS::FgfR2C278F are smaller and have dysmorphic FNP. (E) At HH18, embryos are not statistically different in shape and completely overlap on PC1-3 (circle in each group is 95% confidence interval), (F) which account for ∼78% total variation. (G) By HH22 infected embryos are statistically different in shape (P < 0.001) and can be discriminated from normal and control embryos along PC1 as a reduction in FNP and MxP outgrowth (circle in each group is 95% confidence interval). Normal and control embryos differ along PC2 but overall shape differences were not significant (P > 0.05). (H) All other PC axes are non-significant. Scale = 2 mm.
Next, we quantified the change in facial shape using two-dimensional geometric morphometrics and principal components analysis (PCA) (44,45) and tested whether there was a difference in shape associated with infection by RCAS::Fgf8 or RCAS::FgfR2C278F. These analyses demonstrate, using a permutation test for the Procrustes distance between groups in MorphoJ, that there was not a statistically significant difference between treated and control embryos at HH18 (P > 0.05, Fig. 1E and F), but by HH22 both treated groups were significantly different (P < 0.001, Fig. 1G and H), and could be discriminated on the basis of Principal Component 1 (PC1) alone. Wireframes of embryo shape along PC1 depict shape variation among control groups and FGF-treated groups (Fig. 1G). This axis of shape variation describes relatively underdeveloped facial prominences even when accounting for size differences, indicating an effect of treatments on the growth of the MxP and the FNP. Shape variation of Fgf8 and FgfR2C278F groups was also separated along PC2, which describes widening of the face (Fig. 1G). This was more prominent in embryos infected with RCAS::Fgf8. Our analyses demonstrate that activating the FGF pathway with either construct produces morphologically similar malformations, and that the resulting variation is continuous with and overlaps the normal variation in control and uninfected embryos (Fig. 1G). This observation is similar to a recent conclusion on studies of human patients with craniosynostosis (46).
Activation of the FGF pathway reduces cell proliferation
FGF signaling influences cell survival and cell proliferation (16,47). To investigate whether cell death or proliferation was altered in embryos infected with RCAS::Fgf8 or RCAS::FgfR2C278F, we used TUNEL (Fig. 2D, F, H and J) to visualize dying cells and BrdU incorporation (Fig. 2C, E, G and I) to detect proliferating cells in the FNP. We did not observe an increase in cell death in any of the embryos (Fig. 2D, F, H and J). However, we observed a significant reduction in the proportion of cells that incorporated BrdU (P < 0.001, Fig. 2K). Since PC1 described variation in mediolateral expansion of the FNP (Fig. 1), we quantified cell proliferation in the middle and lateral parts of the FNP (Fig. 2A). In this assay, BrdU positive cells were counted in three independent sections of every embryo. In control and normal embryos, ∼52% of the cells had incorporated BrdU and this is consistent with our previous research (48). In contrast, only 44 and 43% of cells were BrdU positive in embryos infected with RCAS::Fgf8 or RCAS::FgfR2C278F, respectively (Fig. 2K). Similarly, mice harboring a mutation in FgfR2C342Y that causes craniosynostosis in humans also have decreased proliferation in the palatal mesenchyme (41). To test the extent to which decreased cell proliferation may explain the phenotype in these embryos, we performed a regression analysis to correlate cell proliferation with PC1. We observed a significant linear correlation between these two outcome measures (r2 = 0.577, Fig. 2L), suggesting that at least part of the phenotype was related to the decreased rate of cell proliferation.
Figure 2.

Decreased cell proliferation in FGF signaling activated embryos at HH22. (A) Low magnification of an embryo immunostained to detect BrdU incorporation. The boxed area is the region that was analyzed. (B) Low magnification of an embryo after TUNEL analysis. (C) BrdU incorporation and (D) TUNEL staining in a normal embryo. (E) BrdU incorporation and (F) TUNEL staining in a control embryo. (G) BrdU incorporation and (H) TUNEL staining in an embryo infected with RCAS::Fgf8. There is reduced BrdU incorporation, but no signs of increased apoptosis. Similar (I) proliferation and (J) apoptosis outcomes were observed in embryos infected with RCAS::FgfR2C278F. (K) There was an ∼10% decrease in cell proliferation in embryos infected with RCAS::Fgf8 and RCAS::FgfR2C278F. (L) The shape change along PC1 is correlated with the rate of cell proliferation in the groups of embryos. The circle in each group is the 95% confidence interval. Scale bar: A and B = 1 mm; C–J = 200 mm.
Constitutive activation of the FGF pathway leads to negative feedback loop activation and ERK phosphorylation decrease
FGF signaling activates expression of a group of downstream target genes including negative regulators and transcription factors. We first examined the expression levels of well-known transcriptional targets of the FGF pathway in embryos infected with RCAS::Fgf8. Specifically, we analyzed the Ets family of transcription factors Pea3, Erm and Er81 at HH22. All three of these target genes were upregulated in the mesenchyme of embryos infected with RCAS::Fgf8 compared with normal embryos (Fig. 3A and B), indicating FGF8 expression effectively activated downstream pathways.
Expression of FGF pathway inhibitors can be upregulated in response to FGF pathway activation (49) too. We performed qPCR analysis on the mesenchyme and ectoderm samples of embryos infected with RCAS::Fgf8 and compared with the levels to normal embryos at HH22 (Fig. 3C and D). Spry1, Spry2, Spred2 and Mkp3/Dusp6 were significantly increased in the mesenchyme of embryos infected with RCAS::Fgf8 compared with normal embryos (Fig. 3D). However, there was no significant change in Spred1 expression (Fig. 3D). Taken together, our data indicate that increasing expression of Fgf8 leads to the increased expression of downstream targets of the FGF pathway including negative regulators of pathway activation.
FGF signaling occurs via the Ras/MAPK, PI3K/AKT and PLCγ signaling cascades to regulate distinct cellular responses during development (47,50–53). To determine how each of these pathways was affected in embryos infected with RCAS::Fgf8 at HH22, we compared dpERK1/2, pAKT(S473) and pPLC1γ1(Y783) protein levels in cells derived from the FNP of infected and normal embryos using western blot analysis (Fig. 3E). As a positive control, we examined the expression levels of these molecules in the presence or absence of an Fgf receptor inhibitor (SU5402), or after blocking each arm of the FGF pathway (U0126, U73122). Those small molecular inhibitors effectively block downstream phosphorylation cascades in FGF signaling. In the DF1 cells, we observed upregulation of pPLCγ after adding FGF2 (Fig. 3E; Supplementary Material, Fig. S3A and B), and this response was blocked by the presence of SU5402 and U73122 (Supplementary Material, Fig. S3B). However, in embryonic mesenchymal cells, we could not detect either pPLCγ protein or total PLCγ even after a very long exposure time (Fig. 3E, data not shown). Similarly, exogenous FGF ligand increased the presence of pAKT in DF1 cells (Supplementary Material, Fig. S3B), while we observed no difference in pAKT expression in embryos of each group (Fig. 3E). Particularly, we observed a reduction in dpERK1/2 levels in mesenchymal cells from the infected embryos compared with normal embryos (Fig. 3E). Next, to determine if these changes may have caused the malformations in the embryos or were a secondary consequence of altered signaling in the face, we analyzed embryos at HH20 prior to the appearance of an overt phenotype and observed the same results (Supplementary Material, Fig. S4). Together, these data suggest that the major signaling mechanism in the embryonic mesenchymal cells during the early stages of FNP development is via the ERK/MAPK pathway, and activation of this pathway is reduced during constitutive activation of the FGF pathway. The decreased amount of dpERK1/2 protein in infected embryos is consistent with the increased expression of the FGF inhibitors (Fig. 3C and D), and the decreased activity of the ERK/MAPK pathway in embryos may contribute to the decreased cell proliferation that we observed.
Effect of constitutive activation of the FGF pathway on expression of other molecular mediators of facial development
Facial development is a complex process that requires co-ordination among a variety of facial anlage. SHH signaling is essential for midfacial patterning and variation (11,12,45). At HH22, in embryos infected with RCAS::Fgf8, Shh expression in the facial ectoderm decreased by ∼60% (Fig. 4A). Likewise, the downstream transcriptional target of SHH signaling Patched (Ptc) was also significantly decreased in the facial ectoderm (Fig. 4A). The decreased expression levels of Shh and the subsequent reduction in SHH signaling may contribute to the decreased proliferation that we observed in embryos infected with RCAS::Fgf8 and RCAS::FgfR2C278F. Further, these data suggest that there is an antagonism between Fgf8 expression or signaling and the onset of Shh expression in the ectoderm. In fact, when Shh expression begins in the ectoderm, the adjacent Fgf8 expression domain is downregulated and becomes restricted to the nasal pit (14). Whether the downregulation of Fgf8 in part controls the onset of Shh expression in the ectoderm is not known.
Figure 4.

Analysis of SHH and WNT signaling in normal and RCAS::Fgf8 embryos. (A) Expression levels of Shh and Ptc were decreased in the ectoderm of infected embryos, but Wnt5a and Wnt9b were unaltered. (B) Shh and Wnt9b are not expressed in the mesenchyme, and no change in Ptc or Wnt5a was detected in the mesenchyme of infected embryos. (C) Whole mount in situ hybridization shows that Shh expression in a normal embryo is restricted to the roof of the mouth and (D) in embryos infected with RCAS::Fgf8, Shh was expanded due to widening of the face. Scale bar C, D = 2 mm.
We previously showed that the spatial organization of the Shh expression domain in the ectoderm is highly related to the developing facial morphology (12,45). Therefore, in addition to determining changes in the magnitude of Shh expression and pathway activation, we also wanted to determine the effect that RCAS::Fgf8 infection had on the spatial organization of the Shh expression domain. Compared with normal embryos, the Shh expression domain was expanded in infected embryos (Fig. 4C and D), and this was correlated with the widening of the face that we observed, suggesting that either the change in pattern of Shh expression contributed to the morphologic change or was a secondary consequence of facial widening. However, determining this relationship is beyond the scope of the current work.
In addition to the SHH pathway, the WNT pathway is also involved in regulating facial development (54,55). Several WNT ligands are expressed in the ectoderm and mesenchyme of the midface by HH22 (56). We examined Wnt9b and Wnt5a expression via qPCR and determined that the expression levels of these genes were not significantly different between embryos infected with RCAS::Fgf8 and normal embryos (Fig. 4A and B).
Golgi orientation distribution is consistent with facial prominence outgrowth direction and has changed in FGF-treated embryos
Polarized cell behaviors have been associated with morphogenesis. Here, we determined whether cell polarity was altered by FGF signaling. In the limb bud, the Golgi orientation bias in the mesenchymal cells is related to the proximodistal axis of the limb bud (5,57). Since we observed decreased phosphorylation of ERK (Fig. 3E) and the ERK/MAPK pathway regulates the localization of the Golgi body (58), we examined cell polarity of the neural crest mesenchyme based on Golgi orientation.
To determine the Golgi orientation bias in the neural crest cells, we measured the angle between the Golgi body and the nucleus in each cell. We then used a fixed axis as a reference line. In the middle of the FNP, we used the rostral–caudal axis of the FNP, and in the lateral region we used a line that was presumed to be in the direction of fusion of the median nasal and lateral nasal processes. These lines correspond to the 0° line shown in Figure 5A. As expected, we observed that the Golgi body was located on one side of the nucleus indicating that Golgi orientation bias could be used as a measure of individual cell polarity (Fig. 5B). In normal embryos at HH22 and HH24, we observed that in the majority of cells the Golgi body was located on the distal side of the cell, and that the entire population of cells was highly polarized and the mean vector of the Golgi angle distribution was aligned with reference lines in both medial and lateral portions of the FNP (Fig. 6A–D, Table 1). In the medial FNP of embryos infected with RCAS::Fgf8 and RCAS::FgfR2C278F, we still observed a bias in the position of the Golgi apparatus in individual cells, and the mean vector of the Golgi angle distribution was still aligned with the rostral–caudal axis of head (Fig. 6E–J, Table 1). However, the Golgi angles had a more randomized distribution and this is indicated by the decreased consistency ratio (Fig. 6E–J, Table 1). In the lateral portion of the FNP of embryos infected with RCAS::Fgf8 and in severely malformed embryos due to RCAS::FgfR2C278F infection, the Golgi orientation was randomized (Fig. 6F and H, Table 1). However, in embryos infected with RCAS::FgfR2C278F but with a mild phenotype, we did not observe a randomization of Golgi orientation (Fig. 6J, Table 1).
Figure 5.
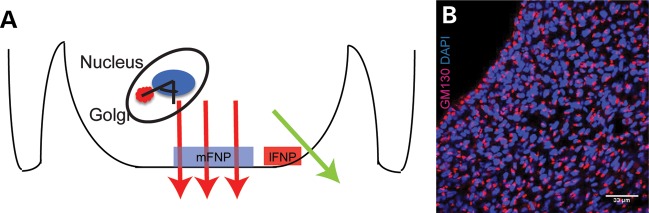
Assay to examine Golgi body orientation. (A) Schematic presentation of Golgi angle measurement. The angle between the Golgi body and the nucleus in each cell was determined relative to the direction of growth (large arrows). The direction of growth was used as the reference line (i.e. 0°). We analyzed the medial and lateral regions of the FNP and we labeled them mFNP and lFNP. (B) Immunofluorescent detection of Golgi using GM130 illustrates that the Golgi body is located on one side of the nucleus in all of the cells of the FNP. Scale bar = 33 mm.
Figure 6.
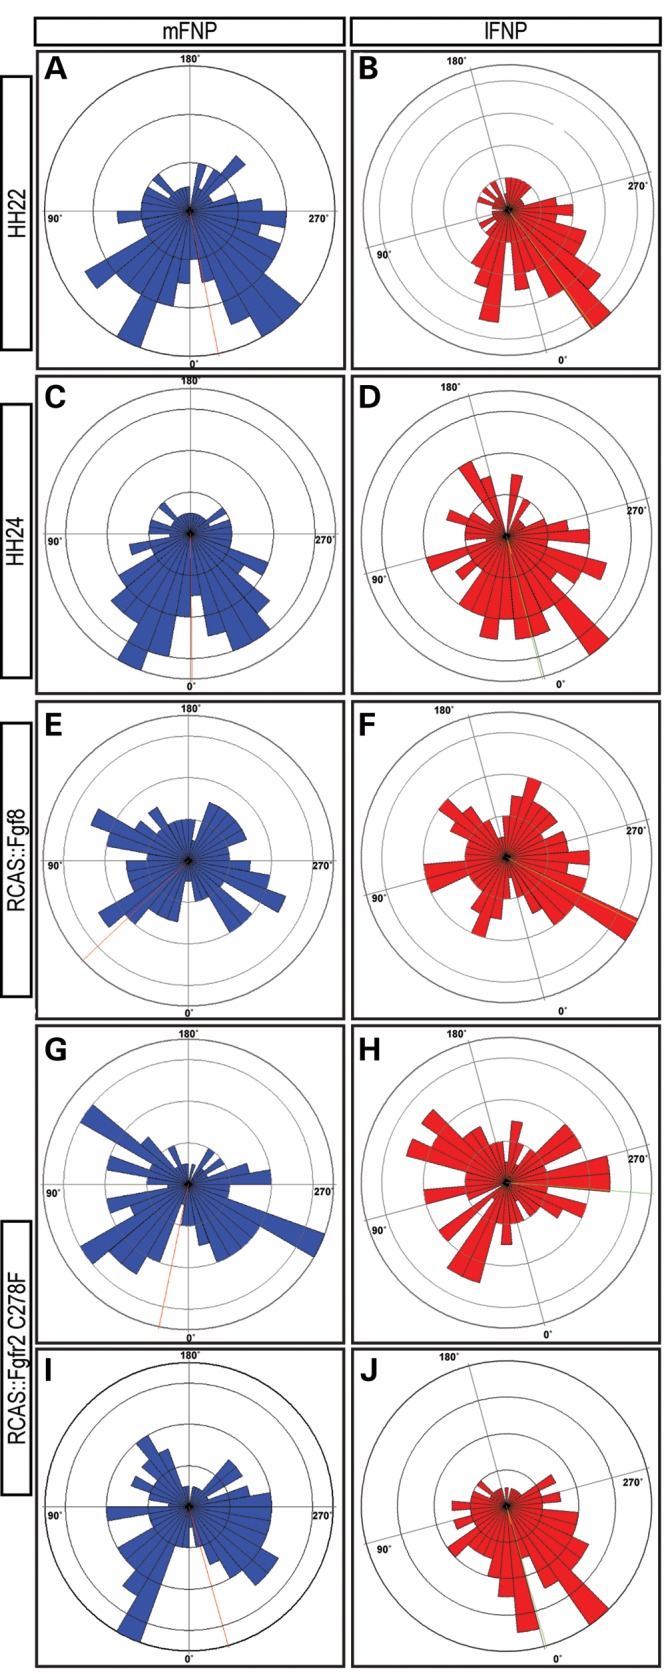
Golgi orientation analysis in embryos. Wind rose diagrams illustrate the Golgi body orientation relative to the reference line (direction of growth). The number of cells aligned in any 10 degree increment is illustrated by the height of the bar occupying that 10 degree segment. The mean orientation of the Golgi relative to the reference line is illustrated by the dotted line, and the magnitude and consistency ratio is shown in Table 1. mFNP = medial part of the FNP, lFNP = lateral part of the FNP. (A and B) Cell orientation at HH22. (C and D) Cell orientation is similar at HH24. (E and F) Cell orientation appears more randomized in embryos infected with RCAS::Fgf8. (G and H) Embryo with a severe phenotype after infection with RCAS::FgfR2C278F shows a randomized distribution of cell orientation. (I and J) In an embryo with a less severe phenotype, the distribution of cell orientation appears less random than in severely affected embryos.
Table 1.
Statistical analysis of Golgi orientation
| HH22 |
HH24 |
Fgf8 |
C278F severe |
C278F mild |
||||||
|---|---|---|---|---|---|---|---|---|---|---|
| mFNP | lFNP | mFNP | lFNP | mFNP | lFNP | mFNP | lFNP | mFNP | lFNP | |
| Vector mean | 348.67 | 348.58 | 359.35 | 0.93 | 46.61 | 325.69 | 11.56 | 289.31 | 353.67 | 359.10 |
| Angular deviation | ±66.66 | ±64.67 | ±63.30 | ±68.41 | ±78.73 | ±78.46 | ±71.58 | ±80.75 | ±72.59 | ±62.99 |
| Magnitude | 249.18 | 164.8 | 221.39 | 85.01 | 29.64 | 38.89 | 30.31 | 0.89 | 85.1 | 124.65 |
| Consistency ratio | 0.3232 | 0.363 | 0.3898 | 0.2872 | 0.0559 | 0.0624 | 0.2197 | 0.007 | 0.1974 | 0.3957 |
The direction of growth is used as the reference line (i.e. 0°; Fig. 4A).
DISCUSSION
Activated FGF signaling has direct effects on the developing facial primordia
Here, we examined the effect of increased FGF signaling on early stages of craniofacial development, using either an Fgf ligand or an Fgf receptor that is constitutively activated, because in addition to premature suture fusion, patients have midfacial malformations, such as midfacial hypoplasia and hypertelorism. These malformations could begin during the earliest stages of facial development when the facial primordia are forming and undergoing the initial stages of growth. The effect that activated FGF receptors have on early development of the midfacial primordia has not been investigated. Direct effects of these mutations during formation and growth of the facial primordia are not surprising, because Fgf ligands and receptors are expressed throughout the facial primordia beginning at the earliest stages of facial development (17). What the overall contributions of these early changes are to the final phenotype are unknown, because the final morphology is built from a series of developmental processes that all contribute to the shape of the skull (59).
Hypoplasia of the FNP may result from decreased cell proliferation in response to activated FGF signaling
One of the most striking features that we observed in embryos infected with either RCAS::Fgf8 or RCAS::FgfR2C278F was the lack of proximodistal extension of the FNP. This midfacial hypoplasia was accompanied by a decrease in cell proliferation of the facial mesenchyme. Together, these outcomes indicate that if the FGF pathway is hyperactivated in the facial mesenchyme, growth of the facial primordia is reduced. Decreased cell proliferation of the palatal mesenchyme has also been observed in mice harboring another gain-of-function mutation FgfR2C342Y/C234Y (41). Additionally, a naturally occurring mutation in chickens leads to persistent expression of Fgf8 across the midline of the FNP during stages of facial outgrowth, and this leads to cleft lip and palate (60).
To examine how increased FGF signaling leads to decreased proliferation, we analyzed the expression of families of proteins that modulate FGF signaling. Signaling through the FGF pathway is complex. Pathway activity in a given cell is the sum of a series of positive and negative feedback loops that are controlled by regulators that interact with different parts of the FGF signaling cascade. Negative regulators of the FGF pathway include Sprtys, Spreds and Dusps, each acts in distinct parts of the FGF signaling cascade (47,51). We observed a large increase in Sprty1 and Sprty2 expression, as well as, Mkp3/Dusp6 expression in the facial mesenchyme of embryos with activated FGF signaling. In addition, we observed decreased levels of dpERK1/2 in these embryos. Taken together, our experimental evidence suggests that ectopic activation of FGF signaling activates expression of Sprtys and Dusps and this leads to inhibition of the ERK/MAPK pathway. Ultimately, the reduction in ERK/MAPK signaling may lead to decreased cell proliferation that contributes to the midfacial hypoplasia in the treated embryos. While we have shown that these changes affect the early stages of facial development, other later-occurring developmental processes such as chondrogenesis, osteogenesis and growth could be similarly affected. The final skull dysmorphology would be the net result of all of these affected processes (35,40,61).
FGF signaling regulates the polarity of neural crest cells
In addition to midfacial hypoplasia, we also observed hypertelorism in embryos after activation of the FGF pathway, and the decreased cell proliferation was unlikely to explain this outcome. Therefore, we examined changes in cell polarity of the mesenchymal cells comprising the faces of these embryos, because directional cell properties are thought to regulate directional growth of the limb bud. There is a plethora of data indicating that FGF signaling regulates various aspects of cell polarity during animal development. First and foremost, FGF signaling may modify WNT signaling to control cell polarity. For example, interactions between the FGF and WNT pathways control collective polarized cell migration during development of mechanosensory neurons in zebrafish (62). Disruption of FGF signaling in sea urchin embryos causes defects in convergence-extension movements during gastrulation (63). Exactly how FGF signals are translated into changes in cell polarization are not known. However, there is good evidence for direct interaction between components of the FGF cascade and the cytoskeleton. For example, ectopic activation of the ERK pathway, due to decreased Spry activity, changes the orientation of the mitotic spindle during branching morphogenesis of the lung (64). Furthermore, ERK signaling regulates positioning of the Golgi in migrating cells (58). The Golgi apparatus is polarized in moving cells and is located between the nucleus and the leading edge of the cell (65,66). The ERK/MAPK pathway is required for Golgi repositioning to the leading edge of migrating cells (58), because it directly phosphorylates proteins in the Golgi that are required for unpacking of the cisternae (67). Additionally, studies in drosophila have suggested the Hedgehog pathway influences cell polarity by regulating expression of key components of the planar cell polarity pathway (68). Here, we observed decreased expression of Shh in the surface ectoderm which could contribute to altered cell polarity via an indirect mechanism such as described in drosophila, but the role of the planar cell polarity pathway during the early stages of facial morphogenesis that we are studying are not known. Nonetheless, while the relative contributions of increased FGF signaling and decreased Shh expression are not known, it is likely that integrated signaling between these two pathways has contributed to the phenotypes we observed. This idea is supported by a recent paper that shows how changes in activation of the SHH pathway at early developmental time points lead to facial dysmorphology by increasing Fgf8 expression (69).
Most studies of cell polarity utilize epithelial cells, which have well-defined apical, basal, and even lateral polarity. However, we wanted to assess mesenchymal cells, so we used the location of the Golgi apparatus as a marker of polarity. In addition to being a good assay for polarization of mesenchymal cells, Golgi localization may also be a direct consequence of FGF signaling via the ERK pathway (58). Therefore, we investigated Golgi orientation in the mesenchymal cells of the FNP. In control embryos, we observed polarization of the Golgi body in individual neural crest cells, and when we examined the entire population of cells we discovered that the cells in the population had a similar Golgi body angle relative to the direction of growth. This suggests that the population of neural crest cells were undergoing a co-ordinated movement in the same direction. However, after activating the FGF pathway the polarization appeared random and growth of the FNP was amorphous.
We next wanted to determine the extent to which alteration in Golgi body positioning could have resulted from alterations to non-canonical WNT signaling that may have been induced by aberrant FGF signaling. We examined expression of Wnt5a and Wnt9b and determined that FGF signaling did not cause a significant alteration in the candidate Wnts that would likely control cell polarity. These observations, combined with decreased expression of dpERK that we observed, and the previously published data described above suggest that FGF signaling is directly responsible for controlling positioning of the Golgi body in neural crest cells, and that this polarity is directly related to facial morphogenesis.
Relationship among cell proliferation, cell polarity and facial morphogenesis
Two major processes have been used to explain morphogenesis: (1) regional differences in cell proliferation and apoptosis and (2) oriented cell behaviors. The limb bud has been extensively used to study these mechanisms of morphogenesis, and much of our understanding of this process has emerged from research on this system. Anisotropic cell proliferation has been the long-standing model used to explain how limb buds undergo patterned outgrowth (70,71). However, recent research has revealed that polarized cell movement, oriented cell division and biased Golgi position contribute to directional outgrowth in the limb bud (5,6,8). Similarly, orientated cell division has been observed and is thought to govern patterned outgrowth of the imaginal discs in drosophila (72), suggesting that directional cellular behaviors may have fundamental and significant roles in many aspects of morphogenesis in multicellular organisms. Importantly, these two models are not mutually exclusive, both processes could be required for morphogenesis.
During facial morphogenesis, there are a series of reciprocal epithelial–mesenchymal signaling interactions that control integrated growth of the various facial primordia. FGF, SHH and WNT signaling play critical roles during facial morphogenesis (10). Studies from our lab, as well as other labs, have demonstrated that SHH and FGF signaling from the ectoderm determines the rate of cell proliferation in the mesenchyme comprising the facial prominences (12,73,74), and regional differences in the location of the zones of mesenchymal cell proliferation are associated with divergent morphologies of the upper jaw anlagen of chick and duck embryos (2). We have also shown that SHH signaling produces morphological variation and differential cell proliferation in the FNP mesenchyme due to changes in Shh expression patterns in the FNP ectoderm (11,45). In these previous studies, we observed morphological changes including changes in size, but we did not analyze directional cell properties that could have influenced the shape of the developing facial primordia.
Here, we observed that altering FGF signaling either by ectopic expression of FGF8 ligand or expression of an FGF receptor mutant that is constitutively active alters polarity of neural crest mesenchyme. We show that the spatial organization of gene expression patterns may contribute to morphogenesis by providing molecular cues that affect cellular properties of populations of cells during morphogenesis. In this case, cell polarity of the facial mesenchyme appears to result in part from a restriction of FGF8 signals to specific regions of the facial ectoderm. In the FNP, when FGF8 is not restricted, or when the FGF pathway is ectopically activated, cell polarity is disrupted and the resulting growth is not directed. Rather, the FNP appears to expand radially leading to a dysmorphic face, and the phenotype of the treated embryos was more variable than controls. From these outcomes, we posit that in addition to regionalized cell proliferation, polarized cell movement also contributes to correct morphogenesis. This may possibly reflect a type of net convergence-extension movement whereby neural crest cells slide between each other and this leads to extension of the primordia in a direction that is perpendicular to the direction of movement. This model is based on recent evidence of a similar mechanism occurring during proximodistal extension of the limb bud (5,6,8).
In summary, craniofacial morphogenesis is a complex process that requires integration of events occurring at the molecular, cellular and tissue level and over multiple developmental time periods. Molecular signals regulate specific cell processes such as proliferation and polarized movement that direct tissue morphogenesis such as initial formation and outgrowth of the facial prominences. This coordinated outgrowth results in fusion of the various primordia that comprise the developing amniote face. Additionally, changes in the localization of the molecular signals lead to alterations in morphogenesis which may be associated with disease or variation that can be selected upon by natural selection.
MATERIALS AND METHODS
Preparation of RCAS viruses
The replication-competent avian sarcoma (RCAS) retrovirus vector was modified to use the GATEWAY cloning system (Invitrogen) and to contain a Cytomegalovirus promoter. The human FgfR2 gene containing a mutation that results in a conversion of amino acid residue 278 from Cys to Phe (33) was then inserted into the modified RCAS vector.
To produce viral particles, DF-1 cells were grown in MEM containing 10% FBS. When cells reached 70–80% confluence, RCAS::Fgf8, RCAS::FgfR2C278F and RCAS::AP plasmids were transfected into DF-1 cells using Lipofectamine 2000 (Invitrogen). Two days later, cells were transferred to T75 flasks (Nunc). After the cells became confluent, the growth media was replaced with MEM containing 1% FBS. Supernatant was collected for 3 days and then viral particles were concentrated by ultracentrifugation (43).
Infection with RCAS virus
Embryos (SPAFAS) were incubated to HH10, then a hole was made in the shell and a solution of neutral red was applied to the vitelline membrane to visualize the embryo. Solutions of polybrene and viral particles (RCAS::FgfRC278F, RCAS::Fgf8, RCAS::AP) were prepared by mixing 10 μl of viral supernatant with 1 μl polybrene (8 μg/ml) and 1 μl of 0.02% Fast Green. This mixture was loaded into a pulled borosilicate glass capillary pipette (OD = 1.0 mm; ID = 0.5 mm; Sutter Instrument, Novato, CA, USA) that was then connected to a KITE-R micromanipulator (World Precision Instruments Sarasota, FL, USA). Injections were carried out using a PV830 Pneumatic Picopump (World Precision Instruments Sarasota). Approximately 100–150 nl of virus-dye solution was injected into the mesenchyme on each side of the forebrain of HH10 embryos (43).
Embryo processing
Viable embryos were removed from the shell and fixed overnight in 4% PFA at 24, 48, 72 and 96 h postinfection. Embryos were washed in PBS, placed in PBS containing 0.01% ethidium bromide and photographed using a Leica MFLZIII dissecting microscope equipped with epifluorescent illumination. After imaging, embryos were dehydrated through graded ethanols and cryoembedded in OCT or cleared and embedded in paraffin. Sections were cut from the blocks (10 mm).
2D morphometrics and PCA
Geometric morphometric analyses of shape were performed as described in (44). Briefly, embryos collected 72 h posttreatment were placed in cold PBS and imaged in frontal view at a consistent magnification (2.0×). Forty-five bilaterally symmetric landmarks were applied to each photo in ImageJ (NIH), and the location and coordinates (x, y) recorded. Raw landmark coordinates were averaged across the axis of symmetry (i.e. left and right sides) and subjected to a Procrustes superimposition to remove the effect of alignment, rotation and scale. These new Procrustes landmark data were regressed against a shape-size trajectory estimated from a normal embryonic series spanning the period in question. The subsequent size-free residuals were used as input for a PCA. All analyses were performed in MorphoJ.
BrdU labeling
72 h postinfection and 20 min prior to collection, 200 nl of BrdU labeling reagent (Invitrogen) was injected into a blood vessel near the heart. Embryos were fixed, embedded and sectioned as described. BrdU-labeled cells were visualized on paraffin sections; detection of BrdU incorporation was assessed by immunohistochemistry following the manufacturer's instructions (Invitrogen). BrdU incorporated cells were counted (Olympus) and the percentage of proliferating cells in the medial portion of the FNP were determined. Analysis of variance (ANOVA) was performed to determine statistical significance (P < 0.05).
Whole mount in situ hybridization
Whole mount in situ hybridization was performed as previously described (11). Subclones of Fgf8, Shh, Wnt5a and Wnt9b (11,75) were linearized for in vitro transcription (Roche) of Digoxigenin-labelled antisense riboprobes. Embryos were dehydrated and rehydrated with a graded series of methanol. Proteinase K (10 ng/ml) digestion is 20–30 min, then embryos were fixed with 4% PFA. Hybridization was performed at 65 degrees overnight. On the second day, non-binding unbound probes were washed away at the same temperature. Embryos were subjected to antibody hybridization with AP-conjugated anti-DIG (1:2000; Jackson Lab). Third day, color development was done in BM-purple (Roche).
RNA extraction, cDNA synthesis and quantitative PCR
The FNP of HH22 embryos was dissected and subjected to 2 mg/ml Dispase digestion on ice for 30 min. Neural-ectoderm and surface ectoderm were separated from the mesenchyme using Tungsten needles. Mesenchyme from individual embryos was used to make mRNA, but for ectoderm, tissues from three embryos were pooled. RNA samples were isolated using RNeasy kit (Qiagen). cDNA synthesis used Invitrogen Superscript III following the manufacturers instructions. qPCR was done using a Bio-Rad CFX96 real-time PCR machine. qPCR primers for specific genes are listed in supplemental information. Relative gene expression was calculated based on the  . ΔCt was calculated between each target gene and GAPDH. At least three biological replicates were prepared for all analyses. Figures are shown in mean ± SEM. Two-way ANOVA and Student's t-test were used for statistical analysis.
Western blot
To isolate protein for western blot analysis, the FNP of HH22 embryos was dissected, and the ectoderm and mesenchyme was separated using Tungsten needles. Mesenchymal cells from eight embryos in each group were pooled and homogenized in 100 ml of RIPA lysis buffer supplemented with Protease and Phosphotase inhibitors (Pierce). The protein concentration was determined using the Bradford assay. Twenty microliters of 6× SDS loading buffer were added to each homogenate and boiled for 5 min. This experiment was repeated three times.
Approximately 5 mg of total protein was loaded onto a 4–15% gradient polyacrylamide gel (Bio-Rad), and proteins were resolved and transferred to a PVDF membrane. After blocking (5% dry milk), the membranes were incubated with antibodies to dpERK1/2; total ERK1/2 (1:1000, Cell Signaling); pPLCγ1 (Invitrogen 1:1000), total PLCγ1 (1:1000, Santa Cruz); pAKT, total AKT (Cell Signaling, 1:1000) and βACTIN (1:1000, Santa Cruz). Detection was done using horseradish peroxidase-conjugated secondary antibodies and enhanced chemiluminescence (Pierce Pico or Dura Kit). The same membrane was used to probe phospho- and total forms of each protein. After detecting the phospho-form, the membrane was stripped using stripping buffer and agitation for 5 min. Then the membrane was washed with TBST and blocked in 5% dry milk for 1 h. The membrane was then re-probed as described above.
Immunohistochemistry and immunofluorescence
Embryos were fixed in 4% paraformaldehyde overnight and embedded in OCT compound (Takara). Blocks were sectioned using a cryostat (Thermo Scientific). Twenty-micron sections were collected, mounted on slides and stored at −20°C until analysis. Before staining, slides were soaked in PBS for 30 min to remove OCT. Then, samples were treated for ∼8 min with TBST/0.2–0.5% Triton X-100 solution. Primary antibodies were GM130 (BDbiosciences, 1:350). Primary antibodies were incubated with sections at 4°C overnight. Secondary antibodies were Rhodamine Red-X anti-mouse (Jackson Immunology, 1:500). Slides were mounted using VectaShield after counterstaining with DAPI (Vectorlab). A Nikon Spectral Confocal Microscope C1 at the UCSF Nikon Imageing Center was used to collect Z-stacks from sections.
Golgi body orientation analysis
The angle that the Golgi body makes to the nucleus and the direction of growth was measured using ImageJ (see diagram in Fig. 4). More than 300 cells in each of at least three individual embryos from each group were analyzed. Rose 2.1.0 (http://mypage.iu.edu./~tthomps/programs/) was used to generate a wind rose diagram to graphically display the distribution of Golgi angles among embryos and was used to determine the mean vector direction and the consistency ratio.
SUPPLEMENTARY MATERIAL
Supplementary Material is available at HMG Online.
Conflict of Interest statement: None declared.
FUNDING
This work was supported by research grants from the National Institutes of Health (R01-DE019638 to R.M. and B.H., R01-DE018234 to R.M., F32DE018596 to N.M.Y.). This work was also supported by the National Center for Research Resources and the National Center for Advancing Translational Sciences, National Institutes of Health, through UCSF-CTSI grant number UL1 RR024131.
Supplementary Material
ACKNOWLEDGEMENTS
We thank all members of the Orthopaedic Trauma Institute Laboratory for Skeletal Regeneration for support throughout this project, and Gina Baldoza for laboratory management. FgfR2C278F was kindly provided by Dr. N. Hatch. The contents of this work are solely the responsibility of the authors and do not necessarily represent the official views of the NIH.
REFERENCES
- 1.Thompson D.W. On Growth and Form-the Complete Revised Edition. New York, USA: Dover Publication, Inc.; 1992. [Google Scholar]
- 2.Wu P., Jiang T.X., Suksaweang S., Widelitz R.B., Chuong C.M. Molecular shaping of the beak. Science. 2004;305:1465–1466. doi: 10.1126/science.1098109. [DOI] [PMC free article] [PubMed] [Google Scholar]
- 3.Zeller R., Lopez-Rios J., Zuniga A. Vertebrate limb bud development: moving towards integrative analysis of organogenesis. Nat. Rev. Genet. 2009;10:845–858. doi: 10.1038/nrg2681. [DOI] [PubMed] [Google Scholar]
- 4.Huycke T.R., Eames B.F., Kimmel C.B. Hedgehog-dependent proliferation drives modular growth during morphogenesis of a dermal bone. Development. 2012;139:2371–2380. doi: 10.1242/dev.079806. [DOI] [PMC free article] [PubMed] [Google Scholar]
- 5.Boehm B., Westerberg H., Lesnicar-Pucko G., Raja S., Rautschka M., Cotterell J., Swoger J., Sharpe J. The role of spatially controlled cell proliferation in limb bud morphogenesis. PLoS Biol. 2010;8:e1000420. doi: 10.1371/journal.pbio.1000420. [DOI] [PMC free article] [PubMed] [Google Scholar]
- 6.Gros J., Hu J.K., Vinegoni C., Feruglio P.F., Weissleder R., Tabin C.J. Wnt5a/Jnk and Fgf/Mapk pathways regulate the cellular events shaping the vertebrate limb bud. Curr. Biol. 2010;20:1993–2002. doi: 10.1016/j.cub.2010.09.063. [DOI] [PMC free article] [PubMed] [Google Scholar]
- 7.Li Y., Dudley A.T. Noncanonical frizzled signaling regulates cell polarity of growth plate chondrocytes. Development. 2009;136:1083–1092. doi: 10.1242/dev.023820. [DOI] [PMC free article] [PubMed] [Google Scholar]
- 8.Wyngaarden L.A., Vogeli K.M., Ciruna B.G., Wells M., Hadjantonakis A.K., Hopyan S. Oriented cell motility and division underlie early limb bud morphogenesis. Development. 2010;137:2551–2558. doi: 10.1242/dev.046987. [DOI] [PMC free article] [PubMed] [Google Scholar]
- 9.Minoux M., Rijli F.M. Molecular mechanisms of cranial neural crest cell migration and patterning in craniofacial development. Development. 2010;137:2605–2621. doi: 10.1242/dev.040048. [DOI] [PubMed] [Google Scholar]
- 10.Szabo-Rogers H.L., Smithers L.E., Yakob W., Liu K.J. New directions in craniofacial morphogenesis. Dev. Biol. 2010;341:84–94. doi: 10.1016/j.ydbio.2009.11.021. [DOI] [PubMed] [Google Scholar]
- 11.Hu D., Marcucio R.S. A Shh-responsive signaling center in the forebrain regulates craniofacial morphogenesis via the facial ectoderm. Development. 2009;136:107–116. doi: 10.1242/dev.026583. [DOI] [PMC free article] [PubMed] [Google Scholar]
- 12.Hu D., Marcucio R.S. Unique organization of the frontonasal ectodermal zone in birds and mammals. Dev. Biol. 2009;325:200–210. doi: 10.1016/j.ydbio.2008.10.026. [DOI] [PMC free article] [PubMed] [Google Scholar]
- 13.Hu D., Marcucio R.S. Neural crest cells pattern the surface cephalic ectoderm during fez formation. Dev. Dyn. 2012;241:732–740. doi: 10.1002/dvdy.23764. [DOI] [PMC free article] [PubMed] [Google Scholar]
- 14.Hu D., Marcucio R.S., Helms J.A. A zone of frontonasal ectoderm regulates patterning and growth in the face. Development. 2003;130:1749–1758. doi: 10.1242/dev.00397. [DOI] [PubMed] [Google Scholar]
- 15.Griffin J.N., Compagnucci C., Hu D., Fish J., Klein O., Marcucio R., Depew M.J. Fgf8 dosage determines midfacial integration and polarity within the nasal and optic capsules. Dev. Biol. 2013;374:185–197. doi: 10.1016/j.ydbio.2012.11.014. [DOI] [PMC free article] [PubMed] [Google Scholar]
- 16.Storm E.E., Garel S., Borello U., Hebert J.M., Martinez S., McConnell S.K., Martin G.R., Rubenstein J.L. Dose-dependent functions of Fgf8 in regulating telencephalic patterning centers. Development. 2006;133:1831–1844. doi: 10.1242/dev.02324. [DOI] [PubMed] [Google Scholar]
- 17.Wilke T.A., Gubbels S., Schwartz J., Richman J.M. Expression of fibroblast growth factor receptors (Fgfr1, Fgfr2, Fgfr3) in the developing head and face. Dev. Dyn. 1997;210:41–52. doi: 10.1002/(SICI)1097-0177(199709)210:1<41::AID-AJA5>3.0.CO;2-1. [DOI] [PubMed] [Google Scholar]
- 18.Britto J.A., Chan J.C., Evans R.D., Hayward R.D., Thorogood P., Jones B.M. Fibroblast growth factor receptors are expressed in craniosynostotic sutures. Plast. Reconstr. Surg. 1998;101:540–543. [PubMed] [Google Scholar]
- 19.Britto J.A., Evans R.D., Hayward R.D., Jones B.M. From genotype to phenotype: the differential expression of Fgf, Fgfr, and Tgfbeta genes characterizes human cranioskeletal development and reflects clinical presentation in Fgfr syndromes. Plast. Reconstr. Surg. 2001;108:2026–2039. doi: 10.1097/00006534-200112000-00030. discussion 2040–2026. [DOI] [PubMed] [Google Scholar]
- 20.Hatch N.E. Fgf signaling in craniofacial biological control and pathological craniofacial development. Crit. Rev. Eukaryot. Gene Expr. 2010;20:295–311. doi: 10.1615/critreveukargeneexpr.v20.i4.20. [DOI] [PubMed] [Google Scholar]
- 21.Johnson D., Wilkie A.O. Craniosynostosis. Eur. J. Hum. Genet. 2011;19:369–376. doi: 10.1038/ejhg.2010.235. [DOI] [PMC free article] [PubMed] [Google Scholar]
- 22.Wilkie A.O. Bad bones, absent smell, selfish testes: the pleiotropic consequences of human Fgf receptor mutations. Cytokine Growth Factor Rev. 2005;16:187–203. doi: 10.1016/j.cytogfr.2005.03.001. [DOI] [PubMed] [Google Scholar]
- 23.Wilkie A.O., Morriss-Kay G.M. Genetics of craniofacial development and malformation. Nat. Rev. Genet. 2001;2:458–468. doi: 10.1038/35076601. [DOI] [PubMed] [Google Scholar]
- 24.Riley B.M., Mansilla M.A., Ma J., Daack-Hirsch S., Maher B.S., Raffensperger L.M., Russo E.T., Vieira A.R., Dode C., Mohammadi M., et al. Impaired Fgf signaling contributes to cleft lip and palate. Proc. Natl Acad. Sci. USA. 2007;104:4512–4517. doi: 10.1073/pnas.0607956104. [DOI] [PMC free article] [PubMed] [Google Scholar]
- 25.Riley B.M., Murray J.C. Sequence evaluation of Fgf and Fgfr gene conserved non-coding elements in non-syndromic cleft lip and palate cases. Am. J. Med. Genet. A., 143A. 2007:3228–3234. doi: 10.1002/ajmg.a.31965. [DOI] [PMC free article] [PubMed] [Google Scholar]
- 26.Lew E.D., Bae J.H., Rohmann E., Wollnik B., Schlessinger J. Structural basis for reduced Fgfr2 activity in Ladd syndrome: implications for Fgfr autoinhibition and activation. Proc. Natl Acad. Sci. USA. 2007;104:19802–19807. doi: 10.1073/pnas.0709905104. [DOI] [PMC free article] [PubMed] [Google Scholar]
- 27.Merrill A.E., Sarukhanov A., Krejci P., Idoni B., Camacho N., Estrada K.D., Lyons K.M., Deixler H., Robinson H., Chitayat D., et al. Bent bone dysplasia-Fgfr2 Type, a distinct skeletal disorder, has deficient canonical Fgf signaling. Am. J. Hum. Genet. 2012;90:550–557. doi: 10.1016/j.ajhg.2012.02.005. [DOI] [PMC free article] [PubMed] [Google Scholar]
- 28.Rohmann E., Brunner H.G., Kayserili H., Uyguner O., Nurnberg G., Lew E.D., Dobbie A., Eswarakumar V.P., Uzumcu A., Ulubil-Emeroglu M., et al. Mutations in different components of Fgf signaling in Ladd syndrome. Nat. Genet. 2006;38:414–417. doi: 10.1038/ng1757. [DOI] [PubMed] [Google Scholar]
- 29.Kan S.H., Elanko N., Johnson D., Cornejo-Roldan L., Cook J., Reich E.W., Tomkins S., Verloes A., Twigg S.R., Rannan-Eliya S., et al. Genomic screening of fibroblast growth-factor receptor 2 reveals a wide spectrum of mutations in patients with syndromic craniosynostosis. Am. J. Hum. Genet. 2002;70:472–486. doi: 10.1086/338758. [DOI] [PMC free article] [PubMed] [Google Scholar]
- 30.Senarath-Yapa K., Chung M.T., McArdle A., Wong V.W., Quarto N., Longaker M.T., Wan D.C. Craniosynostosis: molecular pathways and future pharmacologic therapy. Organogenesis. 2012;8 doi: 10.4161/org.23307. [DOI] [PMC free article] [PubMed] [Google Scholar]
- 31.Lin H., Ruiz-Correa S., Shapiro L.G., Hing A., Cunningham M.L., Speltz M., Sze R. Symbolic shape descriptors for classifying craniosynostosis deformations from skull imaging. Conf. Proc. IEEE Eng. Med. Biol. Soc. 2005;6:6325–6331. doi: 10.1109/IEMBS.2005.1615944. [DOI] [PubMed] [Google Scholar]
- 32.Cunningham M.L., Seto M.L., Ratisoontorn C., Heike C.L., Hing A.V. Syndromic craniosynostosis: from history to hydrogen bonds. Orthod. Craniofac. Res. 2007;10:67–81. doi: 10.1111/j.1601-6343.2007.00389.x. [DOI] [PubMed] [Google Scholar]
- 33.Hatch N.E., Hudson M., Seto M.L., Cunningham M.L., Bothwell M. Intracellular retention, degradation, and signaling of glycosylation-deficient Fgfr2 and craniosynostosis syndrome-associated Fgfr2c278f. J. Biol. Chem. 2006;281:27292–27305. doi: 10.1074/jbc.M600448200. [DOI] [PubMed] [Google Scholar]
- 34.Eswarakumar V.P., Ozcan F., Lew E.D., Bae J.H., Tome F., Booth C.J., Adams D.J., Lax I., Schlessinger J. Attenuation of signaling pathways stimulated by pathologically activated Fgf-receptor 2 mutants prevents craniosynostosis. Proc. Natl Acad. Sci. USA. 2006;103:18603–18608. doi: 10.1073/pnas.0609157103. [DOI] [PMC free article] [PubMed] [Google Scholar]
- 35.Eswarakumar V.P., Schlessinger J. Skeletal overgrowth is mediated by deficiency in a specific isoform of fibroblast growth factor receptor 3. Proc. Natl Acad. Sci. USA. 2007;104:3937–3942. doi: 10.1073/pnas.0700012104. [DOI] [PMC free article] [PubMed] [Google Scholar]
- 36.Goriely A., Lord H., Lim J., Johnson D., Lester T., Firth H.V., Wilkie A.O. Germline and somatic mosaicism for Fgfr2 mutation in the mother of a child with Crouzon syndrome: implications for genetic testing in "paternal age-effect" syndromes. Am. J. Med. Genet. A. 2010;152A:2067–2073. doi: 10.1002/ajmg.a.33513. [DOI] [PMC free article] [PubMed] [Google Scholar]
- 37.Ibrahimi O.A., Eliseenkova A.V., Plotnikov A.N., Yu K., Ornitz D.M., Mohammadi M. Structural basis for fibroblast growth factor receptor 2 activation in Apert syndrome. Proc. Natl Acad. Sci. USA. 2001;98:7182–7187. doi: 10.1073/pnas.121183798. [DOI] [PMC free article] [PubMed] [Google Scholar]
- 38.Krejci P., Prochazkova J., Bryja V., Kozubik A., Wilcox W.R. Molecular pathology of the fibroblast growth factor family. Hum. Mutat. 2009;30:1245–1255. doi: 10.1002/humu.21067. [DOI] [PMC free article] [PubMed] [Google Scholar]
- 39.Wang Y., Sun M., Uhlhorn V.L., Zhou X., Peter I., Martinez-Abadias N., Hill C.A., Percival C.J., Richtsmeier J.T., Huso D.L., et al. Activation of P38 Mapk pathway in the skull abnormalities of Apert syndrome Fgfr2(+P253r) mice. BMC Dev. Biol. 2010;10:22. doi: 10.1186/1471-213X-10-22. [DOI] [PMC free article] [PubMed] [Google Scholar]
- 40.Yu K., Herr A.B., Waksman G., Ornitz D.M. Loss of Fibroblast Growth Factor Receptor 2 Ligand-Binding Specificity in Apert Syndrome. Proc. Natl Acad. Sci. USA. 2000;97:14536–14541. doi: 10.1073/pnas.97.26.14536. [DOI] [PMC free article] [PubMed] [Google Scholar]
- 41.Snyder-Warwick A.K., Perlyn C.A., Pan J., Yu K., Zhang L., Ornitz D.M. Analysis of a gain-of-function Fgfr2 Crouzon mutation provides evidence of loss of function activity in the etiology of cleft palate. Proc. Natl Acad. Sci. USA. 2010;107:2515–2520. doi: 10.1073/pnas.0913985107. [DOI] [PMC free article] [PubMed] [Google Scholar]
- 42.Martinez-Abadias N., Motch S.M., Pankratz T.L., Wang Y., Aldridge K., Jabs E.W., Richtsmeier J.T. Tissue-specific responses to aberrant Fgf signaling in complex head phenotypes. Dev. Dyn. 2013;242:80–94. doi: 10.1002/dvdy.23903. [DOI] [PMC free article] [PubMed] [Google Scholar]
- 43.Foppiano S., Hu D., Marcucio R.S. Signaling by bone morphogenetic proteins directs formation of an ectodermal signaling center that regulates craniofacial development. Dev. Biol. 2007;312:103–114. doi: 10.1016/j.ydbio.2007.09.016. [DOI] [PMC free article] [PubMed] [Google Scholar]
- 44.Chong H.J., Young N.M., Hu D., Jeong J., McMahon A.P., Hallgrimsson B., Marcucio R.S. Signaling by Shh rescues facial defects following blockade in the brain. Dev. Dyn. 2012;241:247–256. doi: 10.1002/dvdy.23726. [DOI] [PMC free article] [PubMed] [Google Scholar]
- 45.Young N.M., Chong H.J., Hu D., Hallgrimsson B., Marcucio R.S. Quantitative analyses link modulation of sonic hedgehog signaling to continuous variation in facial growth and shape. Development. 2010;137:3405–3409. doi: 10.1242/dev.052340. [DOI] [PMC free article] [PubMed] [Google Scholar]
- 46.Heuze Y., Martinez-Abadias N., Stella J.M., Senders C.W., Boyadjiev S.A., Lo L.J., Richtsmeier J.T. Unilateral and bilateral expression of a quantitative trait: asymmetry and symmetry in coronal craniosynostosis. J. Exp. Zool. B Mol. Dev. Evol. 2012;318:109–122. doi: 10.1002/jezb.21449. [DOI] [PMC free article] [PubMed] [Google Scholar]
- 47.Dailey L., Ambrosetti D., Mansukhani A., Basilico C. Mechanisms underlying differential responses to Fgf signaling. Cytokine Growth Factor Rev. 2005;16:233–247. doi: 10.1016/j.cytogfr.2005.01.007. [DOI] [PubMed] [Google Scholar]
- 48.Marcucio R.S., Cordero D.R., Hu D., Helms J.A. Molecular interactions coordinating the development of the forebrain and face. Dev. Biol. 2005;284:48–61. doi: 10.1016/j.ydbio.2005.04.030. [DOI] [PubMed] [Google Scholar]
- 49.Klein O.D., Minowada G., Peterkova R., Kangas A., Yu B.D., Lesot H., Peterka M., Jernvall J., Martin G.R. Sprouty genes control diastema tooth development via bidirectional antagonism of epithelial–mesenchymal Fgf signaling. Dev. Cell. 2006;11:181–190. doi: 10.1016/j.devcel.2006.05.014. [DOI] [PMC free article] [PubMed] [Google Scholar]
- 50.Bae J.H., Lew E.D., Yuzawa S., Tome F., Lax I., Schlessinger J. The selectivity of receptor tyrosine kinase signaling is controlled by a secondary Sh2 domain binding site. Cell. 2009;138:514–524. doi: 10.1016/j.cell.2009.05.028. [DOI] [PMC free article] [PubMed] [Google Scholar]
- 51.Eswarakumar V.P., Lax I., Schlessinger J. Cellular signaling by fibroblast growth factor receptors. Cytokine Growth Factor Rev. 2005;16:139–149. doi: 10.1016/j.cytogfr.2005.01.001. [DOI] [PubMed] [Google Scholar]
- 52.Lemmon M.A., Schlessinger J. Cell signaling by receptor tyrosine kinases. Cell. 2010;141:1117–1134. doi: 10.1016/j.cell.2010.06.011. [DOI] [PMC free article] [PubMed] [Google Scholar]
- 53.Zhang X., Ibrahimi O.A., Olsen S.K., Umemori H., Mohammadi M., Ornitz D.M. Receptor specificity of the fibroblast growth factor family. The complete mammalian Fgf family. J. Biol. Chem. 2006;281:15694–15700. doi: 10.1074/jbc.M601252200. [DOI] [PMC free article] [PubMed] [Google Scholar]
- 54.He F., Chen Y. Wnt signaling in lip and palate development. Front. Oral. Biol. 2012;16:81–90. doi: 10.1159/000337619. [DOI] [PubMed] [Google Scholar]
- 55.Topczewski J., Dale R.M., Sisson B.E. Planar cell polarity signaling in craniofacial development. Organogenesis. 2011;7:255–259. doi: 10.4161/org.7.4.18797. [DOI] [PMC free article] [PubMed] [Google Scholar]
- 56.Geetha-Loganathan P., Nimmagadda S., Antoni L., Fu K., Whiting C.J., Francis-West P., Richman J.M. Expression of Wnt signalling pathway genes during chicken craniofacial development. Dev. Dyn. 2009;238:1150–1165. doi: 10.1002/dvdy.21934. [DOI] [PubMed] [Google Scholar]
- 57.Boehm B., Rautschka M., Quintana L., Raspopovic J., Jan Z., Sharpe J. A landmark-free morphometric staging system for the mouse limb bud. Development. 2011;138:1227–1234. doi: 10.1242/dev.057547. [DOI] [PMC free article] [PubMed] [Google Scholar]
- 58.Bisel B., Wang Y., Wei J.H., Xiang Y., Tang D., Miron-Mendoza M., Yoshimura S., Nakamura N., Seemann J. Erk regulates Golgi and centrosome orientation towards the leading edge through Grasp65. J. Cell Biol. 2008;182:837–843. doi: 10.1083/jcb.200805045. [DOI] [PMC free article] [PubMed] [Google Scholar]
- 59.Hallgrimsson B., Jamniczky H., Young N.M., Rolian C., Parsons T.E., Boughner J.C., Marcucio R.S. Deciphering the palimpsest: studying the relationship between morphological integration and phenotypic covariation. Evol. Biol. 2009;36:355–376. doi: 10.1007/s11692-009-9076-5. [DOI] [PMC free article] [PubMed] [Google Scholar]
- 60.MacDonald M.E., Abbott U.K., Richman J.M. Upper beak truncation in chicken embryos with the cleft primary palate mutation is due to an epithelial defect in the frontonasal mass. Dev. Dyn. 2004;230:335–349. doi: 10.1002/dvdy.20041. [DOI] [PubMed] [Google Scholar]
- 61.Yin L., Du X., Li C., Xu X., Chen Z., Su N., Zhao L., Qi H., Li F., Xue J., et al. A Pro253arg mutation in fibroblast growth factor receptor 2 (Fgfr2) causes skeleton malformation mimicking human Apert syndrome by affecting both chondrogenesis and osteogenesis. Bone. 2008;42:631–643. doi: 10.1016/j.bone.2007.11.019. [DOI] [PubMed] [Google Scholar]
- 62.Aman A., Piotrowski T. Wnt/beta-catenin and Fgf signaling control collective cell migration by restricting chemokine receptor expression. Dev. Cell. 2008;15:749–761. doi: 10.1016/j.devcel.2008.10.002. [DOI] [PubMed] [Google Scholar]
- 63.Shi W., Peyrot S.M., Munro E., Levine M. Fgf3 in the floor plate directs notochord convergent extension in the Ciona tadpole. Development. 2009;136:23–28. doi: 10.1242/dev.029157. [DOI] [PMC free article] [PubMed] [Google Scholar]
- 64.Tang N., Marshall W.F., McMahon M., Metzger R.J., Martin G.R. Control of mitotic spindle angle by the Ras-regulated Erk1/2 pathway determines lung tube shape. Science. 2011;333:342–345. doi: 10.1126/science.1204831. [DOI] [PMC free article] [PubMed] [Google Scholar]
- 65.Yadav S., Linstedt A.D. Golgi positioning. Cold Spring Harb. Perspect. Biol. 2011;3 doi: 10.1101/cshperspect.a005322. [DOI] [PMC free article] [PubMed] [Google Scholar]
- 66.Yadav S., Puri S., Linstedt A.D. A Primary Role for Golgi Positioning in Directed Secretion, Cell Polarity, and Wound Healing. Mol. Biol. Cell. 2009;20:1728–1736. doi: 10.1091/mbc.E08-10-1077. [DOI] [PMC free article] [PubMed] [Google Scholar]
- 67.Wei J.H., Seemann J. Remodeling of the Golgi structure by Erk signaling. Commun. Integr. Biol. 2009;2:35–36. doi: 10.4161/cib.2.1.7421. [DOI] [PMC free article] [PubMed] [Google Scholar]
- 68.Lawrence P.A., Struhl G., Casal J. Planar cell polarity: one or two pathways? Nat. Rev. Genet. 2007;8:555–563. doi: 10.1038/nrg2125. [DOI] [PMC free article] [PubMed] [Google Scholar]
- 69.Tabler J.M., Barrell W.B., Szabo-Rogers H.L., Healy C., Yeung Y., Perdiguero E.G., Schulz C., Yannakoudakis B.Z., Mesbahi A., Wlodarczyk B., et al. Fuz mutant mice reveal shared mechanisms between ciliopathies and Fgf-related syndromes. Dev. Cell. 2013;25:623–635. doi: 10.1016/j.devcel.2013.05.021. [DOI] [PMC free article] [PubMed] [Google Scholar]
- 70.Ede D.A., Flint O.P., Teague P. Cell proliferation in the developing wing-bud of normal and Talpid3 mutant chick embryos. J. Embryol. Exp. Morphol. 1975;34:589–607. [PubMed] [Google Scholar]
- 71.Fernandez-Teran M.A., Hinchliffe J.R., Ros M.A. Birth and death of cells in limb development: a mapping study. Dev. Dyn. 2006;235:2521–2537. doi: 10.1002/dvdy.20916. [DOI] [PubMed] [Google Scholar]
- 72.Li W., Kale A., Baker N.E. Oriented cell division as a response to cell death and cell competition. Curr. Biol. 2009;19:1821–1826. doi: 10.1016/j.cub.2009.09.023. [DOI] [PMC free article] [PubMed] [Google Scholar]
- 73.Hu D., Marcucio R.S. Assessing signaling properties of ectodermal epithelia during craniofacial development. J. Vis. Exp. 2011 doi: 10.3791/2557. doi:10.3791/2557. [DOI] [PMC free article] [PubMed] [Google Scholar]
- 74.Szabo-Rogers H.L., Geetha-Loganathan P., Nimmagadda S., Fu K.K., Richman J.M. Fgf signals from the nasal pit are necessary for normal facial morphogenesis. Dev. Biol. 2008;318:289–302. doi: 10.1016/j.ydbio.2008.03.027. [DOI] [PubMed] [Google Scholar]
- 75.Handrigan G.R., Richman J.M. A Network of Wnt, hedgehog and Bmp signaling pathways regulates tooth replacement in snakes. Dev. Biol. 2010;348:130–141. doi: 10.1016/j.ydbio.2010.09.003. [DOI] [PubMed] [Google Scholar]
Associated Data
This section collects any data citations, data availability statements, or supplementary materials included in this article.