Abstract
Metabolism and mitochondrial dysfunction are known to be involved in many different disease states. We have employed two-photon fluorescence imaging of intrinsic mitochondrial reduced nicotinamide adenine dinucleotide (NADH) to quantify the metabolic state of several cultured cell lines, multicell tumor spheroids, and the intact mouse organ of Corti. Historically, fluorescence intensity has commonly been used as an indicator of the NADH concentration in cells and tissues. More recently, fluorescence lifetime imaging (FLIM) has revealed that changes in metabolism produce not only changes in fluorescence intensity, but also significant changes in the lifetimes and concentrations of free and enzyme-bound pools of NADH. Since NADH binding changes with metabolic state, this approach presents a new opportunity to track the cellular metabolic state.
Keywords: Fluorescence, NADH, multiphoton microscopy, lifetime imaging
1. Introduction
The ability to match energy production with demand is a fundamental determinant of the health of individual cells, tissues, and organs of the body. This principle applies quite broadly to many disease states. In the diabetic heart, for example, impaired metabolism is thought to have a causative role in cardiomyopathy (Belke et al. 2000). In fact, obesity, at epidemic levels in the developed world, is also known to result in changes in cardiac energy metabolism. While the relationship is not well understood, it is thought that obesity-related cardiac dysfunction may be circumvented by optimizing cardiac energy metabolism (Lopaschuk et al. 2007). In the growth and progression of cancer, changes in energy metabolism are equally essential. And in the treatment of cancer, cells beyond the range of diffusional supply of nutrients may become quiescent, evading targeting by chemotherapeutic drugs. One recent commentary warns that, while there has been significant recent advances in the understanding of the genetic and proteomic basis of disease, “genetic transformations and proteomic alterations will have little relevancy to disease processes if [they] are not manifested in altered and impaired cellular and metabolic function” (Costello and Franklin, 2006). Considering the central importance of mitochondria for energy production in the healthy cell, it is no surprise that disease states of mitochondria leading to reduced capacity for energy production have been associated with aging and a wide array of age-related diseases (Wallace, 2005).
To quantify the cellular and tissue metabolic state, non-invasive optical techniques have been developed and deployed since the pioneering studies of Chance and colleagues in the 1950s (Chance and Baltscheffsky, 1958; Chance et al., 1973; Chance and Lieberman, 1978). Many of these techniques have employed fluorescence emission from the reduced form of nicotinamide adenine dinucleotide (NADH), the primary electron donor to the respiratory chain. While NADH is fluorescent, its oxidized counterpart, NAD+ is not. Under high metabolic demand, increased respiration rates generally lead to a decrease in the ratio NADH/NAD+, and a reduced NADH fluorescence. But when oxygen supply is limited, for example in cardiac or cerebral ischemia, respiration is reduced and NADH fluorescence increases. Hence, the intensity of NADH fluorescence has been extensively used to monitor cellular respiration. To appreciate the widespread use of these techniques, a recent review reports that more than 1000 papers have been published on the use of NADH as a marker for mitochondrial function (Mayevsky and Rogatsky, 2007).
With the advent and success of multiphoton microscopy, two-photon imaging of NADH has been used to monitor the metabolic state of individual cells of the heart (An et al., 2005; Blinova et al., 2004; Huang et al., 2002; Romashko et al., 1998), cornea (Piston et al., 1995), pancreas (Rocheleau et al., 2004), and brain (Kasischke et al., 2004; Vishwasrao et al., 2005; Levene et al., 2004). NADH can be efficiently two-photon excited from 710 – 780 nm to produce the same blue NADH fluorescence emission resulting from UV excitation, while oxidized flavoprotein (Fp) can be excited from 700 – 900 nm producing fluorescence with a peak near 530 nm. The advantages of the multiphoton excitation strategy include 1) the use of less-toxic near infrared light to excite UV absorbing molecules such as NADH, 2) the inherent confinement of the excitation volume due to its non-linear dependence on laser intensity, and 3) an improved signal-to-noise and spatial resolution for deeper imaging within multiply scattering tissue (Zipfel et al., 2003).
Lifetime imaging of NADH was first performed byLakowicz et al. (1992), who were able to clearly distinguish the enzyme-bound form of NADH from free NADH in solution by its longer fluorescence lifetime. A more recent example is the work byBird et al. (2005), who measured fluorescence lifetimes of approximately 0.4 ns and 2.0 ns for rapidly proliferating breast cancer cells in monolayer culture. These lifetimes are consistent with the free and enzyme-bound forms, respectively, of NADH in solution. They made the interesting observation that both the fluorescence lifetimes and the ratio of bound to free components decreased as cellular proliferation decreased. These results suggest that fluorescence lifetime analysis of the free and bound components might be used in place of the NADH fluorescence intensity for the determination of cellular metabolic state.
Similar results have been reported for isolated mitochondria and in in vitro brain slices (Vishwasrao et al., 2005; Blinova et al., 2005). Using time-resolved fluorescence anisotropy, Vishwasrao et al. observed not just one but several enzyme bound pools of NADH. Their work demonstrated that the progression from normoxia to anoxia results not only in an increase in the NADH/NAD+ ratio, as would be expected with the cessation of mitochondrial respiration, but also in rearrangement of the enzyme-bound pools of NADH. Since the average fluorescence intensity is determined by the product of the concentration and the fluorescence lifetime for each conformational state of the fluorophore, changes in conformational state would also lead to a change in intensity for constant NADH concentration. This work is significant because it calls into question the implicit assumption of intensity-based metabolic imaging techniques, namely that fluorescence intensity is a valid surrogate for the NADH/NAD+ ratio. Taken together, these recent studies suggest that the fluorescence lifetime-based imaging technique may be a more reliable and insightful indicator of cellular metabolism than intensity-based techniques.
We have previously employed two-photon excited fluorescence intensity-based metabolic imaging techniques in monolayer cultures (Indig et al., 2000; Nichols et al., 2005; Tiede and Nichols, 2006), multicell tumor spheroids (Nichols and Webb, 1998), and the organ of Corti of intact but excised murine cochlea (Tiede et al., 2007). Our goal has been to develop and evaluate techniques for non-invasively measuring cellular metabolism so we can better study, understand and ultimately foster the development of better treatments for a wide range of diseases. Of particular interest is the assessment of the metabolic state of the neurosensory cells of the cochlea, as it relates to age- and drug-induced hearing loss, but this will be the subject of a future manuscript.
Here, we compare and contrast intensity- and FLIM-based metabolic imaging of NADH in several cultured cell lines. The techniques that we demonstrate here are equally applicable to primary cell culture, but the simplicity of cultured cell lines allows for a straightforward interpretation of the changes in the lifetime and concentration of NADH as the metabolic state is systematically varied with metabolic inhibitors, uncouplers and as metabolism is modulated by substrate availability.
2. Materials and Methods
2.1 Cell Culture
Rat basophilic leukemia (RBL) cells were propagated in α-MEM medium supplemented with 10% Fetal Bovine Serum (FBS), 5000 units/ml penicillin-streptomycin (Invitrogen, Carlsbad, CA), and incubated at 37°C and 5% CO2. EMT6 mammary adenocarcinoma cells were propagated in the same way, but with 5% FBS. Two to three days before the experiment, the cells were plated on 22 × 40 mm coverslips. On the day of the experiment, the coverslips were washed and placed in a closed imaging chamber with a modified Tyrodes solution (135-mM NaCl, 5-mM KCl, 1-mM MgCl2•6H2O, 1.8-mM CaCl2•2H2O, and 20-mM HEPES, supplemented with 5-mM glucose and 0.5% bovine serum albumen). The imaging chamber was sufficiently large (2 ml) that oxygen depletion during the course of the experiment was insignificant.
2.2 Microscopy
Fluorescence intensity and lifetime imaging of two-photon excited NADH was performed using the 740-nm mode-locked pulse train of a Coherent Chameleon Ultra Ti:S laser and the Zeiss LSM 510 NLO META multiphoton microscope at the Creighton University Integrated Biological Imaging Facility (CU-IBIF). The intrinsic fluorescence associated with NADH in the wavelength range of 420–500 nm was generated at the focus of a 40x oil immersion objective (NA 1.3) for monolayer cell culture. The NADH fluorescence was isolated using a 500-nm long pass dichroic mirror and a bandpass filter (HQ 460/80, Chroma Technology, Bellows Falls, VT) and detected with either a Hamamatsu R6357 PMT for fluorescence-intensity imaging or a Hamamatsu H7422p-40 photon-counting PMT and a time-correlated single photon counting module (830 SPC, Becker and Hickl, Berlin, Germany) for FLIM.
Imaging of cells in monolayer culture was performed by selecting a single imaging plane approximately 3–4 micrometers above the coverslip using reduced laser power (approximately 7.5 mW at the sample) to prevent photobleaching before image acquisition. Once the focal plane was determined, the laser power was increased to 12 mW and two successive images of a single field of view were averaged to form the fluorescence intensity image. Fluorescence lifetime imaging was conducted at the same laser power but with a 90 s total exposure to collect sufficient photons per pixel for FLIM analysis. Images acquired prior to and following FLIM imaging indicated that photobleaching resulting from the fluorescence lifetime imaging was not significant.
2.3 NADH calibration measurements
Calibration measurements were made with NADH dissolved at concentrations ranging from 250 µM to 1.0 mM in aqueous buffer (either Phosphate Buffered Saline (PBS) or modified Tyrodes buffer). Calibration solutions were imaged following the same imaging protocols as were used for cell and organ culture. In addition, solutions containing the enzyme lactate dehydrogenase and NADH at mole ratios ranging from 1 to 16 were prepared and imaged following the same imaging protocol to assess how well total NADH concentration can be measured by FLIM with varying degrees of enzyme binding.
2.4 Fluorescence Intensity Analysis
To quantify cellular metabolic state, cells were first imaged in a modified Tyrodes imaging buffer (5 mM glucose). Maximally reduced NADH was achieved by inhibiting mitochondrial respiration with sodium cyanide (NaCN, 10 µM for 15 min). Maximally oxidized NADH was achieved by uncoupling the mitochondria (10 µM Carbonyl cyanide 4-(trifluoromethoxy)phenylhydrazone (FCCP) for 15 min). The normal metabolic state was quantified in terms of the percent reduction of NADH using Equation 1,
| (1) |
where the subscripts n, i and u, refer to measurements made of normal, cyanide-inhibited, or FCCP-uncoupled cells, and NADH fluorescence served as a surrogate for the NADH concentration.
2.5 FLIM Analysis
It is often the case that fluorophores contributing to pixel intensity may be distributed in multiple environments (including both bound and free states), and therefore a single pixel may in fact represent several lifetimes. In fact, much of the literature concerning analysis of fluorescence lifetime images has used a double exponential fit (Bird et al., 2005; Skala et al., 2007b; Skala et al., 2007a). SPC Image (Becker and Hickl) software was used to fit the fluorescence signal of each pixel to both a single- and a double-exponential decay according to the following equations:
| (2) |
| (3) |
where x and y are the pixel coordinates, A is the amplitude, and τ is the lifetime. Then an F-test was performed to determine if the additional fitting parameters of Equation 3 were justified,
| (4) |
where ν is the number of degrees of freedom in the fit, χν2(x,y) is the reduced goodness of fit parameter, and the subscripts 1, and 2 specify the number of exponentials used in the fit (Bevington and Robinson, 2002). When justified, both best fit amplitudes and lifetimes were used, otherwise the results from the single-exponential fit were used. The average lifetime for each pixel with double exponential fits can then be calculated using the formula
| (5) |
where R is the fraction of the fluorescence due to the long-lived component, τ2,
| (6) |
The relative concentration of NADH associated with a given lifetime pool is directly related to the fluorescence decay coefficients. For a single fluorophore of concentration Ci with intrinsic fluorescence decay rate of kf and a two-photon excitation cross section of σ(2), the decay coefficient is given by
| (7) |
where φ is the detection efficiency, <I(t)2> is the time-averaged square of the laser intensity at focus, and V is the excitation volume. Here we assume that NADH is the only fluorophore contributing to the signal, and that the detection efficiency and cross-section do not vary significantly for bound and free NADH (as shown byKasischke et al. (2004). Since the intrinsic fluorescence decay rate also does not vary with the local environment, the relative concentration of fluorophore associated with a lifetime of τi is given by
| (8) |
where Ctot is the total NADH concentration for the pixel.
Histograms were made of these relative concentrations of NADH for all pixels in each image. These lifetime histograms were fit with a series of Gaussian functions appropriate to the number of peaks necessary to obtain the best fit. The location of the peak of each Gaussian was used to determine the mean lifetime for a given pool of NADH. Experiments were replicated between 6– 12 times to determine the mean lifetime and the standard error of the mean for each pool.
3. Results
3.1 Metabolic imaging of rat basophilic eukemia cells
Figure 1 shows an example of the FLIM analysis process for one image of a field of cyanide-inhibited RBL cells. The fluorescence intensity image (Fig. 1A) shows the characteristic NADH fluorescence typical of a punctate mitochondrial distribution with low intensities of NADH present in the nucleus and cytoplasm. Every pixel in the FLIM dataset was fit to both a single (Fig. 1B) and a double (Fig. 1C) exponential decay. The Chi-squared statistic was used to determine which fit should be used in the subsequent data analysis. Short lifetime (Fig. 1D) and long lifetime (Fig. 1E) images were compiled via the FLIM analysis described in section 2.5. FLIM analysis revealed a relatively uniform short lifetime distribution throughout the cell with a more punctate long lifetime distribution. Lifetimes tended to be slightly shorter in the nucleus than in the cytoplasm, but not nearly enough to account for the decreased intensity of nuclear signals. With the data provided by the fluorescence intensity image (Fig. 1A), the lifetime maps (Fig. 1D and E), and the amplitudes of the decays (not shown), equation 8 was used to calculate the relative concentration of NADH associated with short- and long-lifetimes. The result of this calculation is shown in Figures 1F and G, respectively. While the NADH concentration maps appeared to be similar to the original intensity image, the observed intensity is a combination of the actual concentration and the lifetime of NADH, both of which can vary according to the local environment. By analyzing the data in this way, quantitatively accurate relative concentrations of NADH can be measured with high spatial resolution. Figures 1F and 1G have been scaled to have approximately the same dynamic range so the concentration distributions can be readily compared despite the fact that the short lifetime component has a significantly greater concentration. A close inspection reveals subtle differences in the concentration distribution of the short- and long lifetime components, reflecting different environments within the cell.
Figure 1.
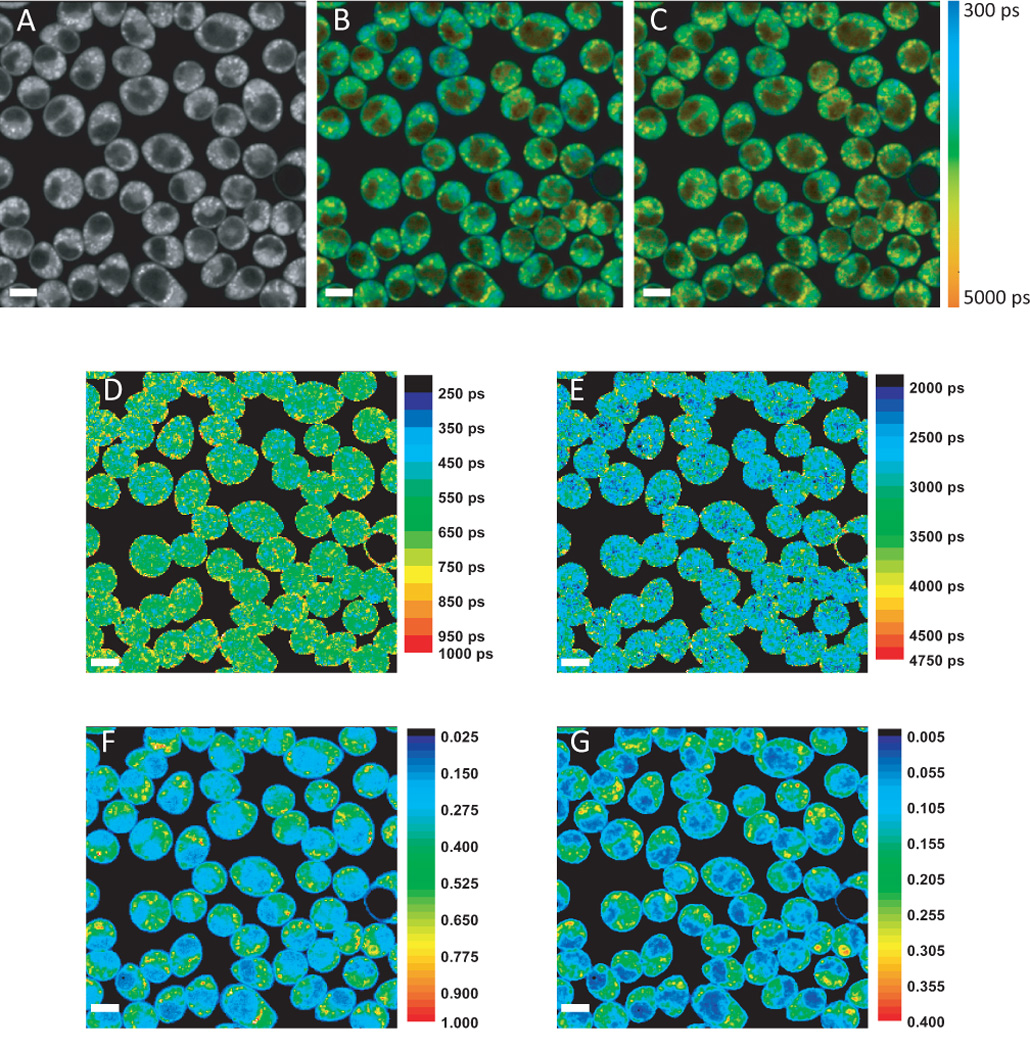
Metabolic FLIM analysis procedure to characterize intracellular NADH pools in cyanide-inhibited Rat Basophilic Leukemia cells.. A) NADH fluorescence intensity B) Intensity-weighted lifetime image with each pixel fit to a single-exponential decay (Eq. 2). C) Intensity-weighted effective lifetime image with each pixel fit by a double-exponential decay (Eq. 3). The pseuodocolor scale for A) and B) is shown at right. D) Short and E) long lifetime image maps (scale bar lifetimes in ps) and relative NADH concentrations associated with the short and long lifetime components as calculated by Eq. 8.
To better characterize the subcellular pools of NADH, the concentration associated with a given NADH lifetime at every pixel was plotted in histogram (Figure 2) from metabolic images obtained from normal culture, metabolically inhibited, and uncoupled RBL cells. Consistent with Figure 1, the histograms were divided into short- and long-lifetime components, with the peak concentration of the short- significantly greater than the long-lifetime component. Subpopulations within each of these components were identified by fitting to a sum of Gaussians. Unique NADH pools were then assigned an average lifetime determined by the mean of the Gaussian distribution. The observed average lifetimes fell into consistent, statistically significant, groupings of four to five lifetimes per treatment condition, ranging from 250 ps to 4200 ps.
Figure 2.
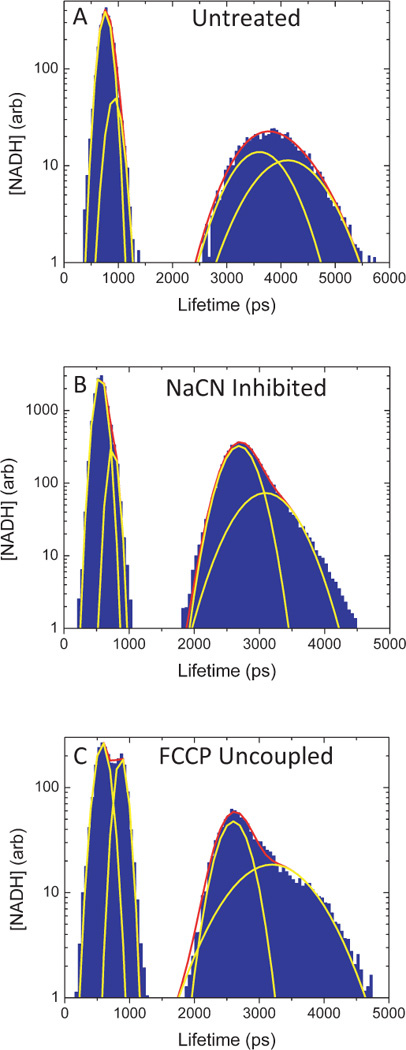
NADH lifetime pixel histograms change with change in metabolic state. Sample FLIM analysis of RBL leukemia cells that was performed on A) normal, untreated cells, and metabolically B) inhibited, and C) uncoupled cells. Thin yellow lines show individual, Gaussian fits to the histogramed data, while the thick red line shows the sum of the individual fits. As shown in this figure, four Gaussians were sufficient to fit most datasets.
The lifetime results are summarized in Figure 3. A total of eight unique lifetimes regularly appeared in our analysis of several thousand cells, but the most consistent lifetimes occurred at 550 ps, 700 ps, 2600 ps, and 3200 ps (Fig. 3A). The smallest lifetime (250 ps) and longest lifetime (4200 ps) were only infrequently detected and were not statistically significant. About 80% of the NADH pool in untreated cells had a lifetime shorter than 750 ps and likely represented free NADH distributed throughout the cell (Fig. 3B), though this would need to be confirmed by measurements of fluorescence anisotropy. This population increased when respiration was inhibited, and decreased when respiration was uncoupled. We also observed some significant shifts in the lifetimes of pools 3 (p3, green) and 7 (p7, yellow) as cellular metabolism was manipulated. The total concentration of NADH between all pools increased two-fold with NaCN treatment, but there was no significant change in total [NADH] with FCCP treatment (Fig. 3C).
Figure 3.
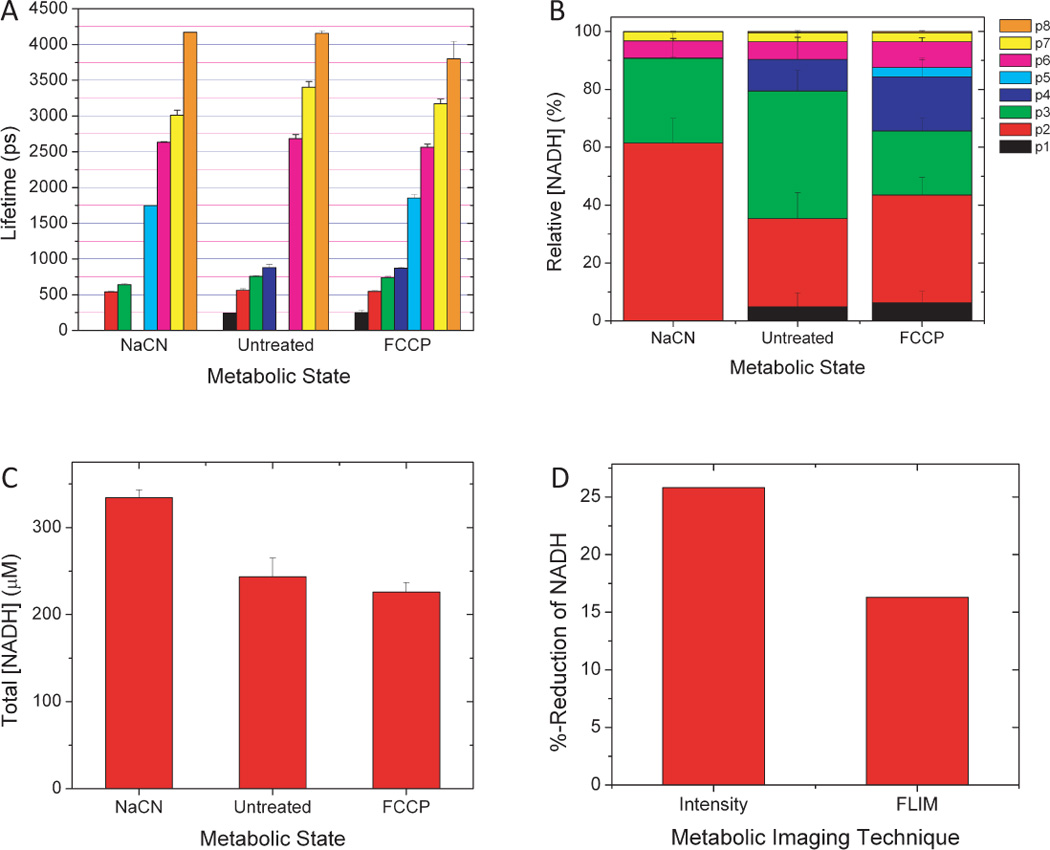
NADH lifetimes (A), subpopulation concentration distributions (B), and total concentration (C) vary with metabolic state in RBL cells. Because NADH pool concentrations shift with metabolic state, the percent reduction of NADH is significantly overestimated by intensity imaging alone (D).
Quantitative NADH fluorescence intensity measurements rely on the assumption that the lifetime, or quantum yield, does not change with metabolic state. Only when this assumption is true will the fluorescence intensity be a reliable surrogate for the NADH concentration. Here we see that this is clearly not the case. Figure 3D reveals that the measurement of the percent reduction of NADH using intensity alone (Eq. 1) is overestimated due to the change in fluorescence lifetime.
The trends observed in the RBL cell line seem to be generally true of both cultured cells and primary culture. We have seen similar trends in other monolayer cell cultures, such as the EMT6 adenocarcinoma cell line and a 2T3 osteoblast-like cell line, EMT6 multicell tumor spheroids, cultured inner and outer hair cells from murine organ of corti explants, as well as excised and intact hair cells.
3.2 Metabolic imaging of EMT6 cells with varying glucose concentration
We conducted similar experiments in the EMT6 adenocarcinoma cell line to compare intensity- and FLIM-based metabolic imaging when cellular metabolism was modified by substrate availability. In these experiments, adjusting the extracellular glucose concentration produced a measureable change in oxygen consumption (data not shown) so we suspected that NADH fluorescence and lifetimes would also be sensitive to the local glucose concentration. First, we compared EMT6 cells to RBL cells in the same Tryodes imaging buffer with 5 mM glucose and we found a similar distribution of lifetimes: A series of short lifetime ranging from 500 – 900 ps comprised 90% of the total NADH concentration, with smaller, yet consistently observed, long lifetime pools at approximately 1200 ps, 3100 ps and 3700 ps (Fig. 4 A). Addition of FCCP once again revealed a sub 500 ps lifetime that was not present in the untreated cells and the shortest average NADH lifetimes occurred when the cells were either uncoupled or glucose starved. Addition of glucose resulted in a systematic decrease in NADH fluorescence lifetimes but an increased concentration of the longer-lifetime components relative to the short-lifetime components (Fig. 4 A,B). At the same time, the NADH fluorescence intensity increased significantly with the addition of glucose, with 50 mM glucose producing a 46% increase in fluorescence intensity compared to cells imaged in just 5 mM glucose. Using both intensity and FLIM data, the concentration of NADH actually decreased with the addition of glucose. The fluorescence intensity increase was due to the reorganization of the NADH pools rather than an increased net quantity of NADH. As this example illustrates, FLIM reveals dynamic changes in the subcellular distribution of NADH that cannot be obtained by fluorescence intensity alone.
Figure 4.
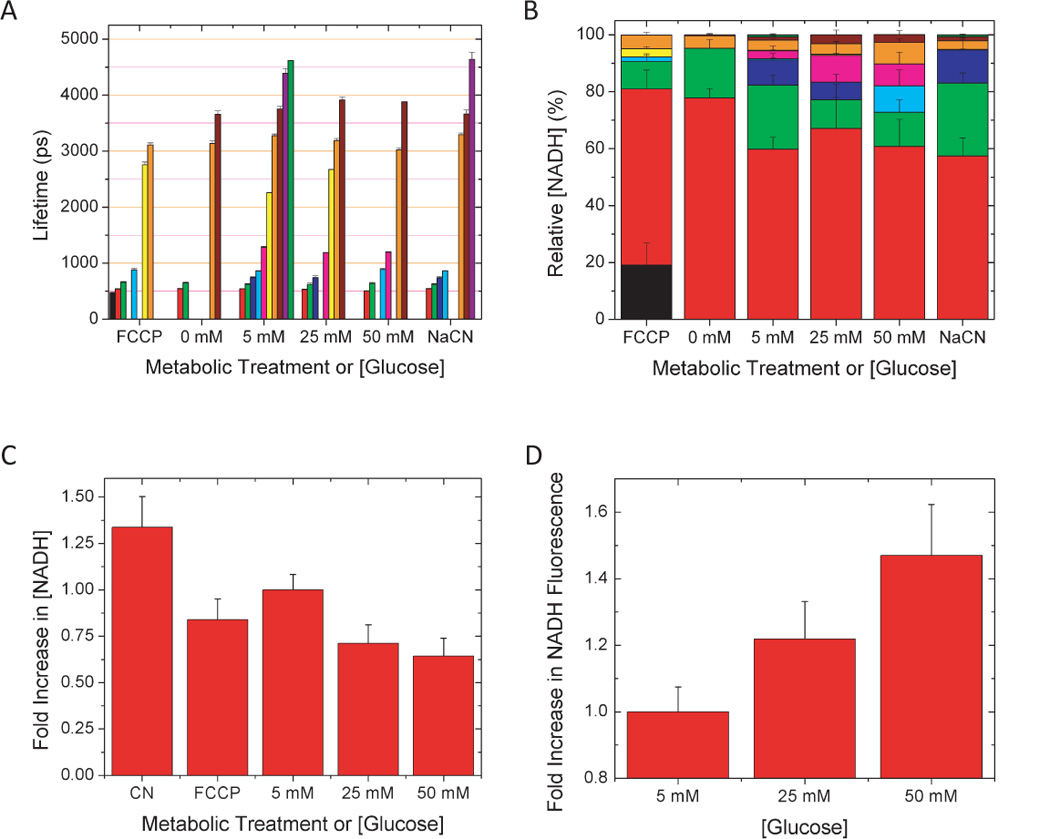
NADH lifetimes (A) and subpopulation concentrations (B) vary with glucose concentration in adherent EMT6 Adenocarcinoma cells. While NADH fluorescence increased significantly (D), NADH concentration tends to decrease with increasing glucose concentration (C), indicating that the brightness increase was due to a change in the quantum yield of NADH.
3.3 Solution Measurements of Free and Enzyme-Bound NADH
To better understand the significance of the fluorescence lifetime components revealed in monolayer cell culture, we imaged well-characterized solutions of free and protein bound NADH using the same analysis procedure. NADH in Tyrodes buffer has two characteristic lifetimes, a short decay of 390 ± 20 ps and a longer decay of 1140 ±60 ps (Fig. 5A). Approximately 95% of the total NADH concentration was associated with the short lifetime while 5% was associated with the longer (Fig. 5B). These lifetimes are independent of the concentration of NADH. Increasing NADH concentration in the solution produced a linear increase in the NADH concentration as measured by the FLIM analysis, as expected (Fig. 5C). The fact that there are two lifetimes reveals that there are two distinct environments for the nicotinamide fluorophore. PreviouslyScott et al. (1970) and, more recently, Lackowicz et al. (1992) have assigned the shorter lifetime to a stacked conformation of NADH in which the adenine ring was able to quench the nearby nicotinamide ring (Fig. 5D). This exquisite sensitivity to local environment was also seen when NADH is bound to specific enzymes such as lactate dehydrogenase (LDH). Lactate dehydrogenase is a tetrameric molecule with four identical NADH binding sites. When NADH and LDH were combined in equal mole ratios, NADH fluorescence lifetimes of approximately 900 ps (80% of total), 1450 ps (11% of total) and 2500 ps (8% of total) are observed (Fig. 6). These are quite distinct compared to the lifetimes of free NADH in solution. Increasing the mole fraction caused a systematic increase in the lifetime and the relative concentration of the shortest lifetime component and a concomitant increase in the middle lifetime component. The long lifetime component had the greatest change in lifetime, but the fraction of the total concentration associated with this component was independent of the NADH/LDH ratio. There was no evidence of any appreciable free NADH, identified by a ~400 ps lifetime, until a mole ratio of 16 was established. While these were all solution measurements, they were obtained using the same imaging protocol that was used with cell culture. These results are similar to the results of Yu and Heikal (2009), who made single-point measurements of solutions of NADH and LDH in PBS. In those high-temporal-resolution measurements, Yu et al. were able to fit to a three-exponential decay and quantified a significant sub-400 ps component with a fluorescence lifetime that decreased systematically as the NADH/LDH ratio was increased. We have not yet observed this component in our imaging studies.
Figure 5.
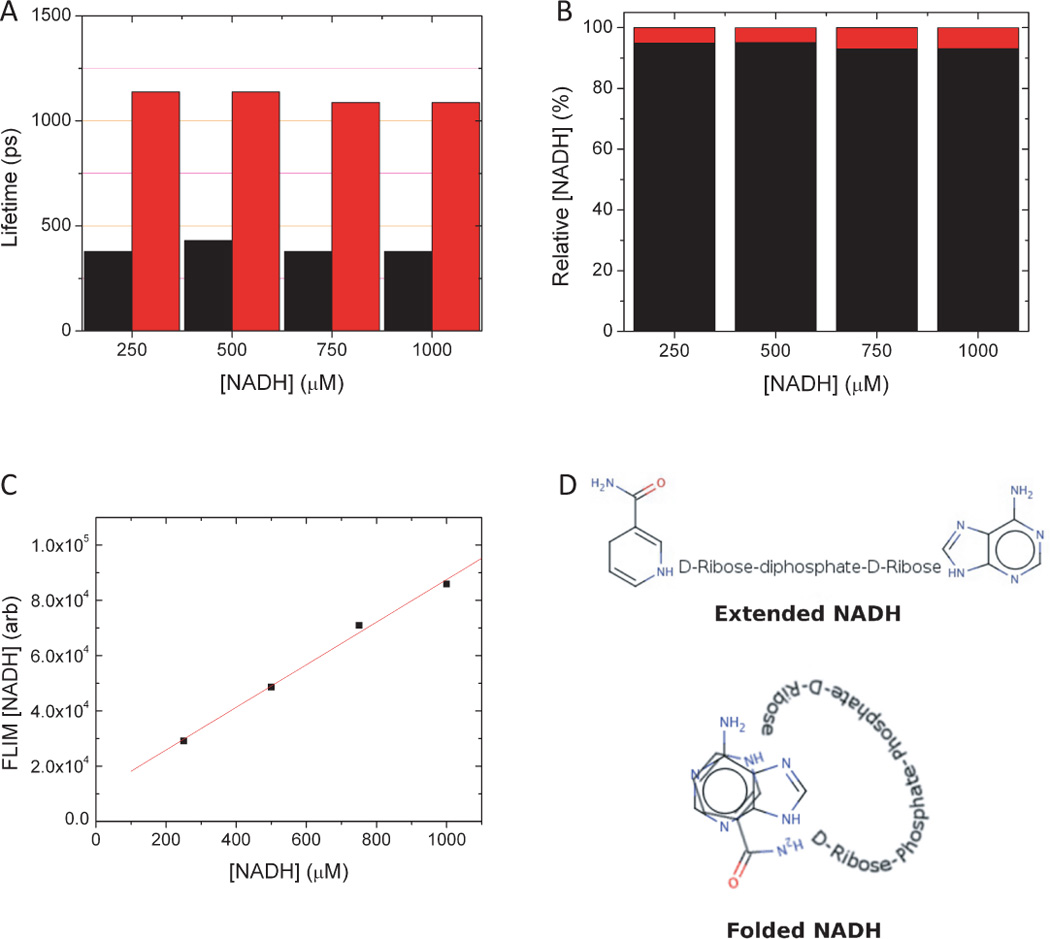
A) Free NADH in solution is characterized by fluorescence decay times of 390 +/− 20 ps and 1140 +/− 60 ps. (B) Approximately 95% of the total NADH concentration has the shorter lifetime. (C) These characteristics are independent of the NADH concentration. (D) FLIM analysis shows a linear increase in concentration, as expected. These results can be understood by considering that free NADH in solution can fluctuate between an extended and a folded conformation (afterScott et al. (1970).
Figure 6.
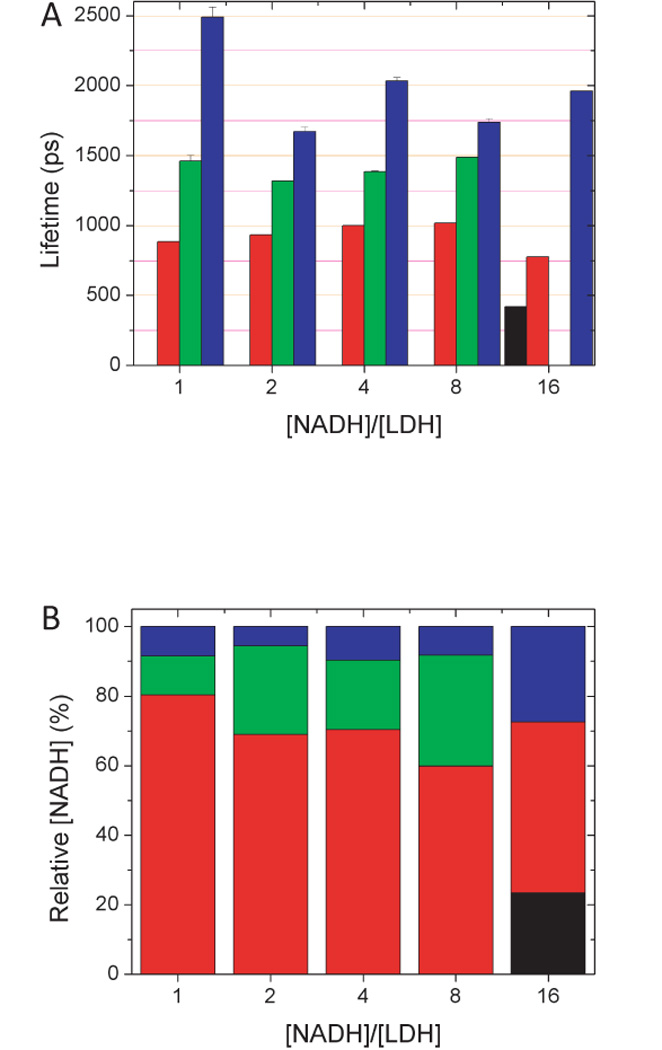
NADH lifetimes (A) and pool concentrations (B) are modified upon binding to Lactate Dehydrogenase. Four lifetimes are evident depending on the mole ratio of [NADH]/[LDH].
4. Conclusion
Analysis of intrinsic cellular NADH fluorescence by FLIM reveals several molecular subpopulations that vary with cellular metabolism. This cannot be seen in measurements of the fluorescence intensity alone. The variation in fluorescence intensity is the result of both changes in environment and concentration. We have not been able to directly associate the observed lifetimes with specific NADH-enzyme complexes, though in principle this may be possible. Calibration measurements with free NADH in buffered solution and with LDH show two and three lifetimes, respectively. These lifetimes most likely reflect different conformations of NADH resulting in a variation of the local environment of the nicotinamide ring. When cells are exposed to metabolic uncouplers and inhibitors, the NADH fluorescence signal changes significantly but this should not be interpreted as an equivalent change in NADH concentration. In fact, we find little change in total NADH concentration upon exposure to FCCP, but observe a larger fraction of the molecules located in an environment with a reduced fluorescence lifetime, and hence, quantum yield. This highlights the principle advantage of the FLIM technique. When quantifying cellular metabolism using the fluorescence intensity as a surrogate for the NADH concentration, the percent reduction of NADH (Eq. 1) will be incorrect due to change in lifetime with metabolic state.
Using this technique, we can measure cellular response to changes in substrates such as glucose. Previously,Evans et al. (2005) demonstrated that NAD(P)H fluorescence lifetime varies with glucose concentration in 3T3-L1 adipocytes. This study suggests that NAD(P)H FLIM may also be useful as a glucose sensor, for example in the monitoring of glucose in diabetes patients. Under single-photon UV excitation, they found a 29% increase in intrinsic cellular fluorescence following addition of 30 mM glucose, with a decrease in the mean lifetime and a larger fraction of the double-exponential fluorescence decay being due to the short lifetime component. Our results (Fig. 4) also demonstrate that NADH can be used as a glucose sensor, though we observed a different trend. We found that the relative concentration of the longer lifetimes increase while the concentration of NADH decreases with increased glucose. While we see a similar increase in NADH fluorescence as reported by Evans et al., our analysis suggests that this is due to an increase in fluorescence quantum yield, rather than NADH concentration, at least in the EMT6 cell line that we have used.
While FLIM presents definite advantages for metabolic imaging, there is also a price to be paid for the additional information. Compared to intensity-based measurements, the instrumentation required for FLIM is significantly more expensive and complicated. Also, the imaging time can be substantially greater when high-precision techniques such as time-correlated single photon counting are used. Our frame rate was approximately 100 times slower than intensity-based imaging on the same microscope. This is not an inherent limitation of the technique, however. Faster, video rate, FLIM instrumentation has also been developed that employ time-gating techniques to make more efficient use of the emitted fluorescence (Agronskaia et al., 2004), although this approach also has a reduced lifetime resolution and may be little faster for weakly fluorescence molecules such as NADH. Nevertheless, improvements such as these are important, because they allow for faster biological processes to be observed, and the increased efficiency also minimizes possibilities for artifacts induced by photobleaching and cell damage that can occur with prolonged imaging.
Acknowledgements
Richard Hallworth was supported by grant DC02053 (NIDCD, NIH), and MGN was supported by R15-GM085776 (NIGM, NIH) and P20 RR16469 (NCRR, NIH). This investigation was conducted in a facility constructed with support from Research Facilities Improvement Program Grant Number 1 C06 RR17417-01 from the National Center for Research Resources, NIH. We also acknowledge the support of the Nebraska EPSCoR program for CU-IBIF (EPS-0346476 (CFD 47.076), NSF). Special thanks to Dr. Eric Haas for his assistance in producing Figure 5.
References
- Agronskaia AV, Tertoolen L, Gerritsen HC. Fast fluorescence lifetime imaging of calcium in living cells. J Biomed Opt. 2004;9:1230–1237. doi: 10.1117/1.1806472. [DOI] [PubMed] [Google Scholar]
- An J, Camara AK, Rhodes SS, Riess ML, Stowe DF. Warm ischemic preconditioning improves mitochondrial redox balance during and after mild hypothermic ischemia in guinea pig isolated hearts. Am J Physiol Heart Circ Physiol. 2005;288:H2620–H2627. doi: 10.1152/ajpheart.01124.2004. [DOI] [PubMed] [Google Scholar]
- Bevington PR, Robinson DK. Data reduction and error analysis for the physical sciences. New York: McGraw-Hill; 2002. [Google Scholar]
- Bird DK, Yan L, Vrotsos KM, Eliceiri KW, Vaughan EM, Keely PJ, White JG, Ramanujam N. Metabolic mapping of MCF10A human breast cells via multiphoton fluorescence lifetime imaging of the coenzyme NADH. Cancer Res. 2005;65:8766–8773. doi: 10.1158/0008-5472.CAN-04-3922. [DOI] [PubMed] [Google Scholar]
- Blinova K, Combs C, Kellman P, Balaban RS. Fluctuation analysis of mitochondrial NADH fluorescence signals in confocal and two-photon microscopy images of living cardiac myocytes. J Microsc. 2004;213:70–75. doi: 10.1111/j.1365-2818.2004.01278.x. [DOI] [PubMed] [Google Scholar]
- Blinova K, Carroll S, Bose S, Smirnov AV, Harvey JJ, Knutson JR, Balaban RS. Distribution of mitochondrial NADH fluorescence lifetimes: Steady-state kinetics of matrix NADH interactions. Biochemistry. 2005;44:2585–2594. doi: 10.1021/bi0485124. [DOI] [PubMed] [Google Scholar]
- Chance B, Lieberman M. Intrinsic fluorescence emission from the cornea at low temperatures: Evidence of mitochondrial signals and their differing redox states in epithelial and endothelial sides. Exp Eye Res. 1978;26:111–117. doi: 10.1016/0014-4835(78)90159-8. [DOI] [PubMed] [Google Scholar]
- Chance B, Baltscheffsky H. Respiratory enzymes in oxidative phosphorylation. VII. binding of intramitochondrial reduced pyridine nucleotide. J Biol Chem. 1958;233:736–739. [PubMed] [Google Scholar]
- Chance B, Oshino N, Sugano T, Mayevsky A. Basic principles of tissue oxygen determination from mitochondrial signals. Adv Exp Med Biol. 1973;37A:277–292. doi: 10.1007/978-1-4684-3288-6_35. [DOI] [PubMed] [Google Scholar]
- Costello LC, Franklin RB. Tumor cell metabolism: The marriage of molecular genetics and proteomics with cellular intermediary metabolism; proceed with caution! Mol Cancer. 2006;5:59. doi: 10.1186/1476-4598-5-59. [DOI] [PMC free article] [PubMed] [Google Scholar]
- Evans ND, Gnudi L, Rolinski OJ, Birch DJ, Pickup JC. Glucose-dependent changes in NAD(P)H-related fluorescence lifetime of adipocytes and fibroblasts in vitro: Potential for non-invasive glucose sensing in diabetes mellitus. J Photochem Photobiol B. 2005;80:122–129. doi: 10.1016/j.jphotobiol.2005.04.001. [DOI] [PubMed] [Google Scholar]
- Huang S, Heikal AA, Webb WW. Two-photon fluorescence spectroscopy and microscopy of NAD(P)H and flavoprotein. Biophys J. 2002;82:2811–2825. doi: 10.1016/S0006-3495(02)75621-X. [DOI] [PMC free article] [PubMed] [Google Scholar]
- Indig GL, Anderson GS, Nichols MG, Bartlett JA, Mellon WS, Sieber F. Effect of molecular structure on the performance of triarylmethane dyes as therapeutic agents for photochemical purging of autologous bone marrow grafts from residual tumor cells. J Pharm Sci. 2000;89:88–99. doi: 10.1002/(SICI)1520-6017(200001)89:1<88::AID-JPS9>3.0.CO;2-K. [DOI] [PubMed] [Google Scholar]
- Kasischke KA, Vishwasrao HD, Fisher PJ, Zipfel WR, Webb WW. Neural activity triggers neuronal oxidative metabolism followed by astrocytic glycolysis. Science. 2004;305:99–103. doi: 10.1126/science.1096485. [DOI] [PubMed] [Google Scholar]
- Lakowicz JR, Szmacinski H, Nowaczyk K, Johnson ML. Fluorescence lifetime imaging of free and protein-bound NADH. Proc Natl Acad Sci U S A. 1992;89:1271–1275. doi: 10.1073/pnas.89.4.1271. [DOI] [PMC free article] [PubMed] [Google Scholar]
- Levene MJ, Dombeck DA, Kasischke KA, Molloy RP, Webb WW. In vivo multiphoton microscopy of deep brain tissue. J Neurophysiol. 2004;91:1908–1912. doi: 10.1152/jn.01007.2003. [DOI] [PubMed] [Google Scholar]
- Mayevsky A, Rogatsky GG. Mitochondrial function in vivo evaluated by NADH fluorescence: From animal models to human studies. Am J Physiol Cell Physiol. 2007;292:C615–C640. doi: 10.1152/ajpcell.00249.2006. [DOI] [PubMed] [Google Scholar]
- Nichols MG, Webb WW. Simultaneous imaging of photofrin and NADH autofluorescence in cell monolayers and multicell tumor spheroids. Photochem Photobiol. 1998;67S:95S. [Google Scholar]
- Nichols MG, Barth EE, Nichols JA. Reduction in DNA synthesis during two-photon microscopy of intrinsic reduced nicotinamide adenine dinucleotide fluorescence. Photochem Photobiol. 2005;81:259–269. doi: 10.1562/2004-08-05-RA-263. [DOI] [PubMed] [Google Scholar]
- Piston DW, Masters BR, Webb WW. Three-dimensionally resolved NAD(P)H cellular metabolic redox imaging of the in situ cornea with two-photon excitation laser scanning microscopy. J Microsc. 1995;178 ( Pt 1):20–27. doi: 10.1111/j.1365-2818.1995.tb03576.x. [DOI] [PubMed] [Google Scholar]
- Rocheleau JV, Head WS, Piston DW. Quantitative NAD(P)H/flavoprotein autofluorescence imaging reveals metabolic mechanisms of pancreatic islet pyruvate response. J Biol Chem. 2004;279:31780–31787. doi: 10.1074/jbc.M314005200. [DOI] [PubMed] [Google Scholar]
- Romashko DN, Marban E, O'Rourke B. Subcellular metabolic transients and mitochondrial redox waves in heart cells. Proc Natl Acad Sci U S A. 1998;95:1618–1623. doi: 10.1073/pnas.95.4.1618. [DOI] [PMC free article] [PubMed] [Google Scholar]
- Scott TG, Spencer RD, Leonard NJ, Weber G. Synthetic spectroscopic models related to coenzymes and base pairsVemission properties of NADH. studies of fluorescence lifetimes and quantum efficiencies of NADH, AcPyADH, [reduced acetylpyridineadenine dinucleotide] and simplified synthetic models. J Am Chem Soc. 1970;92:687–695. [Google Scholar]
- Skala MC, Riching KM, Gendron-Fitzpatrick A, Eickhoff J, Eliceiri KW, White JG, Ramanujam N. In vivo multiphoton microscopy of NADH and FAD redox states, fluorescence lifetimes, and cellular morphology in precancerous epithelia. Proc Natl Acad Sci U S A. 2007a;104:19494–19499. doi: 10.1073/pnas.0708425104. [DOI] [PMC free article] [PubMed] [Google Scholar]
- Skala MC, Riching KM, Bird DK, Gendron-Fitzpatrick A, Eickhoff J, Eliceiri KW, Keely PJ, Ramanujam N. In vivo multiphoton fluorescence lifetime imaging of protein-bound and free nicotinamide adenine dinucleotide in normal and precancerous epithelia. J Biomed Opt. 2007b;12 doi: 10.1117/1.2717503. 024014. [DOI] [PMC free article] [PubMed] [Google Scholar]
- Tiede LM, Nichols MG. Photobleaching of reduced nicotinamide adenine dinucleotide and the development of highly fluorescent lesions in rat basophilic leukemia cells during multiphoton microscopy. Photochem Photobiol. 2006;82:656–664. doi: 10.1562/2005-09-19-RA-689. [DOI] [PubMed] [Google Scholar]
- Tiede LM, Rocha-Sanchez SM, Hallworth R, Nichols MG, Beisel K. Determination of hair cell metabolic state in isolated cochlear preparations by two-photon microscopy. J Biomed Opt. 2007;12 doi: 10.1117/1.2714777. 021004. [DOI] [PMC free article] [PubMed] [Google Scholar]
- Vishwasrao HD, Heikal AA, Kasischke KA, Webb WW. Conformational dependence of intracellular NADH on metabolic state revealed by associated fluorescence anisotropy. J Biol Chem. 2005;280:25119–25126. doi: 10.1074/jbc.M502475200. [DOI] [PubMed] [Google Scholar]
- Wallace DC. A mitochondrial paradigm of metabolic and degenerative diseases, aging, and cancer: A dawn for evolutionary medicine. Annu Rev Genet. 2005;39:359–407. doi: 10.1146/annurev.genet.39.110304.095751. [DOI] [PMC free article] [PubMed] [Google Scholar]
- Yu Q, Heikal AA. Two-photon autofluorescence dynamics imaging reveals sensitivity of intracellular NADH concentration and conformation to cell physiology at the single-cell level. J Photochem Photobiol B. 2009;95:46–57. doi: 10.1016/j.jphotobiol.2008.12.010. [DOI] [PMC free article] [PubMed] [Google Scholar]
- Zipfel WR, Williams RM, Christie R, Nikitin AY, Hyman BT, Webb WW. Live tissue intrinsic emission microscopy using multiphoton-excited native fluorescence and second harmonic generation. Proc Natl Acad Sci U S A. 2003;100:7075–7080. doi: 10.1073/pnas.0832308100. [DOI] [PMC free article] [PubMed] [Google Scholar]


