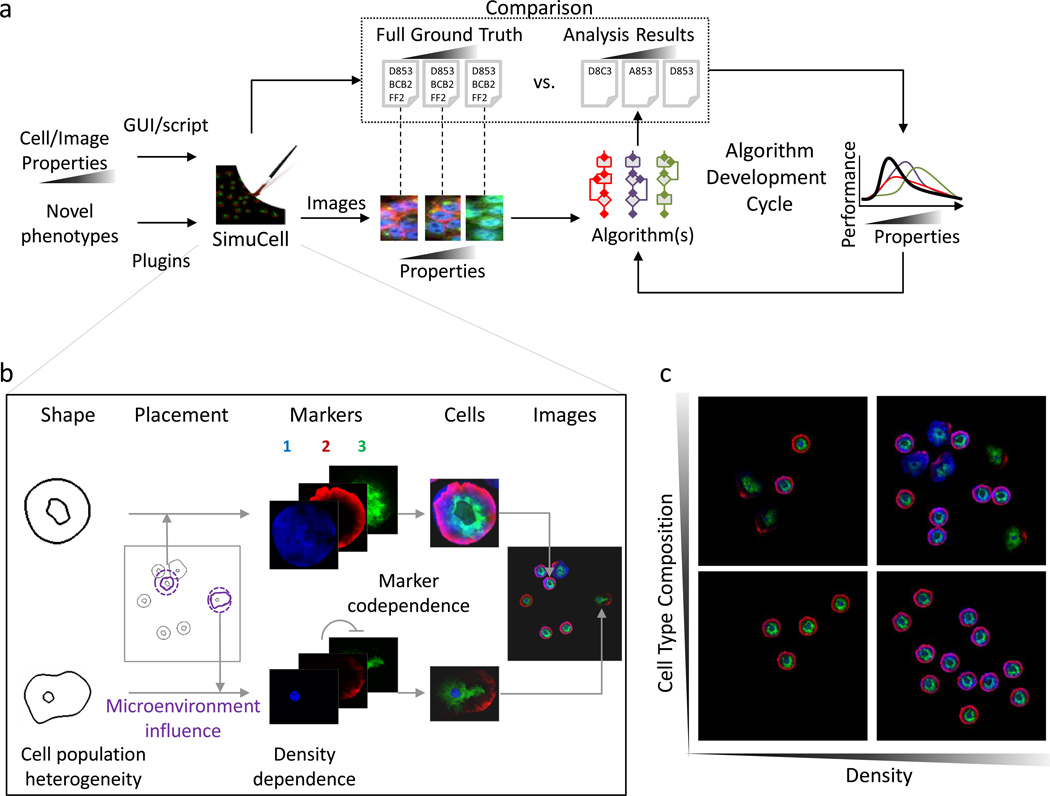
Advancements in high-content fluorescence microscopy have driven development of analytical approaches for extracting meaningful information from rich and complex biological image data. Algorithm development can be aided dramatically by the use of curated test data. To evaluate the generality and performance of new algorithms, test data should ideally contain annotation for how images differ in terms of cell phenotypes, population heterogeneity, and/or micro-environmental1 effects. Currently there is a paucity of diverse, well-annotated data. A complementary approach is to make use of synthetically generated data, in which biological1 and imaging2 effects can be varied independently and “ground truths” known. While approaches exist for rendering realistic cells3,4, creating biologically realistic cell population images has remained challenging; biomarker, cell, and population phenotypes can be subtle, interconnected, and system dependent. To deal with these challenges, we developed SimuCell (http://www.SimuCell.org), an open-source framework (Fig. 1a) for specifying and rendering realistic microscopy images containing diverse cell phenotypes, heterogeneous populations, micro-environmental dependencies and imaging artifacts.
Figure 1.
SimuCell differs from existing cell population generators5 in three ways. Firstly, SimuCell can generate heterogeneous cellular populations composed of diverse cell types. Each cell type can be defined independently by specifying models for cell and organelle shape, and distributions of markers over these shapes. Models are typically algorithmic, but there is support for rendering produced by other tools, such as the highly realistic models learned from image data by CellOrganizer3 (via the new SLML markup language). Secondly, SimuCell allows users to specify interdependencies between population, biomarker and cell phenotypes. For example, a marker’s cellular distribution can be affected by the cell’s microenvironment (Fig. 1b; marker 1) as well as the localization pattern of another marker (Fig. 1b; markers 2 and 3). These definable image properties are accessible to users either via a novel scripting syntax built on top of MATLAB, or through a graphical user interface, while intermediate results can define further “ground truths” (e.g. cell boundaries can be used to validate segmentation algorithms).
Finally, SimuCell was designed to be easily extensible, providing a standard framework for defining new plugins that can also be shared through the SimuCell website. Users interested in adding novel phenotypes to SimuCell’s palette can typically do so by writing just a few lines of code, in part due to MATLAB’s extensive library of functions. Taken together, SimuCell allows the definition of a broad range of phenotypes, encompassing highly non-trivial population-level effects such as cell-type heterogeneity or local cell-density effects (Fig. 1c). While realistic synthetic data cannot replace true experimental data6, SimuCell can be a useful part of the algorithm developer’s toolbox by generating rich, flexible test image data sets containing specified, parameterized “biological” effects.
Acknowledgements
We thank R. Murphy and members of the Altschuler and Wu labs for helpful feedback and discussions. This research was supported by the National Institute of Health grants R01s (GM085442 to S.J.A. and GM081549 to L.F.W.), the Welch Foundation (I-1619 to S.J.A. and I-1644 to L.F.W.), and UTSW QP-SURF to N.H.
References
- 1.Snijder B, et al. Nature. 2009;461(7263):520–523. doi: 10.1038/nature08282. [DOI] [PubMed] [Google Scholar]
- 2.Bray MA, Fraser AN, Hasaka TP, Carpenter AE. Journal of Biomolecular Screening. 2012;17(2):266–274. doi: 10.1177/1087057111420292. [DOI] [PMC free article] [PubMed] [Google Scholar]
- 3.Zhao T, Murphy RF. Cytometry Part A. 2007;71A(12):978–990. doi: 10.1002/cyto.a.20487. [DOI] [PubMed] [Google Scholar]
- 4.Svoboda D, Kozubek M, Stejskal S. Cytometry Part A. 2009;75A(6):494–509. doi: 10.1002/cyto.a.20714. [DOI] [PubMed] [Google Scholar]
- 5.Lehmussola A, Ruusuvuori P, Selinummi J, Huttunen H, Yli-Harja O. Ieee Transactions on Medical Imaging. 2007;26(7):1010–1016. doi: 10.1109/TMI.2007.896925. [DOI] [PubMed] [Google Scholar]
- 6.Nat Methods. 2011;8(11):885. doi: 10.1038/nmeth.1767. [DOI] [PubMed] [Google Scholar]


