Abstract
Objective
To determine the impact of two probiotic bifidobacteria on the fecal microbiota of premature infants fed either human milk or formula.
Study design
In the first of two phase 1 clinical trials, twelve premature infants receiving formula feedings were randomly assigned to receive either Bifidobacterium longum ssp infantis or Bifidobacterium animalis ssp lactis in increasing doses over a five week period. In the second, nine premature infants receiving their mother’s milk received each of the two bifidobacteria for two weeks separated by a one week wash out period. Serial stool specimens from each infant were analyzed by terminal restriction fragment length polymorphism and quantitative polymerase chain reaction for bacterial composition.
Results
Among the formula-fed infants, there was a greater increase in fecal bifidobacteria among infants receiving B. infantis than those receiving B. lactis. This difference was most marked at a dose of 1.4 × 10⁹ cfu twice daily (p < 0.05). Bacterial diversity improved over dose/time in those infants receiving B. infantis. Among the human milk-fed infants, greater increases in fecal bifidobacteria and decreases in γ-Proteobacteria followed administration of B. infantis than B. lactis. The B. longum group (which includes B. infantis but not B. lactis) was the dominant bifidobacteria among the human milk-fed infants, regardless of the probiotic administered.
Conclusions
B. infantis was more effective at colonizing the fecal microbiota than B. lactis in both formula-fed and human milk-fed premature infants. The combination of human milk plus B. infantis resulted in the highest fecal levels of bifidobacteria.
Keywords: Bifidobacterium infantis, Bifidobacterium lactis, necrotizing enterocolitis, late-onset sepsis, intestinal colonization
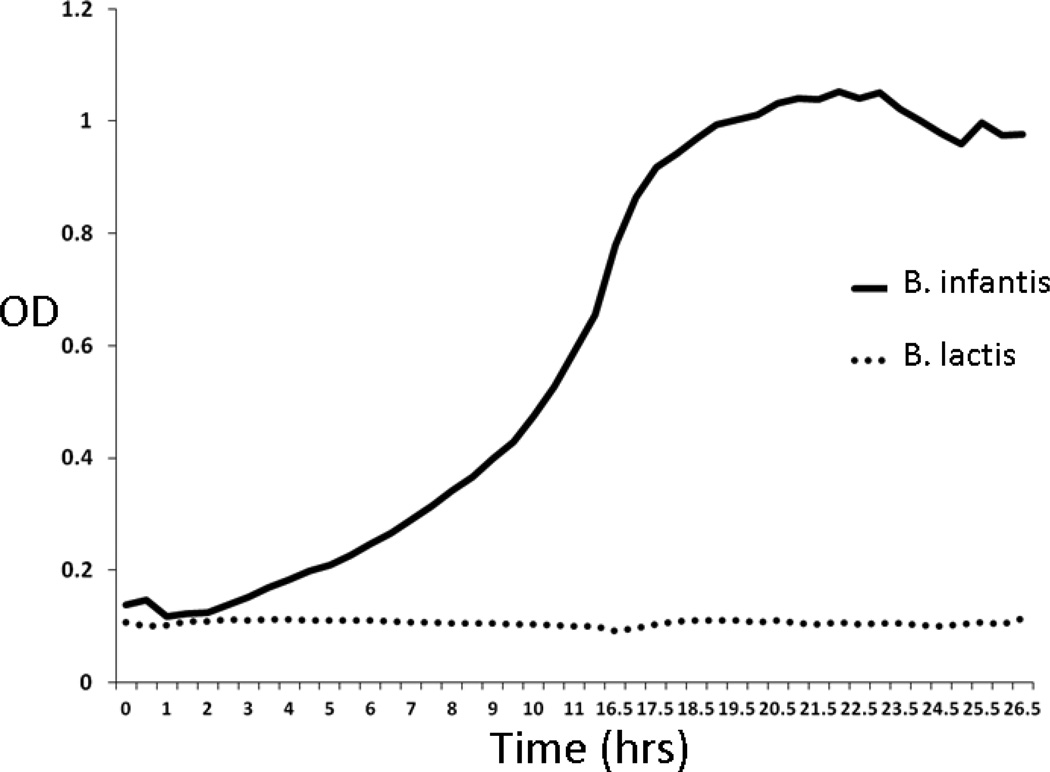
Necrotizing enterocolitis (NEC) is a common and devastating disease of premature infants. Multiple clinical trials have demonstrated a decrease in the risk of NEC with the oral administration of probiotic microorganisms.[1] [2] Probiotics are dietary supplements containing live bacteria that are intended to improve intestinal health. In the U.S., the Food and Drug Administration considers probiotics in the category of supplements “generally regarded as safe,” but has not approved administration to treat or prevent disease. Routine administration of probiotics to premature infants has not been recommended due to concerns about safety, efficacy, and many unanswered questions such as optimal dosage, optimal organism or combination of organisms, and the purity, composition, and oversight of available probiotic products. [3] To begin to address some of these questions, we performed an open dose-escalation trial and a cross-over trial of two strains of bifidobacteria, B. longum subsp. infantis (American Type Culture Collection strain 15697) and B. animalis subsp. lactis (UC Davis strain 316), in premature infants. These two strains were chosen for their genetic diversity. The B. infantis strain has encoded in its genome the enzymes necessary to digest and utilize the oligosaccharides in human milk (ie, this strain has evolved the capacity to thrive in the presence of oligosaccharides produced specifically by the mother to shape the intestinal microbiota of her infant). [4, 5] The B. lactis strain is a member of a species that is popularly used as a probiotic and able to consume lactose. However, B lactis does not contain the enzymes necessary to digest human milk oligosaccharides (HMOs) in its genome and, in fact, is unable to thrive in an environment in which HMOs are the sole carbon source (Figure 1; available at www.jpeds.com).[6] Our primary outcome was changes in composition and diversity of the intestinal microbiota with changes in dosage and types of probiotics in infants receiving either formula or mother’s own milk. We hypothesized that both strains would be detectable in the feces of premature infants in a dose-dependent manner, that both bifidobacterial strains would colonize the formula-fed infants similarly (i.e. that the B. infantis strain would have no advantage in the absence of human milk), and that infants receiving human milk plus B. infantis would have more fecal bifidobacteria, fewer γ-Proteobacteria, and greater diversity than the other groups of premature infants.
Figure 1.
Growth of B. infantis and B. lactis in culture media containing human milk oligosaccharides as the sole carbon source.
Methods
This two-trial study was approved by the Institutional Review Board at UC Davis, and performed at the UC Davis Children’s Hospital in Sacramento CA from June 2009 to July 2012. Written informed consent was obtained from the parents. In the first trial, 12 formula-fed premature infants (birth weight < 1500 grams, gestational age < 33 weeks) were randomly assigned to receive increasing doses of either B. infantis (Group F+Binf) or B. lactis (Group F+Blac) for five weeks. The dosage schedule was based on the range of published doses in this population at the time of study design (Table I; available at www.jpeds.com). Study group was not blinded, though specimens were labeled with randomly generated numbers to blind laboratory analysis. In the second trial, an additional 9 premature infants (birth weight < 1500 grams, gestational age < 33 weeks) receiving their mother’s own milk were randomly assigned to receive B. infantis (4 × 10⁹ organisms twice daily) for two weeks followed by a one week washout period (no probiotics) and then B. lactis (same dose) for two weeks (Group H+Binf/Blac) or the alternative (B. lactis first and then B. infantis, Group H+Blac/Binf).
Table 1.
Dosage schedule for the formula-fed infants (number of cfu administered twice daily)
| Probiotic | Week 1 | Week 2 | Week 3 | Week 4 | Week 5 |
| B. infantis | 5 × 10⁷ | 1.5 × 10⁸ | 4.5 × 10⁸ | 1.4 × 10⁹ | 4.2 × 10⁹ |
| B. lactis | 5 × 10⁷ | 1.5 × 10⁸ | 4.5 × 10⁸ | 1.4 × 10⁹ | 4.2 × 10⁹ |
To avoid the challenges of using over-the-counter probiotic products (e.g. unknown composition and viability [7]) the two strains of bifidobacteria were grown by a food-grade commercial facility (Culture Systems, Inc., Mishawaka, IN) specifically for this study and stored at −80° C. Purity and number of v iable bacteria per gram of both probiotics were confirmed by the investigators every six months by culture. The probiotic doses were prepared each day by the U.C. Davis investigational pharmacy by dissolving the freeze dried powder in water and administered twice daily through a feeding tube if present or directly into the infant’s mouth if there was no feeding tube.
Stool specimens were collected from the formula-fed infants at baseline and then weekly for five weeks. Specimens from the human milk-fed infants were collected at baseline, following the first probiotic course, following the washout period, and following the second probiotic course. The stool specimens were collected from a soiled diaper, placed in a sterile container, refrigerated overnight, then diluted 1:1 with phosphate buffer solution (PBS), homogenized, transported on dry ice, and stored at −80° C.
Details regarding DNA extraction, analysis of the fecal microbiota by TRFLP and qPCR, and statistical analysis of microbial composition and diversity with references are presented in the supplementary methods document (Appendix; available at www.jpeds.com).
Results
Descriptive statistics for the four groups are summarized in Table III. There were no side effects attributed to probiotic administration in any of the infants. There was one case of NEC during the period of study participation (Stage 2A based on established criteria)[8] in patient 45 who received human milk plus B. lactis. Clinical details for individual patients are presented in Table IV (available at www.jpeds.com).
Table 3.
| Demographics | Formula plus Bifidobacterium longum subsp. infantis (n=6) |
Formula plus Bifidobacterium animalis subsp. lactis (n=6) |
Human milk, B.infantis then B. lactis (n=4) |
Human milk, B. lactis then B. infantis (n=5) |
|---|---|---|---|---|
| Sex (F) | 5 | 2 | 1 | 2 |
| Birth weight, mean (SD) | 805 (238) | 847 (305) | 1016 (316) | 812 (162) |
| Gestational age at birth, mean (SD) | 25 (2) | 26 (2) | 27 (3) | 26 (2) |
| Corrected gestational age at first dose, mean(SD) | 31 (3) | 31 (1) | 31 (3) | 30 (2) |
| Cesarean section (number) | 5 | 6 | 3 | 4 |
| Apgar score at 1 min, median (range) | 7 (1–8) | 5 (1–7) | 4 (1–8) | 5 (4–5) |
| Apgar score at 5 min, median (range) | 7 (5–9) | 7 (2–8) | 6 (3–9) | 8 (7–9) |
| Hispanic | 1 | 1 | 2 | 0 |
| Black | 2 | 0 | 0 | 0 |
| Multiples | 1 surviving twin | 1 set of twins | 0 | 2 surviving twins |
| Days of antibiotics (at or before onset of study), mean (SD) | 16 (14) | 16 (16) | 8 (7) | 12 (8) |
| Days of antibiotics (during study period) | 4 (4) | 4 (9) | 0 | 2 (2) |
| Number of infants with NEC during study period | 0 | 0 | 0 | 1 |
Table 4.
Clinical details by patient and group
| Group | Patient | History |
|---|---|---|
| F+Binf | 8 | E. coli meningitis at day of life 10 treated with 21 days of antibiotics, Stage 3 NEC at 6 weeks of age requiring bowel resection and ileostomy. Enrolled in this trial at 2 months of age.* During the study had three additional brief courses of antibiotics (2 days during week 1, 3 days during week 2, and 4 days during week 4) while awaiting culture results. Probiotic continued throughout. Dose 3 was continued for an extra week. |
| F+Binf | 29 | Received 13 days of antibiotics for staphylococcal sepsis/pneumonia during weeks 3 and 4 with the probiotic continued throughout (dose 3 was continued during this time). |
| F+Binf | 37 | Treated with 7 days antibiotics for S. aureus pneumonia during week 1 with the probiotic dose continued throughout. |
| F+Blac | 7 | Received azidothymidine from birth until 6 weeks of age followed by trimethoprim-sulfamethoxazole (TMP-SMX) each Monday, Wednesday and Friday for another three weeks due to maternal HIV positivity. The period of participation for this infant was during the three weeks of TMP-SMX (seven “antibiotic days” were counted for each week of TMP-SMX administration). |
| H+Binf/Blac | 44 | Completed a 2 day course of antibiotics on the day of enrollment |
| H+Blac/Binf | 45 | Received 10 days of antibiotics for NEC during the first 2 weeks of the study (probiotics were held for the 10 day period of treatment) |
| H+Blac/Binf | 47 | Received 7 days of antibiotics during week 1 of the study (probiotics continued) |
| H+Blac/Binf | 48 | Received 3 days of antibiotics during week 2 of the study (probiotics continued) |
For this patient only, ileostomy output samples rather than feces were analyzed.
The two approaches to analysis of the microbiota are complementary. TRFLP provides broad semi-quantitative information about the percentage of the total bacterial population in a given group (in this case class/genus and phylum), and qPCR provides more precise quantification of total bacteria and group based on the primers chosen (in this case genus Bifidobacterium). For percentage bifidobacteria in this study, correlation between TRFLP and qPCR was good in the first trial (R2 = 31%) but less strong in the second trial (R2 = 9.8%)
Formula-fed infants: dose escalation trial
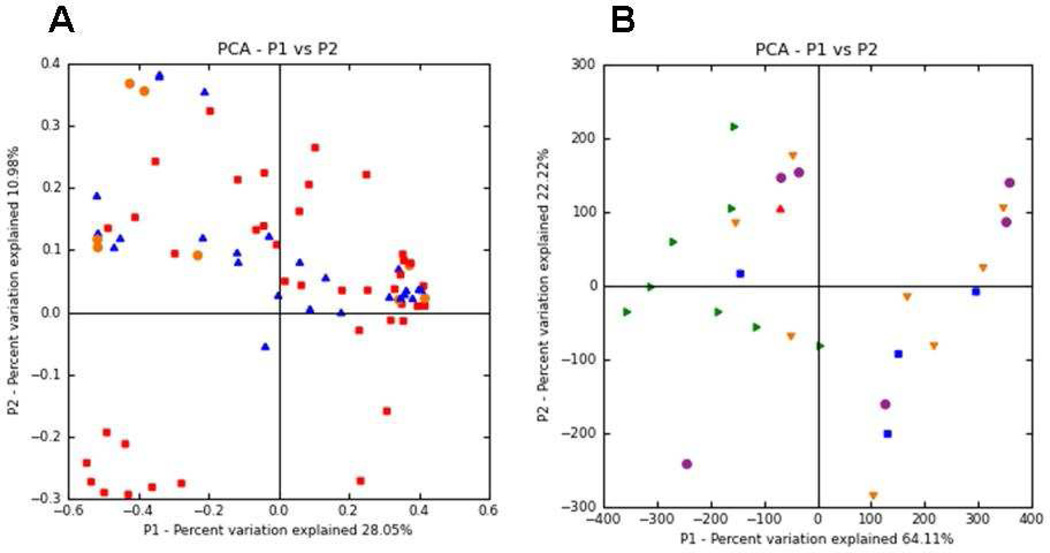
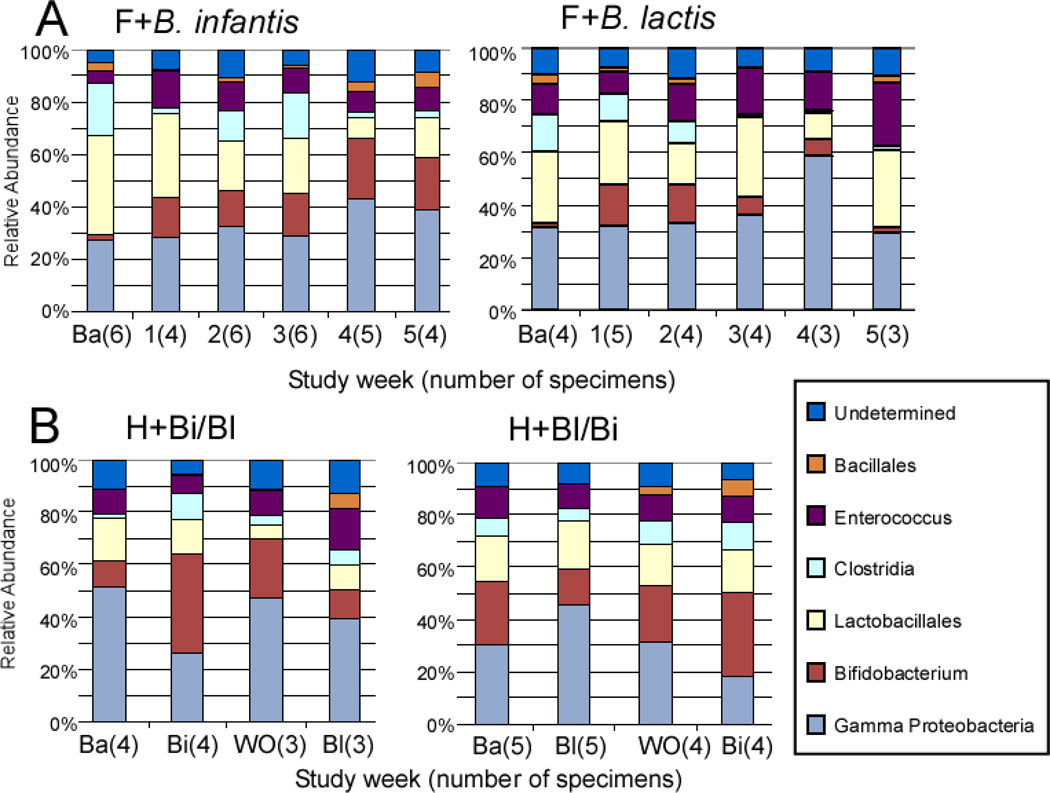
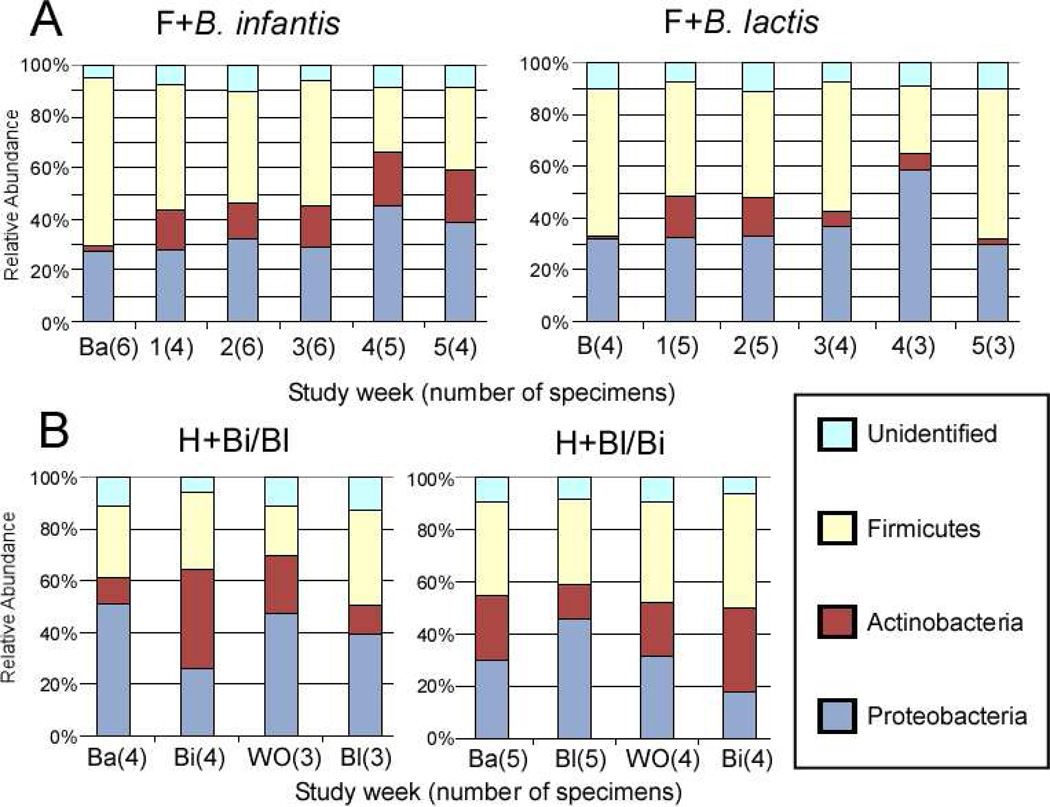
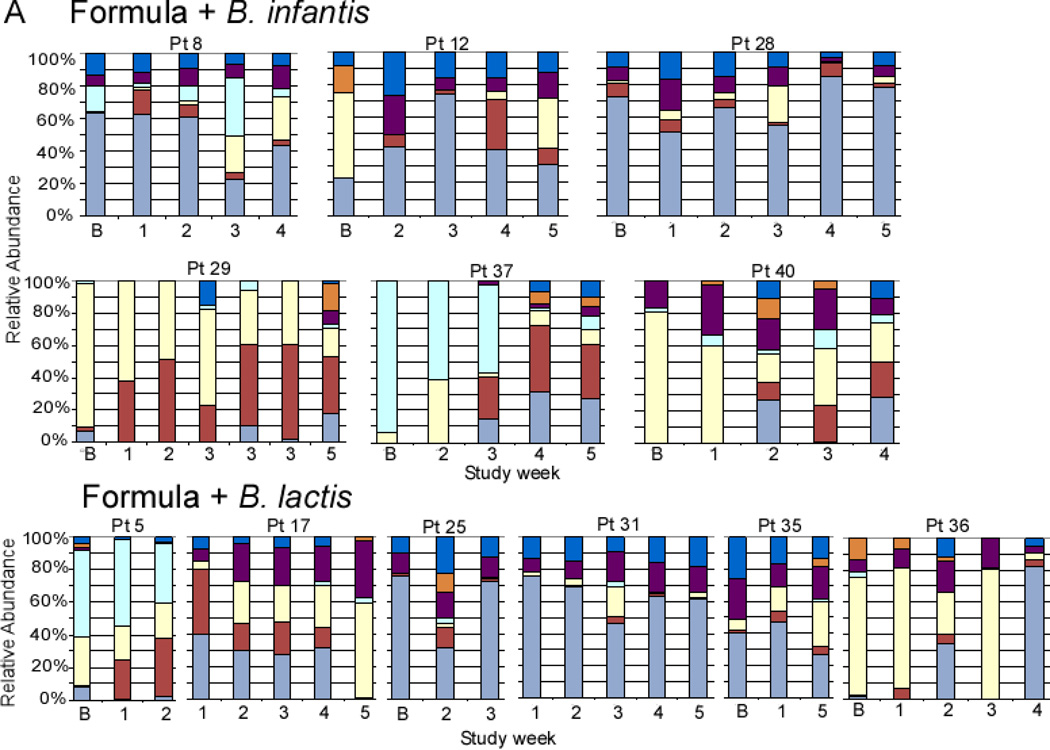
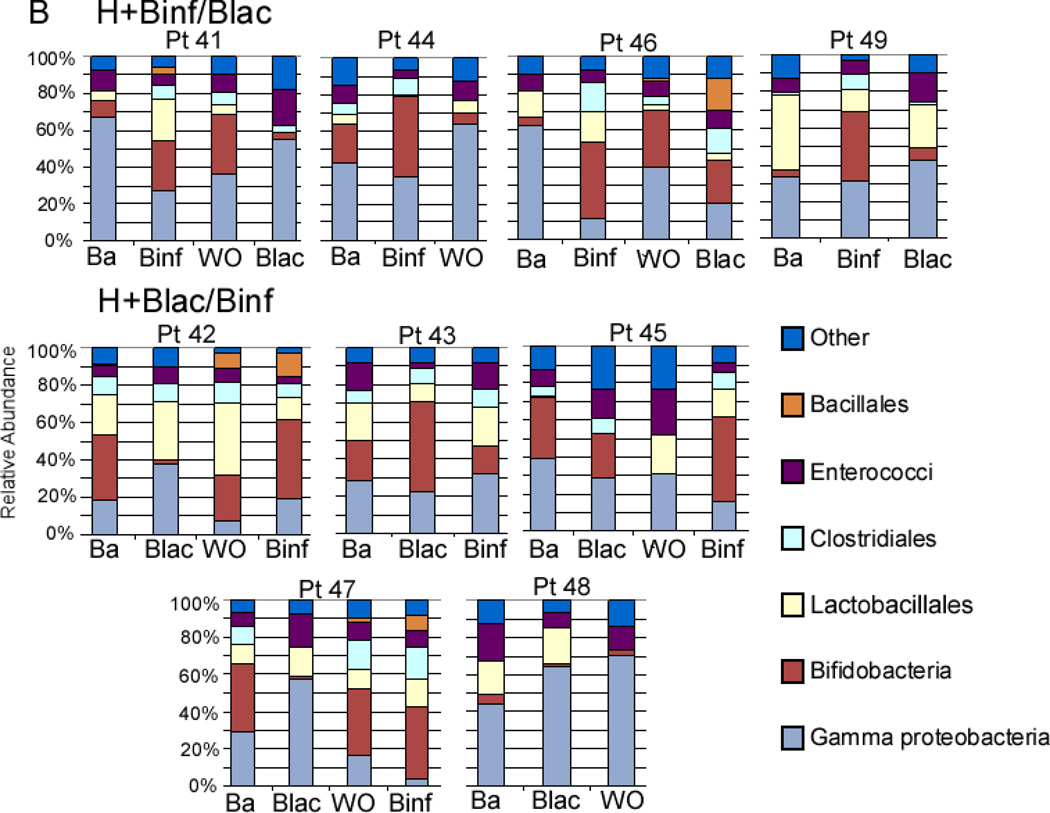
Figure 2, A (available at www.jpeds.com) is the Bray-Curtis principal component analysis (PCoA) of the TRFLP data demonstrating no large scale shifts in either group. Figure 3, A presents changes in the TRFLP data at the class/order level for the two groups over time/dosage change. Figure 4, A (available at www.jpeds.com) presents the same data at the phylum level. Bifidobacteria are members of the phylum Actinobacteria; the Gram-positive organisms that infect neonates are predominantly Firmicutes and the Gram-negative organisms that infect neonates are predominantly Proteobacteria. Figure 5, A (available at www.jpeds.com) contains the TRFLP data for each individual patient. The adult fecal microbiota at the phylum level is dominated by Bacteroidetes and Firmicutes with alterations at this level associated with several disease processes. In these premature infants, Bacteroidetes were absent and large numbers of Gram negative γ-Proteobacteria were present as is common in premature infants.[9]
Figure 2.
Principal Coordinate Analysis (PCoA) of 16S-TRFLP data. Principal components were calculated based on Bray-Curtis distance of MspI digest TRFLP profiles of all infants at all timepoints. A presents all specimens from the dose escalation trial (orange = baseline specimens, red = F+Binf, blue = F+Blac). B presents all specimens from the crossover trial (orange = baseline, purple = washout, green = H+Binf, blue = H+Blac).
Figure 3.
Universal Bacteria 16S-TRFLP analysis. Each color represents the mean percentage of the noted bacterial genus or order present in the specimen for each group at each time point. Ba = baseline specimen, F = formula, H = human milk, Bi = B. infantis, Bl = B lactis.
Figure 4.
Bacterial 16-TRFLP analysis. Each color represents the mean percentage of the noted bacterial phylum present in the specimen for each group at each time point.
Figure 5.
Individual 16S-TRFLP analysis for each patient and each time point. A Infants receiving formula in the dose escalation trial. B Infants receiving human milk in the cross-over trial. Ba = baseline
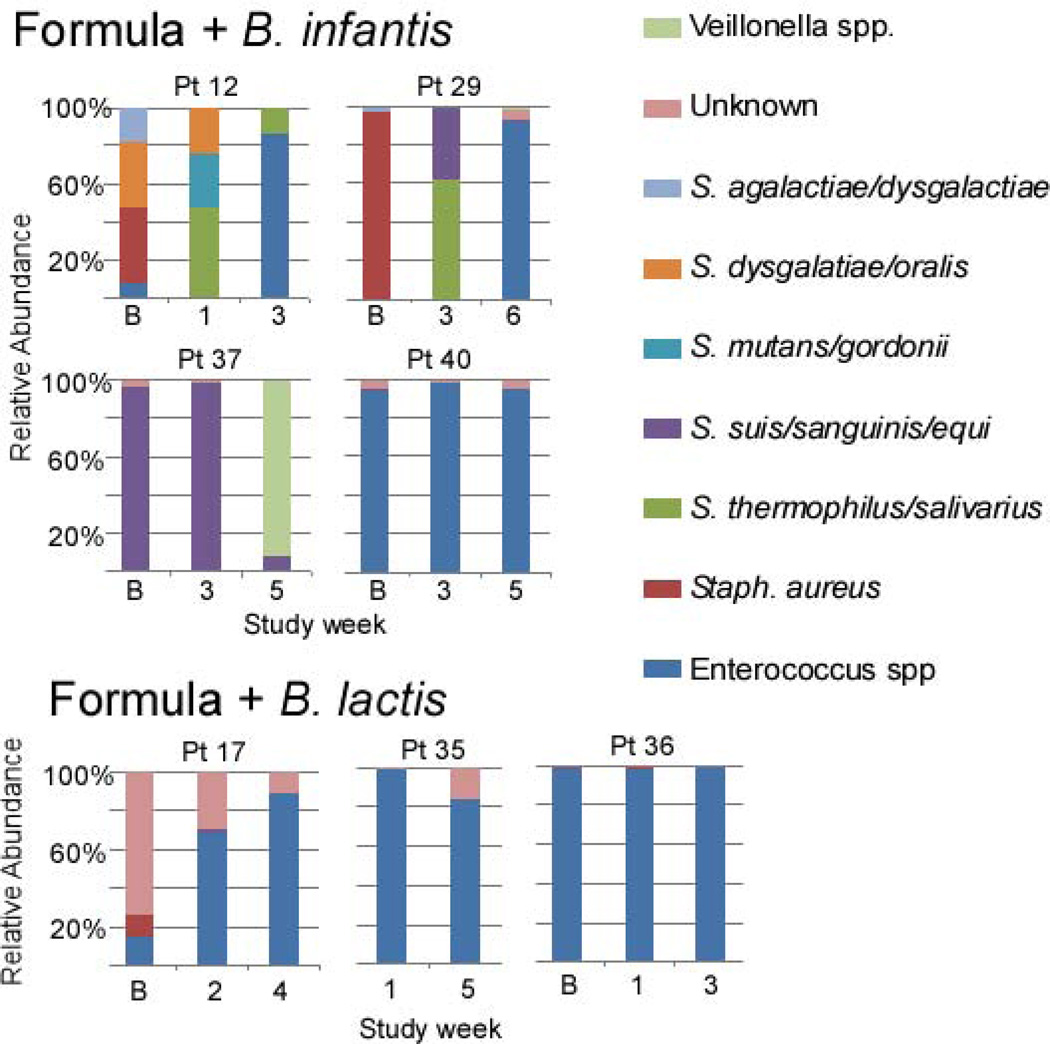
To further characterize the bacteria of the class Bacilli (orders Lactobacillales and Bacillales), a focused TRFLP (Bac-TRFLP)[10] was performed on a limited number of samples as summarized in Figure 6 (available at www.jpeds.com). Although the sample size is too small to allow statistical analysis, in each group Lactobacilli were absent, Enterococci increased over time and become the dominant component of this class, and the Staphylococci decreased with time. This pattern is similar to a previous report.[11] Whether treatment with probiotics influenced these changes is not clear from this limited analysis.
Figure 6.
Bacilli-TRFLP. Each color represents the percentage of Bacilli (Bacillales and Lactobacillales) of the noted bacterial species or genus in the specimen.
Relative abundance of bifidobacteria declined with increasing dosage over time/dose in the F+Blac group (adjusted odds ratio (AOR) of bifidobacteria among all bacterial species per weekly change = 0.69, 95% CI: 0.47 – 0.996), and showed a statistically nonsignificant trend towards increase in the F+Binf group (AOR=1.15, 95% CI 0.79 – 1.69). The comparison in change in relative abundance of bifidobacteria over time/dose in the F+Binf group over the F+Blac group was close to significant (relative AOR=1.68, 95% CI 0.99 – 2.85, p = 0.054). The two groups did not differ in the weekly change in the relative abundances of γ-Proteobacteria (F+Binf vs F+Blac AOR for weekly change parameter= 1.12, 95% CI: 0.71 – 1.77).
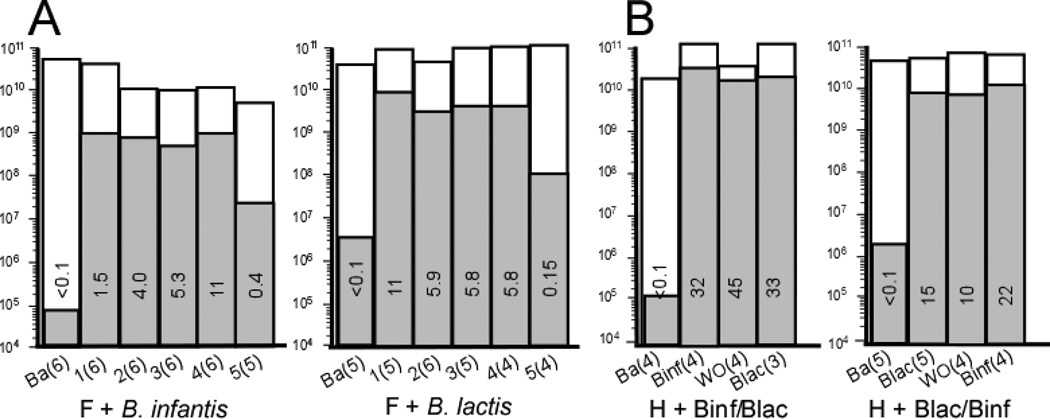
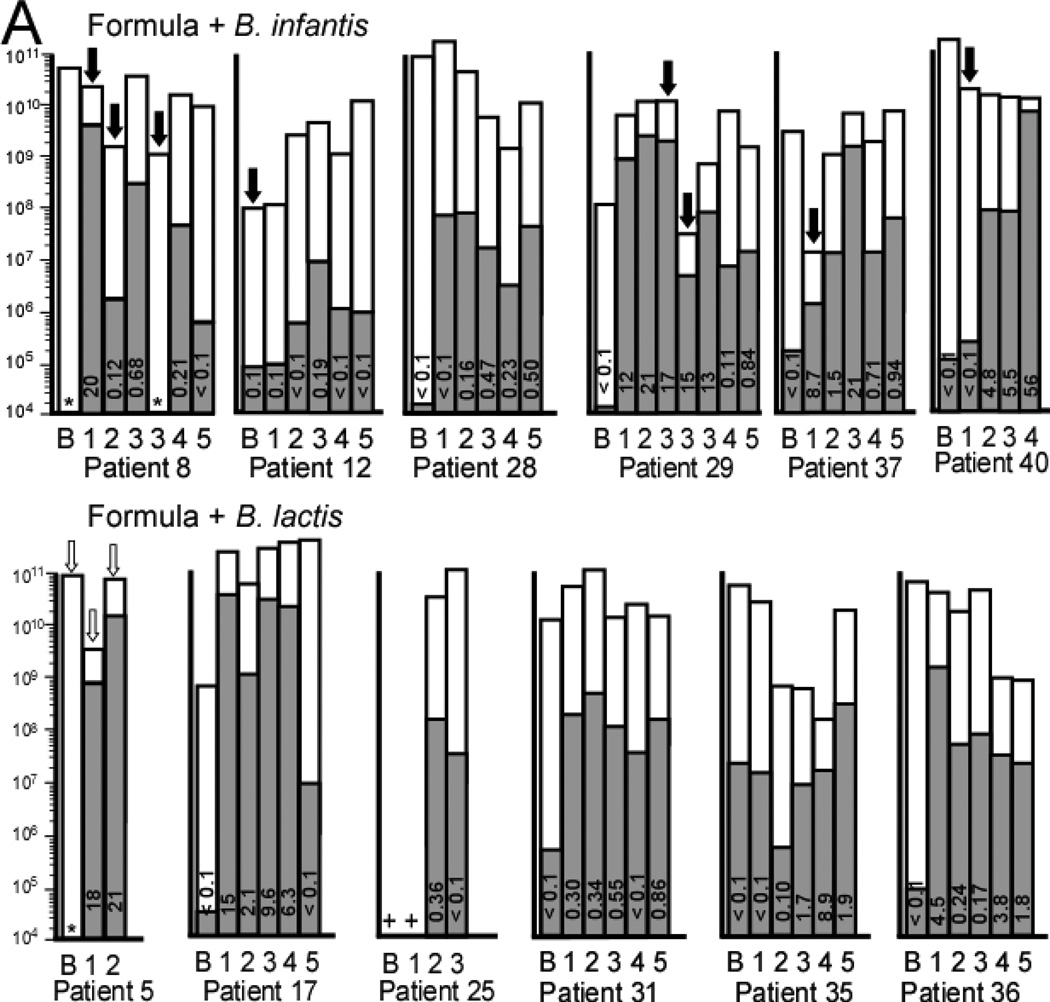
qPCR analyses with bifidobacteria-specific and universal primers more precisely quantify numbers of bifidobacteria and percentages of bifidobacteria. Figure 7, A presents the combined data from each group over time and dose. In the F+Binf group there appears to be a dose response with maximal percentage of bifidobacteria following dose 4. In the F+Blac group there was an increase in bifidobacteria with maximal percentage following dose 1 and no obvious dose response. Figure 8, A (available at www.jpeds.com) contains the qPCR data for each infant over time.
Figure 7.
qPCR analysis of mean total bacteria (white bars) and mean Bifidobacteria (gray bars) for each group at each time point. The number in each bar represents the percentage of total bacteria that are Bifidobacteria. The Y axis for total bacteria is a logarithmic scale and represents copies 16S rRNA gene per g stool. A Infants receiving formula in the dose escalation trial. B Infants receiving human milk in the cross-over trial. Ba = baseline, WO = washout.
Figure 8.
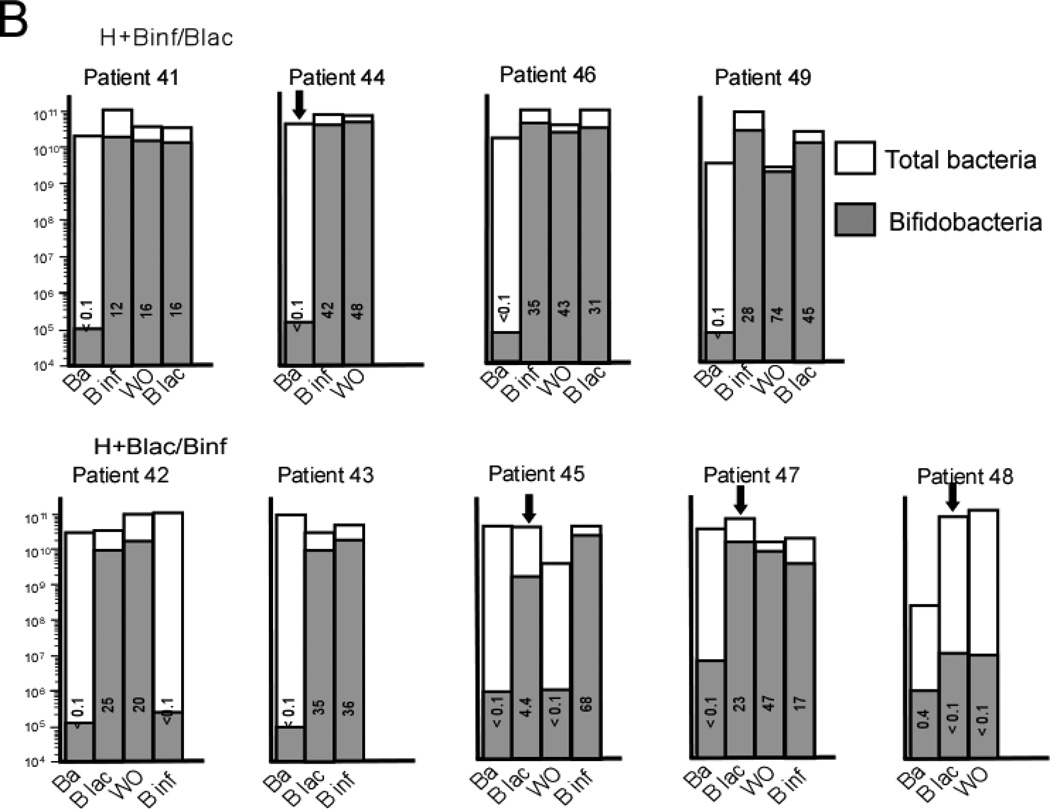
Individual qPCR analysis of mean total bacteria (white bars) and mean Bifidobacteria (gray bars) for each patient at each time point. A Infants receiving formula in the dose escalation trial. B Infants receiving human milk in the cross-over trial. The number in each bar represents the percentage of Bifidobacteria in that specimen. * = no Bifidobacteria detected (limit of detection 1 × 10⁴ copies 16S rRNA gene per g stool). + = DNA not available for this specimen. Ba = baseline specimen. Note that the Y axis is a logarithmic scale and represents copies 16S rRNA gene per g stool. Black arrows represent antibiotics given in the week prior to this specimen. White arrows represent TMP-SMX given in the week prior to this specimen.
Human milk-fed infants: cross-over trial
The PCoA plot for these two groups is presented in Figure 2, B with the TRFLP data by groups in Figures 3, B and 4, B and individual data in Figure 5, B. The relative within-period increase in bifidobacteria was much higher during administration of B. infantis than B. lactis (relative AOR=11.8, 95% CI: 10.9 – 12.8). Of all interventions in the two studies, the largest proportion of bifidobacteria was seen in infants receiving human milk plus B. infantis. Within-period decreases in the relative abundances of γ-Proteobacteria were more pronounced during B. infantis administration than during B. lactis administration: B. infantis v. B. lactis ratio (95% CI) of within-period change in odds of γ-Proteobacteria = 0.277 (0.270 – 0.284).
The qPCR analyses by group over time are presented in Figure 7, B with the individual data in Figure 8, B. In both human milk groups the highest total numbers of bifidobacteria and percentages of bifidobacteria were seen following two weeks of B. infantis. The within-period increase in the relative abundance of bifidobacteria was significantly greater for B. infantis than for B. lactis (relative AOR = 5.99, 95% CI: 4.37 – 8.20, p < 0.001).
Diversity of the fecal microbiota
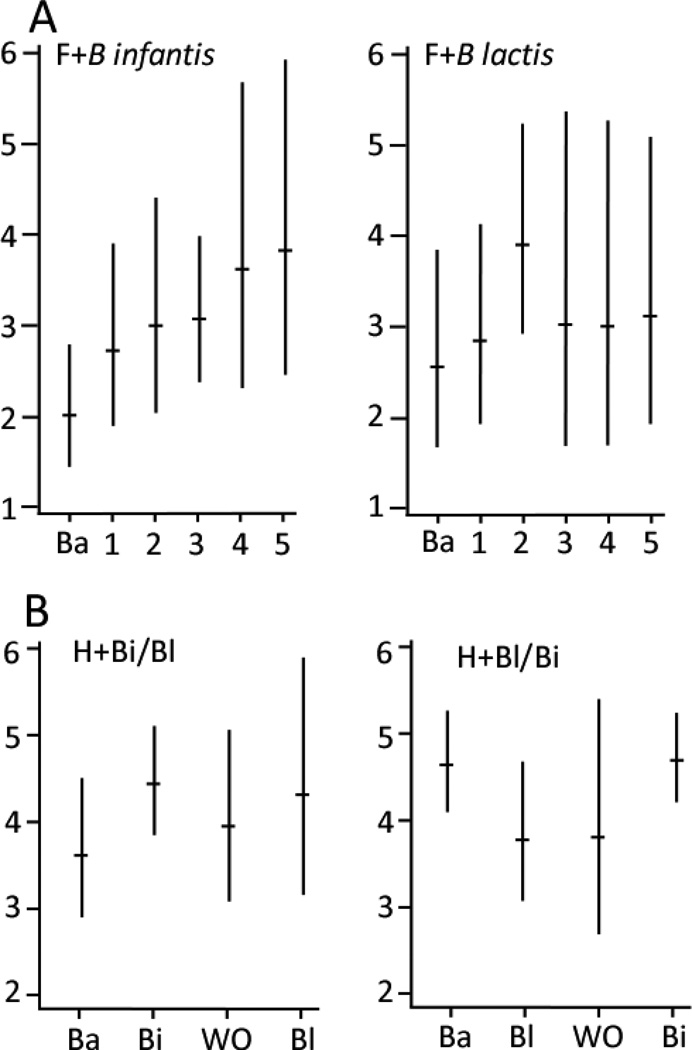
Mean Shannon diversity scores for the six taxa [geometric mean score (cluster-adjusted 95% CI)] were lower in the formula-fed infants than the infants receiving human milk (Figure 9): F+Binf 2.9 (2.6, 3.3), F+Blac 3.1 (2.5, 3.7), H+Binf/Blac 4.1 (3.8, 4.5), H+Blac/Binf 4.3 (3.7, 4.9). In Poisson regression analyses, Shannon diversity scores did not change over time/dose in the F+Blac group (weekly increase in diversity score 1.03 fold, 95% CI: 0.995 – 1.06, p=0.09), however increased diversity over time/dose was seen in the F+Binf group (weekly increase 1.12 fold (95% CI 1.01–1.25, p=0.04). The between-group comparison in microbial diversity favored the F+Binf group, but was not statistically significant (Relative rate Ratio (RRR)=1.09, 95% CI: 0.97 – 1.23). In the cross-over trial, the between-group increase in microbial diversity with treatment was greater during administration of B. infantis than B. lactis consistent with the dose-response trial, but did not reach statistical significance (B. infantis vs. B lactis RRR = 1.27, 95% CI: 0.57 – 2.81)
Figure 9.
Geometric mean Shannon diversity scores with 95% confidence intervals. A formula-fed infants (dose escalation). B human milk-fed infants (cross-over).
Antibiotic administration and the fecal microbiota
During the study, many of the infants received antibiotics (Figure 8), often with dramatic decreases in total bacteria (eg, greater than 100 fold decreases in patients 29 and 37). Patients 8 and 29 showed a concomitant decrease in bifidobacteria in spite of continued probiotic administration.
Correlation of administered strain and excreted strain
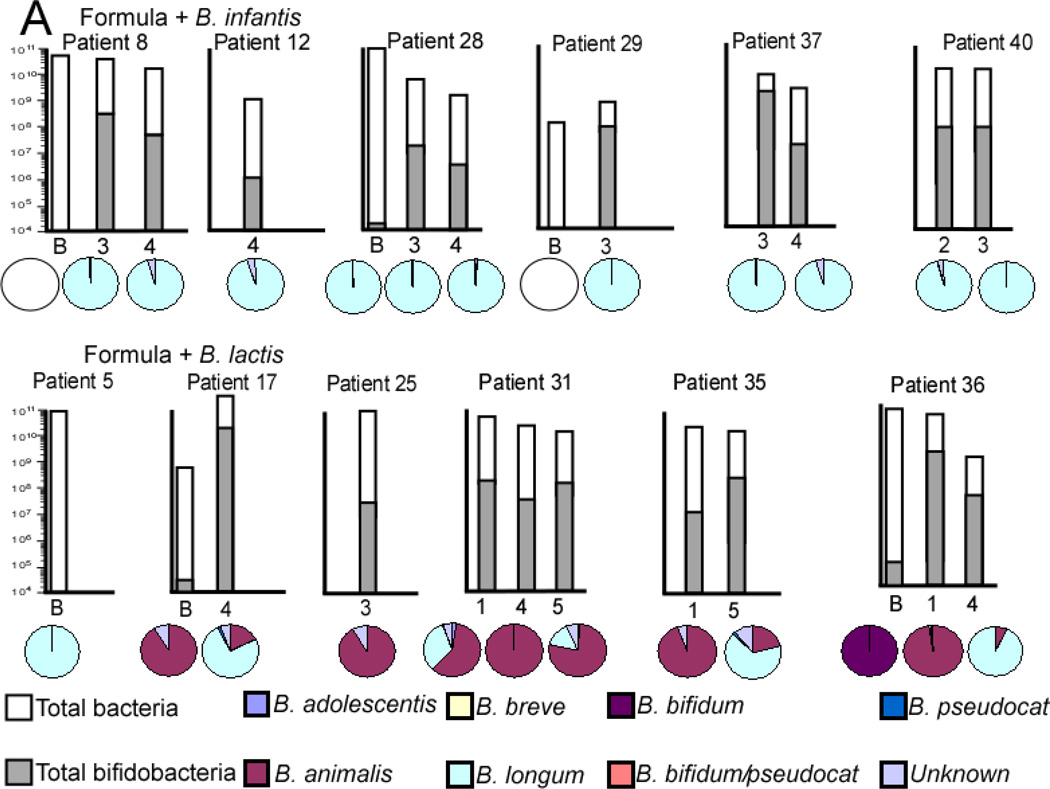
Figure 10 (available at www.jpeds.com) summarizes the bifidobacteria specific TRFLP (pie charts) combined with PCR data (bar charts) for selected specimens in each infant group. The B. longum group detects the administered probiotic B. infantis plus other B. longum subtypes and the B. animalis group detects the administered probiotic B. lactis plus other B. animalis subtypes. Among formula-fed infants, the B. animalis group was much more prevalent in infants who were administered B. lactis, but did not increase in percent abundance over time, rather increasing percentages of B. longum group over time are seen. The B. longum group was the dominant member of the genus Bifidobacterium in all formula-fed infants who received B. infantis.
Figure 10.
qPCR analysis of total bacteria (white bars) and Bifidobacteria (gray bars) and Bifidobacteria-specific TRFLP (pie charts) for selected specimens in each group. The Y axis for total bacteria is a logarithmic scale and represents copies 16S rRNA gene per g stool. The pie charts represent percentages of total Bifidobacteria not percentages of total bacteria.
Among breast-fed infants, the B. longum group was the prevalent bifidobacterium, a trend which strengthened over time regardless of the order of administration of the probiotics. The B. animalis group seemed unable to persistently colonize the breast-fed infants in spite of continued administration of B. lactis.
Discussion
The importance of the microbiome in pediatric disease has recently been reviewed.[12] Many threads of evidence suggest that the composition of the intestinal microbiota is an important risk factor for the development of NEC in premature infants. First, the intestinal microbiota of premature infants differs significantly from that of term infants. [13] This is likely due to multiple factors including early and repeated exposure to antibiotics, immaturity of the intestinal innate immune system, prolonged hospital stays, differences in feeding regimens, and lack of time with and proximity to family members. Second, the intestinal microbiota of premature infants that develop NEC differs from that of premature infants that do not develop NEC with a bloom of γ-Proteobacteria just prior to NEC onset. [14, 15] Third, the risk of developing NEC in premature infants increases with the number of days the infant receives empiric antibiotics. [16–18]
One proposed mechanism by which probiotic bacteria protect premature infants against NEC is alteration in the composition of the intestinal microbiota. We set out to determine whether B. infantis, a strain of bifidobacteria that consumes human milk oligosaccharides and has therefore been evolutionarily selected to colonize the intestine of the breast-fed term infant, is a better colonizer of the premature gut than B. lactis (a non-fermenter of human milk oligosaccharides commonly found in many commercial yogurt products) and whether a dose response for colonization exists. In this small sample, the infants receiving formula plus the probiotic B. infantis showed an increase in total bifidobacteria and microbial diversity compared with those receiving formula plus B. lactis. Furthermore colonization with B. lactis was transient and decreased even as the dose was increased. In the infants receiving their mother’s own milk, administration of B. infantis led to consistently higher total bifidobacteria, percentages of bifidobacteria, and (perhaps most importantly) lower total γ-Proteobacteria than B. lactis.
The dominance of B. infantis in the feces of breast-fed infants, even during periods of administration of B. lactis, is puzzling. This may reflect cross-contamination within the NICU or within the pharmacy as has been reported previously[19] or may represent the genetic advantage of B. infantis (ability to deconstruct and consume HMOs) in the human milk-fed premature infant. Other mechanisms by which bifidobacteria establish themselves as dominant organisms in the intestinal microbiota include production of antimicrobial compounds that inhibit a wide range of both Gram-positive and Gramnegative bacteria[20] and production of exopolysaccharide.[21] Whether either of these mechanisms benefit this strain of B. infantis is unclear.
Dose-response studies of probiotics have been performed in adults,[22] but not in premature infants. In our study, the dose in the formula-fed infants was increased three fold each week to include the range of doses published at the time the study was begun (an 81 fold dose increase over the 5 weeks of the study). The human milk-fed infants received the highest dose from the dose-escalation study in the cross-over study. Healthy term breast-fed infants often have high percentages of fecal bifidobacteria,[23] whereas this is uncommon in premature infants.[11] It is possible that even the highest dose administered in this study (almost 1010 per day) was not sufficient to imitate the fecal flora of a term infant; it is also possible that other factors related to premature birth preclude that possibility. There were several infants with a rapid increase in fecal bifidobacteria with the first probiotic dose (e.g. patients 8, 28, 29, 5, 17, 31, and 36) and others where a clear increase in bifidobacteria was not seen (patients 12 and 35). Genetic or other factors likely influence “responsiveness” to probiotics. In this study the difference between formula-fed groups was maximal at a dose of 1.4 × 10⁹ cfu twice daily for B. infantis. Increasing the dose for B. lactis above 5 × 10⁷ cfu twice daily did not increase percentage of bifidobacteria, total bacteria, or bacterial diversity. We hypothesized that administration of probiotic bifidobacteria would decrease fetal γ-Proteobacteria; this effect was not seen in the formula-fed infants, but was prominent in the infants receiving human milk plus B. infantis.
The effect of antibiotic treatment in several of these premature infants was dramatic with decreases in total bacteria by qPCR following treatment; changes in γ-Proteobacteria and bifidobacteria with antibiotics were not consistent. In mice, antibiotic treatment alters the composition of the microbiota (increases γ-Proteobacteria and decreases Firmicutes) with only minimal decreases in total bacteria, but dramatically increases susceptibility to infection.[24]
The dizygotic twins in group F+Blac (patients 35 and 36) had similar clinical courses and diets, received similar antibiotics, and were cared for in the same room and by the same nurses. Both showed an initial increase in the administered probiotic (week 1 in Figure 4), but eventually became colonized with B. longum group even though they did not receive this organism. It is unclear if this B. longum population arose indigenously or was the specific B. infantis strain used in this study. Surprisingly, the fecal microbiota did not show much similarity between the two twins suggesting that other factors influence the intestinal microbiota.
These two small studies have significant shortcomings. It would have been ideal to perform dose escalation trials and cross-over trials in both the formula-fed and human milk-fed groups. It would also have been ideal to begin the trial within the first few days of life in order to provide the probiotic during the earliest stages of colonization and to have altered the microbiota prior to the peak age of NEC occurrence. This was not possible as most of the premature infants received mixed feedings (human milk when available and formula if not) initially. A longer washout period may also have been valuable given the continued increase in percentage of bifidobacteria seen during the washout period in all the infants receiving B. infantis first. The sample size does not allow adjustment for confounders such as antibiotic administration, delivery mode, onset of feeding, and skin-to-skin time. In addition, we studied specific strains of bifidobacteria for which we had previously determined the bacterial genome. Although this presents a scientific advantage, the accompanying disadvantage is that these strains are not commercially available and that closely related commercial strains may differ in their ability to colonize the premature gut.
Probiotic administration to premature infants appears to be effective for the prevention of NEC, but is not yet the standard of care in the U.S. In these “phase 1” trials we used probiotics with known purity and composition. The probiotic products were well tolerated. In formula-fed infants, administration of B. infantis increased relative abundance of fecal bifidobacteria compared with the B. lactis group, and increased microbial diversity over time/dose. In the B. lactis group, colonization with the administered organism was not sustained. Neither group had a decrease in fecal γ-Proteobacteria. No clear dose response was noted, though increasing the dose above 1.4 × 10⁹ cfu twice daily increased fecal bifidobacteria in just 2 of the 12 infants. In the human milk-fed infants, supplementation with B. infantis was associated with a decrease in γ-Proteobacteria, and a marked increase in bifidobacteria. The B. longum group was dominant across the great majority breast-fed infants at all time points, regardless of timing or species of probiotic administration. The combination of human milk and B. infantis was most effective of all interventions studied at “normalizing” the fecal microbiota.
Acknowledgements
Our thanks to Aaron Adamson for technical support with specimen processing and DNA extraction, Mariya Ryazantseva for assistance with the qPCR analysis, Man Ki Tsui for assistance with the growth study in HMO of the two probiotics, and the NICU nurses for assistance with specimen collection.
Supported by the Eunice Kennedy Shriver National Institute of Child Health and Development, the National Institute of Allergies and Infectious Diseases, the National Institute of Diabetes and Digestive and Kidney Diseases (R01-HD059127), and the National Center for Advancing Translational Sciences, National Institutes of Health (UL1 TR000002). The content is solely the responsibility of the authors and does not necessarily represent the official views of the National Institutes of Health.
Abbreviations
- TRFLP
terminal restriction fragment length polymorphism
- qPCR
quantitative polymerase chain reaction
- cfu
colony forming units
- NEC
necrotizing enterocolitis
Appendix
DNA extraction
Bacterial genomic DNA was extracted from stool samples as previously described with a few modifications.[1] Briefly, frozen stool:PBS mixture was thawed and centrifuged. The fecal pellet was rinsed twice with PBS then resuspended in 200 µl lysis buffer with freshly added 40 mg/ml lysozyme then incubated at 37°C for 30 min. Buffer ASL (Qiagen, Valencia, CA) was added to equal 2.0 ml; the sample was vortexed and then homogenized by bead-beating in a FastPrep-24 Instrument (MP Biomedicals, Solon, OH) for 2 min at 6.5 m/sec. The homogenate was incubated for 5 min at 95°C, vortexed, and centrifu ged at 13,000 x g for 1 min to pellet stool particles. DNA in the supernatant was purified with the Qiagen Stool Mini Kit.
qPCR analysis of the fecal microbiota
SYBR green and TaqMan quantitative real time PCR (qPCR) assays were performed on a 7500 Fast Real-Time PCR System (Applied Biosystems, Carlsbad, CA) with primers specific for universal eubacteria and bifidobacteria (Table II; available at www.jpeds.com) as previously described.[2, 3] All reactions were carried out in triplicate with a nontemplate control.
Table 2.
Primer sequences
| Universal qPCR | Forward | Uni334F | 5’- ACTCCTACGGGAGGCAGCAGT-3’ |
| Universal qPCR | Reverse | Uni514R | 5’- ATTACCGCGGCTGCTGGC-3’ |
| Bifidobacteria qPCR | Forward | Bif F | 5’- GCGTGCTTAACACATGCAAGTC-3’ |
| Bifidobacteria qPCR | Reverse | Bif R | 5’- CACCCGTTTCCAGGAGCTATT-3’ |
| Taqman probe | Bif P | 5’- [6-FAM]TCACGCATTACTCACCCGTTCGCC[BHQ1]-3’ | |
| PCR for TRFLP | Forward | Uni331F-FAM | 5’-[5FAM]-TCCTACGGGAGGCAGCAGT-3’ |
| PCR for TRFLP | Reverse | 1492R | 5’-GGTTACCTTGTTACGACTT-3’ |
| PCR for Bac-TRFLP | Forward | NLAB2F | 5’[5HEX]-GGCGGCGTGCCTAATACATGCAAGT-3’ |
| PCR for Bac-TRFLP | Reverse | WLAB1R | 5’-TCGCTTTACGCCCAATAAATCCGGA-3’ |
| PCR for Bif-TRFLP | Forward | NBIF389 | 5' [HEX]-GCCTTCGGGTTGTAAAC-3' |
| PCR for Bif-TRFLP | Reverse | NBIF1018REV | 5'-GACCATGCACCACCTGTG-3' |
TRFLP analysis of the fecal microbiota
PCR amplification was performed in triplicate and the products combined prior to purification with conditions as described. [4] [5] Bacilli-specific TRFLP (Bac-TRFLP) and Bifidobacteria-specific TRFLP (Bif-TRFLP) were performed as previously outlined.[6, 7] PCR products were analyzed by electrophoresis and purified using the QIAquick PCR Purification Kit (Qiagen, Valencia, CA). All 16S-TRFLP amplicons were digested using the enzymes AluI, MspI, HaeIII, and HhaI. Bac-TRFLP amplicons were digested using the enzymes MseI, Hpy188I, and Hpy188III. Bif-TRFLP amplicons were digested in AluI and HaeIII only. Next, 1.5 µl of the digestion mixture was used for fragment analysis and traces were visualized with the program Peak Scanner v1.0 (Applied Biosystems). Peak filtration and clustering analyses were performed with R software, using published program scripts and analysis protocols.[8] For Bif-TRFLP analysis fragment sizes were compared with an in-house empirical database of TRF sizes constructed from a library of pure strains.[7] Results were calculated as a percentage of the total post-filtering peak area from the electropherograms, excluding primer-dimer and smaller peaks. Taxonomic assignments of operational taxonomic units were based on comparison with an in silico digest database generated by the virtual digest tool from MiCA[9] of good-quality 16S rRNA gene sequences compiled by the Ribosomal Database Project Release.[10, 11]
Statistical analyses of microbial composition
Using QIIME software, multidimensional summary measures of the microbial composition analyzed by 16S-TRFLP were visualized in a reduced number of dimensions via a 3-dimensional principal coordinate analysis (PCoA) plot .[12] In this plot, greater between-sample dissimilarity in microbial community structure is reflected in greater distances between the plotted points corresponding to those samples.
For each trial, longitudinal trajectories of the patient’s weekly 16S-TRFLP bacterial composition and diversity measures were modeled with mixed-effects extensions of generalized linear models, using PROC GLIMMIX in SAS/Stat software [13] In the first trial, for each outcome, adjusted dose-response effects for each group were estimated and compared by fitting group-specific slopes (for a one-week change) as a fixed effect in models that also included terms for gestational age at first dose, for study group (a binary variable for B. infantis vs. B. lactis, to adjust for between-group differences at study baseline), and recent (past 6 day) antibiotic exposure, as well as random intercepts for each infant. For the relative abundance of bifidobacteria outcome, week 0 values departed from the linear dose-response pattern observed in subsequent weeks. Hence, for this outcome, an additional term was added to the model to account for this discrepancy. In effect, the between-group comparison of slopes for this outcome was based on the week 1 to week 5 data. In the second trial, for each outcome, the between-group (B. infantis vs. B. lactis) adjusted difference in within-period mean changes were estimated by fitting a model with fixed effects for each subject-period combination and two separate within-subject, within-period indicators for B. infantis and B. lactis. The indicator for B. infantis (B. animalis) was coded 1 for the second measurement in a B.infantis (B. animalis) period and 0 otherwise. The coefficients for these indicators were then compared with each other to estimate the between-probiotic difference in within-period mean changes. To protect inferences against slight departures from model assumptions, robust standard errors and confidence intervals were calculated using a small sample adjustment to the sandwich estimator.[14] Taxon-specific relative abundances (e.g. percentage bifidobacteria) were modeled using Beta regression, an extension of logistic regression for continuous outcomes on the interval (0,1).[15]
Statistical analyses of microbial diversity
Shannon diversity [16] is the exponential of the Shannon entropy and, in this setting, has a theoretical range from 1 (i.e. no diversity because one of the taxa has 100% relative abundance) to 6 (maximum diversity because each of the six taxa is equally abundant). Weekly Shannon diversity scores for the six taxon-specific relative abundances were modeled using Poisson regression. Because the distribution of the qPCR outcomes in the first trial did not satisfy regression modeling assumptions, nonparametric methods were used for between-group comparisons for each dosage level. For assessing the agreement between relative abundance measures of bifidobacteria by qPCR and by TRFLP, the coefficient of determination (R-square) was estimated using the linear regression procedure for clustered survey data (PROC SURVEYREG).
References
- 1.Martinez I, Kim J, Duffy PR, Schlegel VL, Walter J. Resistant starches types 2 and 4 have differential effects on the composition of the fecal microbiota in human subjects. PloS one. 2010;5:e15046. doi: 10.1371/journal.pone.0015046. [DOI] [PMC free article] [PubMed] [Google Scholar]
- 2.Hartman AL, Lough DM, Barupal DK, Fiehn O, Fishbein T, Zasloff M, et al. Human gut microbiome adopts an alternative state following small bowel transplantation. Proc Natl Acad Sci USA. 2009;106:17187–17192. doi: 10.1073/pnas.0904847106. [DOI] [PMC free article] [PubMed] [Google Scholar]
- 3.Penders J, Vink C, Driessen C, London N, Thijs C, Stobberingh EE. Quantification of Bifidobacterium spp., Escherichia coli and Clostridium difficile in faecal samples of breast-fed and formula-fed infants by real-time PCR. FEMS Microbiol Lett. 2005;243:141–147. doi: 10.1016/j.femsle.2004.11.052. [DOI] [PubMed] [Google Scholar]
- 4.Nadkarni MA, Martin FE, Jacques NA, Hunter N. Determination of bacterial load by real-time PCR using a broad-range (universal) probe and primers set. Microbiology. 2002;148:257–266. doi: 10.1099/00221287-148-1-257. [DOI] [PubMed] [Google Scholar]
- 5.Lane D. 16S/23S rRNA sequencing. In: Stackebrandt E, Goodfellow M, editors. Nucleic Acid Techniques in Bacterial Systematics. New York: John Wiley & Sons; 1991. pp. 115–175. [Google Scholar]
- 6.Bokulich NA, Mills DA. Differentiation of mixed lactic acid bacteria communities in beverage fermentations using targeted terminal restriction fragment length polymorphism. Food Microbiol. 2012;31:126–132. doi: 10.1016/j.fm.2012.02.007. [DOI] [PubMed] [Google Scholar]
- 7.Lewis ZT, Bokulich NA, Kalanetra KM, Ruiz-Moyano S, Underwood MA, Mills DA. Use of bifidobacterial specific terminal restriction fragment length polymorphisms to complement next generation sequence profiling of infant gut communities. Anaerobe. 2013;19:62–69. doi: 10.1016/j.anaerobe.2012.12.005. [DOI] [PMC free article] [PubMed] [Google Scholar]
- 8.Abdo Z, Schuette UM, Bent SJ, Williams CJ, Forney LJ, Joyce P. Statistical methods for characterizing diversity of microbial communities by analysis of terminal restriction fragment length polymorphisms of 16S rRNA genes. Environ Microbiol. 2006;8:929–938. doi: 10.1111/j.1462-2920.2005.00959.x. [DOI] [PubMed] [Google Scholar]
- 9.Shyu C, Soule T, Bent SJ, Foster JA, Forney LJ. MiCA: a web-based tool for the analysis of microbial communities based on terminal-restriction fragment length polymorphisms of 16S and 18S rRNA genes. Microb Ecol. 2007;53:562–570. doi: 10.1007/s00248-006-9106-0. [DOI] [PubMed] [Google Scholar]
- 10.Cole JR, Chai B, Farris RJ, Wang Q, Kulam-Syed-Mohideen AS, McGarrell DM, et al. The ribosomal database project (RDP-II): introducing myRDP space and quality controlled public data. Nucleic Acids Res. 2007;35:D169–D172. doi: 10.1093/nar/gkl889. [DOI] [PMC free article] [PubMed] [Google Scholar]
- 11.Cole JR, Wang Q, Cardenas E, Fish J, Chai B, Farris RJ, et al. The Ribosomal Database Project: improved alignments and new tools for rRNA analysis. Nucleic Acids Res. 2009;37:D141–D145. doi: 10.1093/nar/gkn879. [DOI] [PMC free article] [PubMed] [Google Scholar]
- 12.Caporaso JG, Kuczynski J, Stombaugh J, Bittinger K, Bushman FD, Costello EK, et al. QIIME allows analysis of high-throughput community sequencing data. Nature Methods. 2010;7:335–336. doi: 10.1038/nmeth.f.303. [DOI] [PMC free article] [PubMed] [Google Scholar]
- 13.SAS Institute Inc. Version 9.2 of the SAS System for Windows. SAS and all other SAS Institute Inc. product or service names are registered trademarks or trademarks of SAS Institute Inc. Cary, NC: SAS Institute Inc.; Copyright ©; 2002–2008. [Google Scholar]
- 14.Mancl LA, DeRouen TA. A covariance estimator for GEE with improved small-sample properties. Biometrics. 2001;57:126–134. doi: 10.1111/j.0006-341x.2001.00126.x. [DOI] [PubMed] [Google Scholar]
- 15.Ferrari SLP, Cribari-Neto F. Beta regression for modelling rates and proportions. J Appl Stat. 2004;31:799–815. [Google Scholar]
- 16.Jost L. Entropy and diversity. Oikos. 2006;113:363–375. [Google Scholar]
Footnotes
Publisher's Disclaimer: This is a PDF file of an unedited manuscript that has been accepted for publication. As a service to our customers we are providing this early version of the manuscript. The manuscript will undergo copyediting, typesetting, and review of the resulting proof before it is published in its final citable form. Please note that during the production process errors may be discovered which could affect the content, and all legal disclaimers that apply to the journal pertain.
The authors declare no conflicts of interest.
References
- 1.Wang Q, Dong J, Zhu Y. Probiotic supplement reduces risk of necrotizing enterocolitis and mortality in preterm very low-birth-weight infants: an updated meta-analysis of 20 randomized, controlled trials. J Pediatr Surg. 2012;47:241–248. doi: 10.1016/j.jpedsurg.2011.09.064. [DOI] [PubMed] [Google Scholar]
- 2.Deshpande G, Rao S, Patole S, Bulsara M. Updated meta-analysis of probiotics for preventing necrotizing enterocolitis in preterm neonates. Pediatrics. 2010;125:921–930. doi: 10.1542/peds.2009-1301. [DOI] [PubMed] [Google Scholar]
- 3.Neu J. Routine probiotics for premature infants: let's be careful! J Pediatr. 2011;158:672–674. doi: 10.1016/j.jpeds.2010.11.028. [DOI] [PMC free article] [PubMed] [Google Scholar]
- 4.Ward RE, Ninonuevo M, Mills DA, Lebrilla CB, German JB. In vitro fermentability of human milk oligosaccharides by several strains of bifidobacteria. Mol Nutr Food Res. 2007;51:1398–1405. doi: 10.1002/mnfr.200700150. [DOI] [PubMed] [Google Scholar]
- 5.Sela DA, Mills DA. Nursing our microbiota: molecular linkages between bifidobacteria and milk oligosaccharides. Trends Microbiol. 2010;18:298–307. doi: 10.1016/j.tim.2010.03.008. [DOI] [PMC free article] [PubMed] [Google Scholar]
- 6.LoCascio RG, Ninonuevo MR, Kronewitter SR, Freeman SL, German JB, Lebrilla CB, et al. A versatile and scalable strategy for glycoprofiling bifidobacterial consumption of human milk oligosaccharides. Microb Biotechnol. 2009;2:333–342. doi: 10.1111/j.1751-7915.2008.00072.x. [DOI] [PMC free article] [PubMed] [Google Scholar]
- 7.Marcobal A, Underwood MA, Mills DA. Rapid determination of the bacterial composition of commercial probiotic products by terminal restriction fragment length polymorphism analysis. J Pediatr Gastroenterol Nutr. 2008;46:608–611. doi: 10.1097/MPG.0b013e3181660694. [DOI] [PubMed] [Google Scholar]
- 8.Kliegman RM, Walsh MC. Neonatal necrotizing enterocolitis: pathogenesis, classification, and spectrum of illness. Curr Probl Pediatr. 1987;17:213–288. doi: 10.1016/0045-9380(87)90031-4. [DOI] [PMC free article] [PubMed] [Google Scholar]
- 9.Arboleya S, Binetti A, Salazar N, Fernandez N, Solis G, Hernandez-Barranco A, et al. Establishment and development of intestinal microbiota in preterm neonates. FEMS Microbiol Ecol. 2012;79:763–772. doi: 10.1111/j.1574-6941.2011.01261.x. [DOI] [PubMed] [Google Scholar]
- 10.Bokulich NA, Mills DA. Differentiation of mixed lactic acid bacteria communities in beverage fermentations using targeted terminal restriction fragment length polymorphism. Food Microbiol. 2012;31:126–132. doi: 10.1016/j.fm.2012.02.007. [DOI] [PubMed] [Google Scholar]
- 11.Jacquot A, Neveu D, Aujoulat F, Mercier G, Marchandin H, Jumas-Bilak E, et al. Dynamics and clinical evolution of bacterial gut microflora in extremely premature patients. J Pediatr. 2011;158:390–396. doi: 10.1016/j.jpeds.2010.09.007. [DOI] [PubMed] [Google Scholar]
- 12.Johnson CL, Versalovic J. The human microbiome and its potential importance to pediatrics. Pediatrics. 2012;129:950–960. doi: 10.1542/peds.2011-2736. [DOI] [PMC free article] [PubMed] [Google Scholar]
- 13.Westerbeek EA, van den Berg A, Lafeber HN, Knol J, Fetter WP, van Elburg RM. The intestinal bacterial colonisation in preterm infants: a review of the literature. Clin Nutr. 2006;25:361–368. doi: 10.1016/j.clnu.2006.03.002. [DOI] [PubMed] [Google Scholar]
- 14.Wang Y, Hoenig JD, Malin KJ, Qamar S, Petrof EO, Sun J, et al. 16S rRNA gene-based analysis of fecal microbiota from preterm infants with and without necrotizing enterocolitis. ISME J. 2009;3:944–954. doi: 10.1038/ismej.2009.37. [DOI] [PMC free article] [PubMed] [Google Scholar]
- 15.Mai V, Young CM, Ukhanova M, Wang X, Sun Y, Casella G, et al. Fecal microbiota in premature infants prior to necrotizing enterocolitis. PloS one. 2011;6:e20647. doi: 10.1371/journal.pone.0020647. [DOI] [PMC free article] [PubMed] [Google Scholar]
- 16.Cotten CM, Taylor S, Stoll B, Goldberg RN, Hansen NI, Sanchez PJ, et al. Prolonged duration of initial empirical antibiotic treatment is associated with increased rates of necrotizing enterocolitis and death for extremely low birth weight infants. Pediatrics. 2009;123:58–66. doi: 10.1542/peds.2007-3423. [DOI] [PMC free article] [PubMed] [Google Scholar]
- 17.Alexander VN, Northrup V, Bizzarro MJ. Antibiotic exposure in the newborn intensive care unit and the risk of necrotizing enterocolitis. J Pediatr. 2011;159:392–397. doi: 10.1016/j.jpeds.2011.02.035. [DOI] [PMC free article] [PubMed] [Google Scholar]
- 18.Kuppala VS, Meinzen-Derr J, Morrow AL, Schibler KR. Prolonged Initial Empirical Antibiotic Treatment is Associated with Adverse Outcomes in Premature Infants. J Pediatr. 2011;159:720–725. doi: 10.1016/j.jpeds.2011.05.033. [DOI] [PMC free article] [PubMed] [Google Scholar]
- 19.Kitajima H, Sumida Y, Tanaka R, Yuki N, Takayama H, Fujimura M. Early administration of Bifidobacterium breve to preterm infants: randomised controlled trial. Arch Dis Child Fetal Neonatal Ed. 1997;76:F101–F107. doi: 10.1136/fn.76.2.f101. [DOI] [PMC free article] [PubMed] [Google Scholar]
- 20.Martinez FA, Balciunas EM, Converti A, Cotter PD, de Souza Oliveira RP. Bacteriocin production by Bifidobacterium spp. A review. Biotechnol Adv. 2013;31:482–488. doi: 10.1016/j.biotechadv.2013.01.010. [DOI] [PubMed] [Google Scholar]
- 21.Fanning S, Hall LJ, Cronin M, Zomer A, MacSharry J, Goulding D, et al. Bifidobacterial surface-exopolysaccharide facilitates commensal-host interaction through immune modulation and pathogen protection. Proc Natl Acad Sci USA. 2012;109:2108–2113. doi: 10.1073/pnas.1115621109. [DOI] [PMC free article] [PubMed] [Google Scholar]
- 22.Larsen CN, Nielsen S, Kaestel P, Brockmann E, Bennedsen M, Christensen HR, et al. Dose-response study of probiotic bacteria Bifidobacterium animalis subsp lactis BB-12 and Lactobacillus paracasei subsp paracasei CRL-341 in healthy young adults. Eur J Clin Nutr. 2006;60:1284–1293. doi: 10.1038/sj.ejcn.1602450. [DOI] [PubMed] [Google Scholar]
- 23.Hascoet JM, Hubert C, Rochat F, Legagneur H, Gaga S, Emady-Azar S, et al. Effect of formula composition on the development of infant gut microbiota. J Pediatr Gastroenterol Nutr. 2011;52:756–762. doi: 10.1097/MPG.0b013e3182105850. [DOI] [PubMed] [Google Scholar]
- 24.Sekirov I, Tam NM, Jogova M, Robertson ML, Li Y, Lupp C, et al. Antibiotic-induced perturbations of the intestinal microbiota alter host susceptibility to enteric infection. Infect Immun. 2008;76:4726–4736. doi: 10.1128/IAI.00319-08. [DOI] [PMC free article] [PubMed] [Google Scholar]


