Abstract
Traumatic brain injury (TBI) is a major cause of epilepsy, yet the mechanisms underlying the progression from TBI to epilepsy are unknown. TBI induces the expression of COX-2 (cyclooxygenase-2) and increases levels of prostaglandin E2 (PGE2). Here, we demonstrate that acutely applied PGE2 (2 μm) decreases neocortical network activity by postsynaptically reducing excitatory synaptic transmission in acute and organotypic neocortical slices of mice. In contrast, long-term exposure to PGE2 (2 μm; 48 h) presynaptically increases excitatory synaptic transmission, leading to a hyperexcitable network state that is characterized by the generation of paroxysmal depolarization shifts (PDSs). PDSs were also evoked as a result of depriving organotypic slices of activity by treating them with tetrodotoxin (TTX, 1 μm; 48 h). This treatment predominantly increased postsynaptically excitatory synaptic transmission. The network and cellular effects of PGE2 and TTX treatments reversed within 1 week. Differences in the underlying mechanisms (presynaptic vs postsynaptic) as well as occlusion experiments in which slices were exposed to TTX plus PGE2 suggest that the two substances evoke distinct forms of homeostatic plasticity, both of which result in a hyperexcitable network state.
PGE2 and TTX (alone or together with PGE2) also increased levels of apoptotic cell death in organotypic slices. Thus, we hypothesize that the increase in excitability and apoptosis may constitute the first steps in a cascade of events that eventually lead to epileptogenesis triggered by TBI.
Introduction
Homeostatic plasticity is critical for maintaining stability in neuronal networks involved in various physiological processes, including neurodevelopment (Chandrasekaran et al., 2007) and learning and memory (Nelson and Turrigiano, 2008). In response to changes in synaptic strength, homeostatic plasticity reestablishes a fine balance between excitation and inhibition. In general, increased activity leads to downregulation, whereas decreased activity leads to upregulation in excitatory synaptic transmission (O'Brien et al., 1998; Turrigiano et al., 1998). But homeostatic mechanisms can also include alterations in synaptic inhibition (Maffei et al., 2006; Stellwagen and Malenka, 2006) or shifts in intrinsic excitability (Desai et al., 1999; Aizenman et al., 2003). Consistent with a homeostatic response, activity deprivation in hippocampal slice cultures leads to increased excitatory synaptic transmission (Trasande and Ramirez, 2007). But long-term activity deprivation strengthened excitatory synapses to the extent that the hippocampal network generated seizure-like activity, revealing a potentially dark side of homeostatic regulation (Trasande and Ramirez, 2007). Indeed other reports are consistent with the notion that epileptogenesis may be an unwanted consequence of homeostatic plasticity (Houweling et al., 2005; Avramescu and Timofeev, 2008).
A connection between homeostatic plasticity and epilepsy could be particularly relevant for traumatic brain injury (TBI), which is a major cause of epilepsy (Topolnik et al., 2003; Nita et al., 2006; Avramescu and Timofeev, 2008). Among the general population, ∼15% of patients that suffer from severe brain trauma may develop chronic seizures (Salazar et al., 1985; Annegers and Coan, 2000).This is particularly alarming because an increasing number of soldiers returning from war experience TBI (Warden, 2006).
Here, we tested the hypothesis that TBI leads to a homeostatic response that constitutes the first step in a process that will eventually result in seizures and epilepsy. A prominent second messenger pathway activated after TBI, seizures, infection, or physical injury involves the enzyme cyclooxygenase-2 (COX-2) or PGH (prostaglandin H) synthase, an inducible enzyme, which is highly regulated by neuronal activity (Yamagata et al., 1993). One of the major metabolic products of this enzyme is prostaglandin E2 (PGE2). These enzymes are highly expressed in the postsynaptic spines of excitatory cortical neurons (Kaufmann et al., 1996). COX-2 and PGE2 are also involved in synaptic signaling and long-term plasticity (Chen and Bazan, 2005; Akaneya and Tsumoto, 2006; Yang et al., 2008). PGE2 increases excitatory synaptic transmission in the hippocampus (Sang et al., 2005), whereas it inhibits inhibitory synaptic transmission in the spinal cord (Ahmadi et al., 2002).
Here, we report that PGE2 reduces excitatory synaptic transmission and depresses network activity when applied acutely in neocortical slices. In contrast, long-term exposure to PGE2 leads to a hyperexcitable network state displaying paroxysmal depolarization shifts (PDSs). Similarities between the long-term effects of PGE2 and those of other forms of activity deprivation suggest that the PDSs are the result of a homeostatic response that may lead to epileptogenesis. Our finding is also consistent with activity-dependent changes seen in partially isolated cortex models (Prince and Tseng, 1993), in which local activity deprivation produced hyperexcitable foci in the cortex.
Materials and Methods
Acute slice preparation.
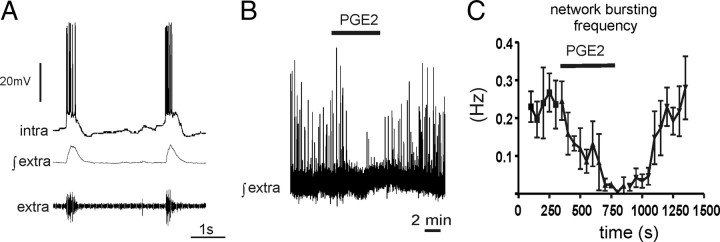
Postnatal days 15 to 25 (P15–P25) male or female CD-1 mice were deeply anesthetized by using isoflurane and decapitated at the C3/C4 spinal level, and the forebrain was isolated in ice-cold artificial CSF (ACSF). One hemisphere was then glued onto an agar block with its rostral end up and mounted onto a vibrating tissue slicer (Leica; VT1000S). Coronal slices of the somatosensory cortex (500 μm) were transferred into a recording chamber and submerged under a stream of ACSF (temperature, 30°C; flow rate, 10 ml/min) containing (in mm) 118 NaCl, 3 KCl, 1.5 CaCl2, 1 MgSO4, 25 NaHCO3, 1 NaH2PO4, and 30 d-glucose equilibrated with carbogen (95% O2; 5% CO2). As described previously (van Drongelen et al., 2003, 2006), network bursting can be induced in acute isolated neocortical slices from mice by raising potassium concentrations to 5 mm (see Fig. 4).
Figure 4.
In acute cortical slices PGE2 (2 μm) inhibits network activity. A, In acute cortical slices, network bursting was induced by raising the potassium chloride concentration to 5 mm. B, C, PGE2 (bath application) reduced the frequency of network bursting activity.
Organotypic neocortical slice cultures.
Neocortical slice cultures were prepared from CD-1 mice (P4–P6). Mice were anesthetized with isoflurane and decapitated, and the neocortex was rapidly isolated and placed in Gey's balanced salt solution (Sigma-Aldrich) supplemented with d-glucose (6.5 mg/ml, Sigma-Aldrich) and chilled to 4°C. The brain was divided into two hemispheres and placed on 3.5% agar-coated Teflon plates and cut coronally into 450-μm-thick slices using a McIlwain tissue chopper (Warner Instruments). Cortical slices were transferred to uncoated 30 mm Millicell-CM tissue culture inserts with 0.4 μm pores (Millipore) in six-well culture dishes (BD Biosciences). Culture media containing Basal Medium Eagle (50%), Earle's balanced salt solution (25%), horse serum (23%), 10 μg/ml gentamicin, 1 mm l-glutamine, and 42 mm glucose (Sigma-Aldrich) were added to the bottom of each well and replaced every 2–3 d. Cultures were maintained at 37°C with 5% CO2 balanced humidified air in a standard water jacketed incubator (Thermo Scientific). Slices were maintained in vitro for 14–40 d before electrophysiological recordings.
Extracellular population recordings.
To obtain a signal containing multiunit action potential (AP) activity, extracellular signals were amplified 10,000-fold and filtered between 0.25 and 1.5 kHz. To facilitate detection of up states, this signal was rectified and integrated by using an electronic integrator with a time constant of 50 ms. Both the extracellular recording and the integration were performed with custom-built electronics.
Intracellular whole-cell recordings.
The recording electrodes had a resistance of 3–5 MΩ when filled with the whole-cell patch-clamp pipette solution containing the following (in mm): 140 K-gluconic acid, 1 CaCl2 · 6H2O, 10 EGTA, 2 MgCl2 · 6H2O, 4 Na2ATP, and 10 HEPES, pH 7.2. The intracellular pipettes contained biocytin (4.5 mg/ml) to identify the location and morphology of the neurons. Intracellular current-clamp recordings were obtained from cortical neurons with the blind-patch technique or the visual-patch technique. In the blind-patch technique, electrodes with a positive pressure of 35–50 mmHg were advanced into the slice in 10 μm steps using a manually driven micromanipulator (Leitz). As the electrode approached the cell, the measured electrode resistance increased. To obtain a gigaseal, we removed the positive pressure and applied negative suction. The recordings were low-pass filtered (0–2 kHz, Bessel four-pole filter, −3 dB).
By using the visual-patch technique, neurons of the deep layers were visually identified (Zeiss Axioskop 2 FS microscope with IR-DIC). Whole-cell patch-clamp recordings were obtained with a sample frequency of 10 kHz and a low-pass filter setting of 2 kHz. Recordings were made with unpolished patch electrodes manufactured from borosilicate glass pipettes with filament (Warner Instruments G150F-4). The patch-clamp experiments were performed with a patch-clamp amplifier (AxoPatch 1D), a digitizing interface (Digidata 1322A), and the software program pClamp 9.2 (Molecular Devices). Neurons located directly at the slice surface were not examined because they were more likely to be severely damaged during the preparation than were neurons located deeper within the slice. Furthermore, recordings with obvious space clamp problems were discarded (Armstrong and Gilly, 1992). Poor space clamping was indicated by rebound spikes (rapid, fast inactivating inward currents, which were induced by steps from depolarizing test potentials to the former holding potential). After recording, the slices were placed in neutral buffered formalin 3.7% solution for subsequent staining procedures.
Quantification of up state activity.
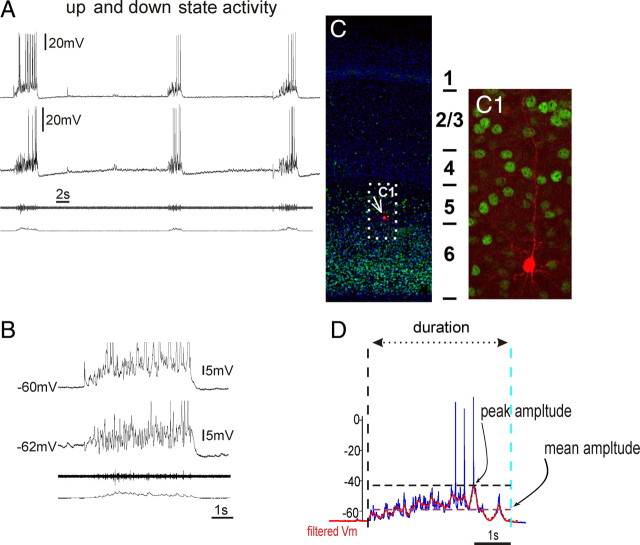
To quantify the up and down state activity of the organotypic slice cultures, the intracellular membrane potential recordings were analyzed using custom routines written in MATLAB 7.2 (The MathWorks). First, slow DC drift was eliminated by detrending the entire recording with a fourth-order polynomial fit. Candidate up states were then identified by threshold crossings of a low-pass filtered version of the membrane potential trace (second-order Butterworth filter with a corner frequency of 0.5 Hz). The threshold was defined adaptively as half of the standard deviation of the baseline membrane potential noise during periods between up states. Recording artifacts and threshold crossings, which defined a candidate up state that was <250 ms in duration, were not included in the subsequent analysis. Action potential deflections were eliminated from membrane potential recordings by low-pass filtering (second-order Butterworth filter with a corner frequency of 5 Hz) before calculation of the following parameters for the identified up states in each recording: (1) peak amplitude, (2) mean amplitude, (3) duration, and (4) frequency (see Fig. 1D). Statistical analysis was performed with Prism 5.01 (GraphPad). The significance of differences among the three groups was assessed with a one-way ANOVA and a Bonferroni multiple-comparisons post hoc test.
Figure 1.
Spontaneous up and down states were recorded from organotypic slices cultured between 14 and 40 DIV. A, Example of a simultaneous extracellular population and dual intracellular recording of cortical neurons exhibiting synchronized activity during up state activity. B, Expanded time base. The amplitudes of intracellularly recorded up states were characterized by the maximum depolarization (peak amplitude) and mean depolarization (mean amplitude) from the down state baseline membrane potential in traces that had been stripped of action potentials by low-pass filtering (D; see Materials and Methods). C, The structural anatomy of organotypic slices showed typical laminar architecture of the cortex (note the Tbr1 staining of the deep layer) (Hevner et al., 2001). C1, The biocytin staining of a recorded layer 5 pyramidal cell.
Evoked EPSPs.
In acute or organotypic slices, EPSPs were recorded in cortical layer 5 pyramidal neurons and evoked by a bipolar stimulation electrode placed in the superficial layers (2/3). The EPSPs were evoked at a frequency of 0.1 Hz with a brief stimulus (0.1 μs,10–300 μA) and 50 EPSPs were recorded to observe a stable baseline before bath application of drugs. Statistical analysis was performed with Prism 5.01 (GraphPad). The significance of differences between data values was assessed with the Student's t test and assumed when p < 0.05.
Miniature EPSCs.
We eliminated AP-evoked synaptic events by adding 1 μm TTX to the ACSF. Miniature EPSCs (mEPSCs) were recorded and digitized for a period of 5 min per data file. Signals were sampled with a frequency of 10 kHz (filtered at 2 kHz) at a holding potential (Vh) of −60 mV and stored for subsequent analysis. Considering equilibrium-potential-to-holding-potential relationships, all upward deflections had to be chloride-conducting, inhibitory currents, whereas all downward deflection had to be mEPSCs. To ensure steady drug concentration equilibrium in the recording chamber, a 4 min preapplication of PGE2-containing solution was performed before the start of the actual 5 min data recording that was used for the later analysis. Data were analyzed by using MiniAnalysis 5.41 (Synaptosoft) and statistical analysis was performed with Prism 5.01 (GraphPad). A computerized preanalysis of each 5 min recording was performed to tag all events that qualified as mEPSCs according to the user-defined, program-specific detection parameters. However, an additional manual screening of each data trace was necessary to eliminate detection errors. During this process, incorrectly tagged artificial events were unmarked and missed real mEPSCs events were tagged. To determine the representative amplitude and decay time of the recorded mEPSCs in each data trace, an average mEPSC from 50 single mEPSCs was created as follows: For each 5 min data trace, the computer randomly picked 75 single events. Those events were superimposed and aligned at 50% rise time. Single events that did not line up within a rise-time window of 4 ms were manually eliminated. In addition, the decay phase of each event had to steadily decay without any interruption by additional events or noise for 50 ms. This procedure was followed until 50 events were included into the average. A computerized single-exponential fit through the decay phase (10–90%) of the average mEPSC delivered a representative amplitude and decay time constant (τ). Statistical analysis was performed with Prism 5.01 (GraphPad). The significance of differences between data values was assessed with the Student's t test and assumed when p < 0.05.
Immunofluorescence.
Free-floating organotypic slices were washed thoroughly in PBS/0.1% Triton X-100. Double-label immunofluorescence assays were done routinely as described previously (Hodge et al., 2008). Blocking solution, consisting of PBS with 0.1% Triton X-100 (PBS-T), 10% normal donkey serum was applied to slides for 1 h at room temperature. Slides were then incubated overnight at 4°C with primary antibodies (listed below), rinsed in PBS for 1 h, and then incubated for 1 h at room temperature with fluorescent secondary antibodies (Alexa Fluor, Invitrogen). Sections were rinsed in PBS for 1 h, counterstained with DAPI (0.01%, Invitrogen), and mounted on slides before coverslipping. The following primary antibodies were used: rabbit polyclonal anti-Tbr1 (1:1500, R.F.H. laboratory) and rabbit anti-active-caspase-3 (1:500, Cell Signaling Technology catalog number 9661). Secondary antibodies were conjugates of Alexa Fluor 488 and 568 (1:500, Invitrogen).
Cell counts.
Cell counts were conducted on three individual slices per treatment group. For each slice, the area of the cerebral cortex was measured using a Zeiss Axioimager Z1 microscope with Axiovision v4.7 software. Cells immunolabeled with rabbit anti-active-caspase-3 antibody were counted within the traced area on each slice. The density (in cells per square millimeter) of active caspase-3-positive cells was determined by dividing the total number of immunolabeled cells by total cortical area. The significance of differences among three groups was assessed with a one-way ANOVA test and a Bonferroni multiple-comparisons post hoc test.
Results
Activity of organotypic cortical slice cultures
All neocortical organotypic slices cultured for 14–40 d in vitro (n = 34) revealed spontaneous rhythmic up and down states as described previously (Johnson and Buonomano, 2007). Up and down states have also been reported in acute slices (Sanchez-Vives and McCormick, 2000; Reig and Sanchez-Vives, 2007) and in vivo in anesthetized animals (Contreras and Steriade, 1995; Haider et al., 2006) and during sleep (Steriade, 2001; Timofeev et al., 2001; Mahon et al., 2006; Okun et al., 2010).
In our study, up states were characterized by a sudden membrane depolarization, increased firing rate, and increased variability of the membrane potential (Fig. 1A,B). Up states were followed by down states that were characterized by membrane hyperpolarization, decreased firing rate, and decreased membrane potential variability of the recorded cells (Fig. 1A,B). On average, the peak amplitude of the up states was 24.61 ± 10.55 mV with a mean amplitude of 10.57 ± 4.19 mV; they occurred at a frequency of 0.057 ± 0.048 Hz and lasted 5.09 ± 2.98 s. During our investigations, we did not observe action potential firing during the down state in untreated controls. However, occasionally subthreshold synaptic events occurred, such as those seen in Figure 1A. Because occasional synaptic events have not been described in vivo, conceivably, such events are an artifact of the in vitro preparation.
Effects of TTX treatment (48 h) on network and cellular activity in organotypic slices
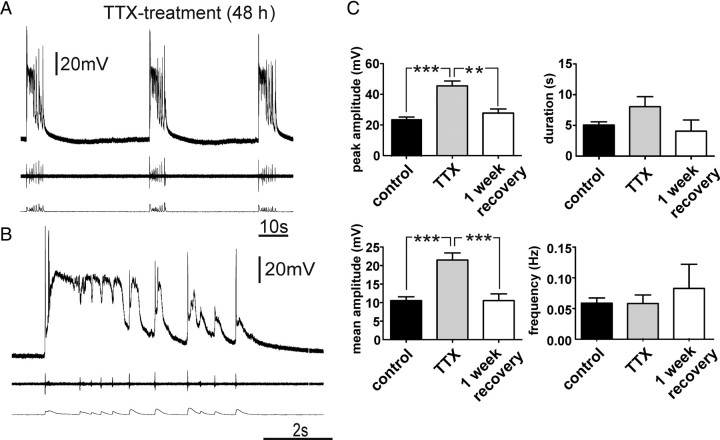
We first examined whether activity deprivation in neocortical slice cultures evoke homeostatic responses and seizure-like activity as previously reported in the hippocampus (Trasande and Ramirez, 2007). This was accomplished by adding TTX (1 μm) to the culture medium 48 h before recording. After the treatment, organotypic slices were transferred into the recording chamber and washed with 100 ml of aCSF before performing the experiments. Current-clamp recordings (n = 15) revealed that the TTX treatment changed the characteristics of the recorded activity into high-amplitude PDSs (Fig. 2A,B). The peak and mean amplitudes underlying the PDS-up states were significantly higher than the values of the control group (Fig. 2C), whereas the duration of the PDS-up states was not significantly longer and the frequency did not significantly change compared with the up states of the control group. After a 1 week recovery period, the peak and mean amplitude measures of the up state events were similar to those of control cultures (Fig. 2C).
Figure 2.
TTX treatment of organotypic slice cultures induced PDS-up states. A, B, Up states of TTX-treated slices had the characteristics of PDSs, displaying depolarization block during the recurring network activity (B). C, The peak and mean amplitude of the up states in the TTX-treated group were significantly higher than these values for up states in the control group, whereas the duration and frequency were not significantly different. After a 1 week recovery period, these values returned to values similar to the control group (one-way ANOVA **p < 0.01, ***p < 0.001).
Amplitude of mEPSCs increases after TTX treatment (48 h)
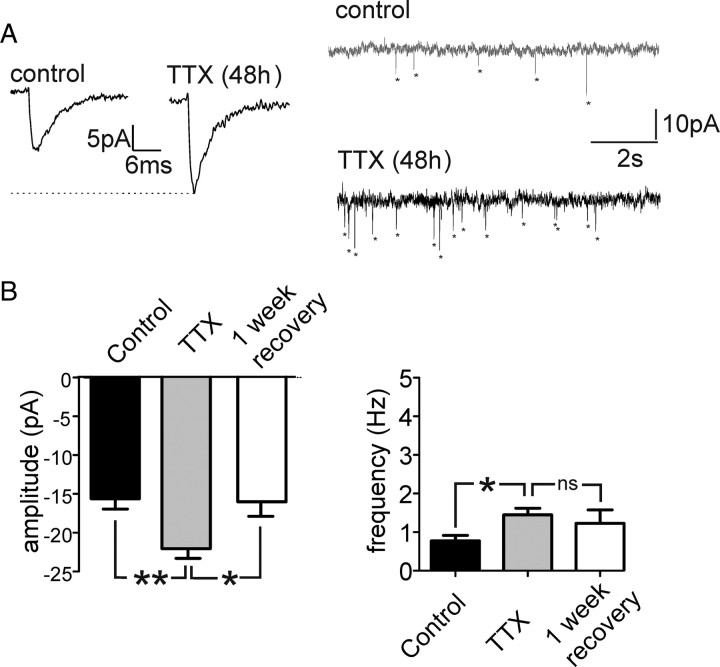
To determine whether the changes in network activity in TTX-treated slices were caused by changes in excitatory synaptic transmission, we recorded mEPSCs of cortical neurons (n = 25). The amplitudes of mEPSCs recorded from neurons after TTX treatment (n = 10) were significantly higher than those from control slices (n = 9) and returned to values similar to control after a 1 week recovery period (n = 6) (Fig. 3A,B). The frequency of mEPSCs was slightly higher in TTX-treated cultures than the frequency of mEPSCs in control cultures (Fig. 3A,B) and decreased again after a 1 week recovery period. The decay time of mEPSCs in all treatment groups showed no significant difference (data not shown). These data suggest that the neocortical slice responds to activity deprivation with a homeostatic response involving a predominantly postsynaptic increase in excitatory synaptic transmission.
Figure 3.
Amplitude and frequency of mEPSCs were increased in TTX-treated slices compared with control. A, B, The amplitude and frequency of recorded mEPSCs from TTX-treated cultures were significantly higher than those from the untreated control slices (**p < 0.01,*p < 0.05) and returned to values similar to the control after 1 week of recovery (one-way ANOVA).
Acute PGE2 application reduces the frequency of up states in acute and organotypic slice cultures
To evoke spontaneous network bursting activity in acute neocortical slices, we raised the extracellular potassium concentration to 5 mm as described previously (van Drongelen et al., 2003, 2006). Bath application of PGE2 (2 μm) reduced the frequency of spontaneous network busting activity (Fig. 4C) (n = 5), and when exposed for longer than 500 s, PGE2 stopped network bursting altogether in the majority of cases (4 of 5) (Fig. 4B). Sulprostone (2 μm), a PGE2 agonist specific for the EP3 receptor (n = 4), also suppressed network bursting activity and reduced the frequency from 0.15 ± 0.19 Hz to 0.01 ± 0.01 Hz, while a 2 μm concentration of the EP2 receptor agonist butaprost did not affect network busting activity (n = 4, data not shown).
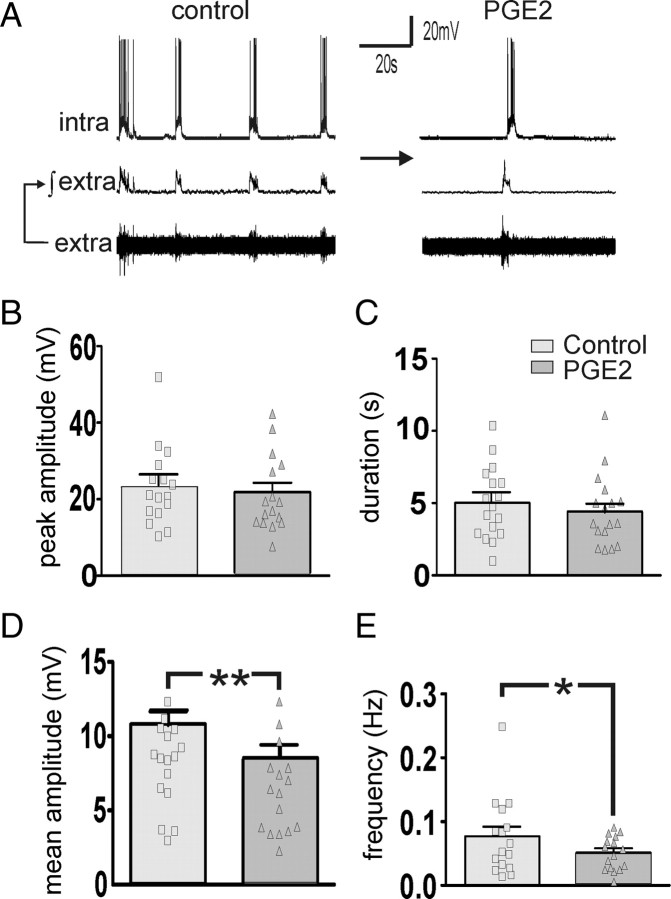
In organotypic neocortical slice cultures, PGE2 (2 μm) decreased the frequency and the mean amplitude of the up states, whereas the peak amplitude and duration of the recorded up states remained unaffected compared with baseline (n = 16; p < 0.01 paired t test) (Fig. 5).
Figure 5.
Bath application of PGE2 (2 μm) (A) reduced the mean amplitude (D) and the frequency (E) of the up states, whereas the peak amplitude (B) and the duration (C) were not significantly affected (paired t test, **p < 0.001, *p < 0.05).
Acute PGE2 application leads to an inhibition of excitatory synaptic transmission in acute and organotypic slice cultures
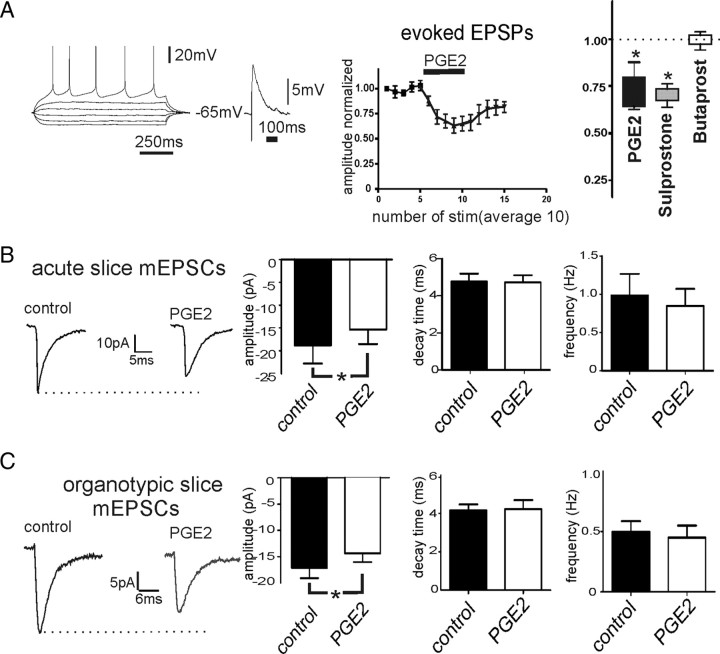
In acute neocortical slices, EPSPs were electrically evoked in cortical layer 5 neurons by stimulating superficial layers at a frequency of 0.1 Hz (n = 16). Bath application of PGE2 significantly reduced the amplitude of evoked EPSPs from 5.35 ± 1.60 mV to 3.72 ± 1.56 mV (Fig. 6A) (n = 6, p < 0.05). In addition, sulprostone (2 μm) reduced the amplitude of evoked EPSPs from 6.76 ± 2.43 mV to 4.79 ± 1.74 mV (n = 5, p < 0.05), while butaprost 2 μm did not effect the amplitude of evoked EPSPs (n = 4, p = 0.71) (Fig. 6A). To further investigate whether synaptic transmission was affected at the presynaptic or postsynaptic site, mEPSCs were measured before and after bath application of PGE2 (n = 7). The amplitude, frequency, and decay time of the mEPSCs were quantified as described in Materials and Methods. Bath application of PGE2 decreased the amplitude of mEPSCs (p < 0.05, paired t test) (Fig. 6B), whereas the frequency and decay time were not significantly altered in acute cortical slices.
Figure 6.
Acute effects of PGE2 bath application on excitatory synaptic transmission. A, PGE2 decreased EPSPs measured in intracellular recordings of layer 5 neurons (n = 6, *p < 0.05, paired t test). Bath application of sulprostone (EP3 agonist, 2 μm), but not butaprost (EP2 agonist, 2 μm), decreased the amplitude of EPSPs significantly compared with control (n = 5, *p < 0.05, paired t test). B, C, PGE2 reduced the amplitude of miniature EPSCs, whereas decay time and frequency were unaltered in acute (B, n = 7, *p < 0.05, paired t test) and organotypic (C, n = 8, *p < 0.05, paired t test) slices.
Next, we measured the acute effects of PGE2 (2 μm) on mEPSCs in organotypic slice cultures (n = 8). Bath application of PGE2 significantly decreased the amplitude of mEPSCs (Fig. 6C) (p < 0.05, paired t test), whereas the frequency and decay time of the mEPSCs were not significantly different after exposure to PGE2.
We conclude that PGE2 postsynaptically inhibits excitatory synaptic transmission in acute and organotypic slice cultures. This inhibitory effect seems to result in the inhibition of network activity observed in acute and organotypic slice cultures.
Effects of PGE2 treatment (48 h) on network and cellular activity in organotypic slices
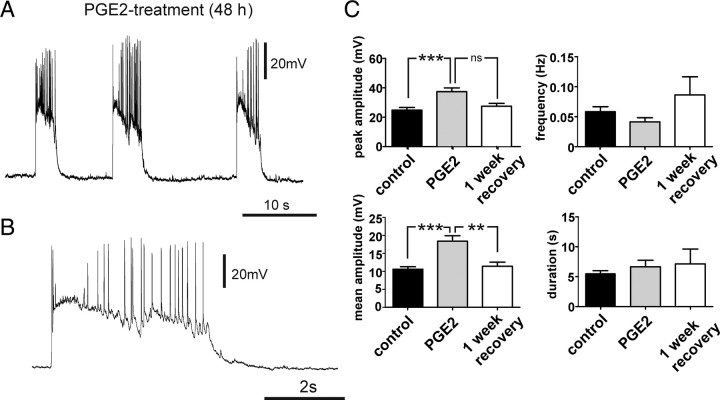
We tested next the effects of long-term exposure (48 h) to PGE2 (2 μm) on up state activity in organotypic slices cultures directly after treatment (n = 15) and after 1 week of recovery (n = 9). The peak and mean amplitude of PDS-up states in the PGE2-treated group were significantly higher than the amplitude of those recorded from the control group (Fig. 7B) (p < 0.001). After a 1 week recovery, the peak amplitude and the mean amplitude decreased to values similar to those of the control group (Fig. 7B). The frequency and duration of the up states were not significantly affected by PGE2 treatment (Fig. 7B,C).
Figure 7.
A, B, PGE2 treatment (48 h) increases network excitability and induced PDS-up states. C, After 48 h exposure to PGE2, the peak amplitude and mean amplitude of the measured up states were significantly increased compared with the control group (***p < 0.001, **p < 0.01), whereas the frequency and duration of the observed up states did not change significantly. After a 1 week recovery period, the values returned to values similar to the control group.
Increase of frequency of mEPSCs after PGE2 treatment (48 h)
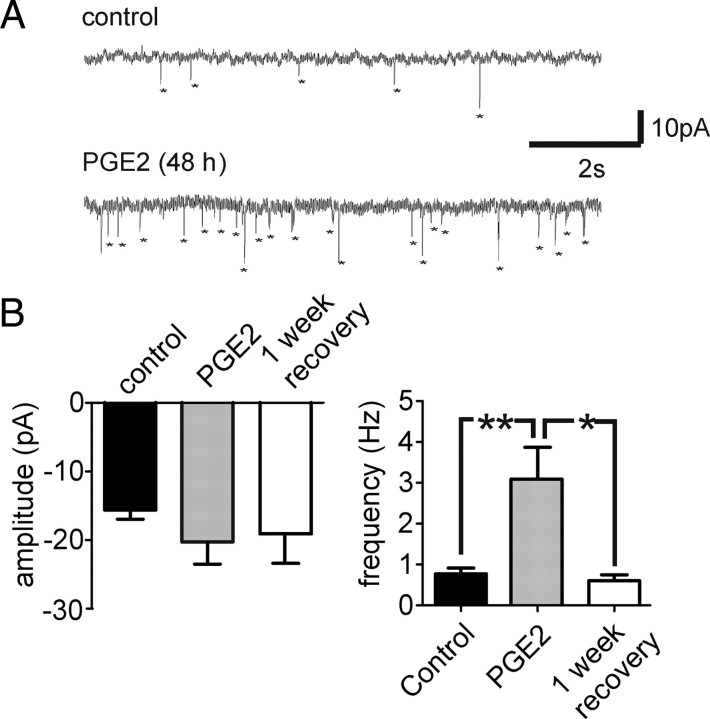
In (n = 8) cortical neurons of organotypic slices treated with PGE2, mEPSCs were recorded and compared with untreated organotypic slice cultures. The amplitude of mEPSCs was not significantly affected when examined with a one-way ANOVA test (Fig. 8A,B). The frequency of mEPSCs was significantly higher in PGE2-treated slices than in the untreated control group (Fig. 8B) and returned to values similar to the control after a 1 week recovery period. The decay time did not differ significantly between any groups (Fig. 8B).
Figure 8.
Long-term exposure to PGE2 altered the excitatory synaptic transmission of cortical neurons in organotypic slice cultures. A, B, The frequency of the mEPSCs was significantly higher than from an untreated control group (**p < 0.05) and returned to values similar to control after a 1 week recovery period, whereas the amplitude was not significantly different between the groups.
TTX+PGE2 treatment (48 h) had a synergistic effect on the network and cellular activity in organotypic slices
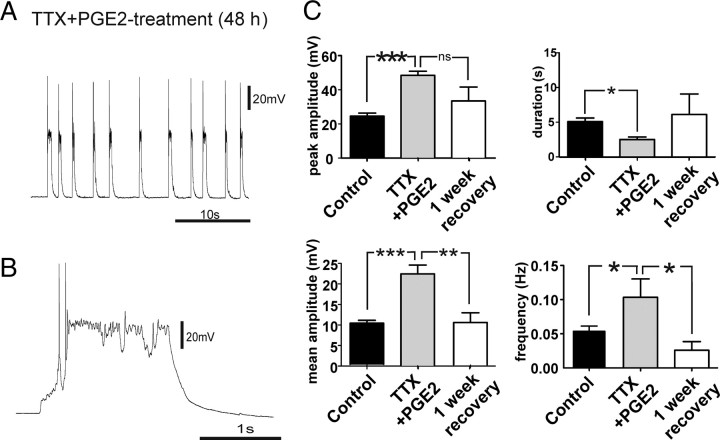
To examine whether PGE2-induced synaptic changes involved similar homeostatic mechanisms, we performed occlusion experiments by using a combined exposure to PGE2+TTX (48 h). Organotypic slice cultures exposed to TTX+PGE2 also showed PDS-up states. The peak and mean amplitude increased significantly compared with the up states of the control group (Fig. 9C). After PGE2+TTX treatment, the frequency of PDS-up states was increased, whereas the duration was significantly decreased, compared with the up states of the control group (Fig. 9C). After a 1 week recovery period, values of mean and peak amplitude, frequency, and duration of the up states were not statistically different from those of the control group (Fig. 9C). We conclude that the effects of PGE2 and TTX treatment (48 h) involve different forms of homeostatic plasticity, because additional effects on frequency and duration of PDS-up states were observed when both substances were combined.
Figure 9.
TTX+PGE2 (48 h) treatment has cumulative effects on spontaneous network activity. A–C, After 48 h exposure to TTX+PGE2, the peak and mean amplitude of the measured up states were significantly increased compared with the control group (***p < 0.001). C, In addition, a significant increase in the frequency (*p < 0.05) and a decrease in the duration of the up states (*p < 0.05) were observed.
Effects on mEPSCs after combined TTX+PGE2 treatment
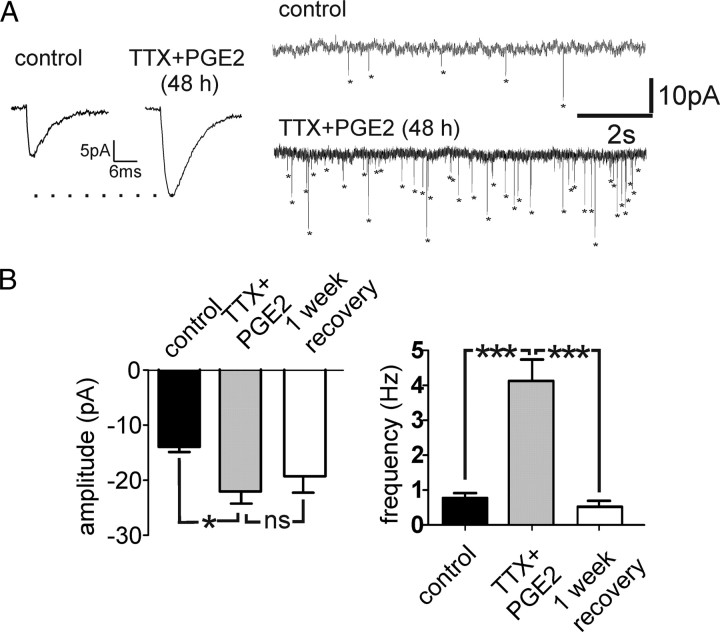
The amplitude of mEPSCs was significantly increased in slices exposed to TTX+PGE2 when compared with mEPSCs recorded in control slices (Fig. 10B) (p < 0.05). The amplitude increase was similar to the increase observed in slices exposed to TTX alone. After a 1 week recovery period, the values were not fully recovered, but they tended toward smaller values: they were significantly different neither from controls nor from the exposed group. In the combined TTX+PGE2-exposed slices, the frequency of mEPSCs was significantly elevated compared with the control (Fig. 10B) (p < 0.001). After a 1 week recovery period, the frequency of mEPSCs returned to values similar to control cultures (Fig. 10B) (p < 0.001).
Figure 10.
TTX+PGE2 treatment (48 h) altered the excitatory synaptic transmission (A). The amplitude and frequency of the mEPSCs were significantly higher than those from an untreated control group (*p < 0.05, ***p < 0.001) and returned to values similar to control after a 1 week recovery period (B).
Chronic PGE2 and TTX exposure increased cell apoptosis in organotypic slice cultures
To determine whether TTX or PGE2 treatment increases cell death, we used immunofluorescence staining for active caspase-3, which is activated during apoptosis. Organotypic slice cultures [9–14 d in vitro (DIV)] were treated for 48 h with normal medium, TTX (1 μm), or PGE2 (2 μm) before immunofluorescence staining. The density (in cells per square millimeter) of active caspase-3-positive cells was significantly increased in slices treated with either TTX or TTX+PGE2 compared with the control slices throughout all cortical layers (Fig. 11; **p < 0.01, ***p < 0.001; n = 3 for each group), and the PGE2-treated cultures tended toward an increased apoptosis level, but the potential effect was statistically not significant (Fig. 11) (n = 3). The density (in cells per square millimeter) of active caspase-3-positive cells was also significantly increased in slices treated with TTX+PGE2 compared with groups exposed to PGE2 alone (Fig. 11; ###p < 0.001) or when compared with slices exposed to TTX alone (Fig. 11; ‡p < 0.05).
Figure 11.
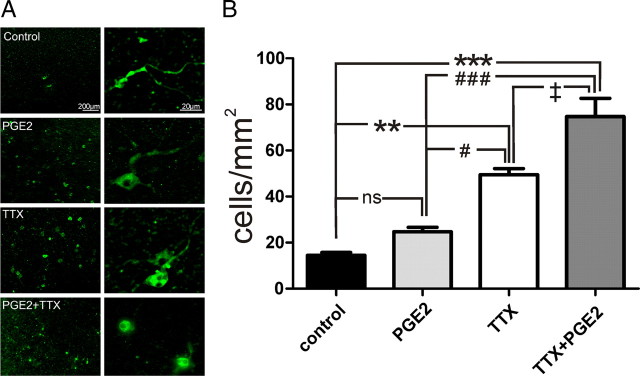
Chronic exposure of organotypic slice cultures to PGE2 or TTX induced increased apoptosis. A, Examples of staining for active caspase-3 in cortical layers revealed increased cell death in PGE2- and TTX-treated or TTX+PGE2-treated organotypic slice cultures. B, Quantification of caspase-3-positive cells/mm2 showed a significantly higher number of cells in TTX- and TTX+PGE-treated cultures than in control (**p < 0.01, ***p < 0.001) and significantly higher amount of labeled cells in the TTX+PGE2-treated cultures than in the cultures treated with one drug (#p < 0.05, ###p < 0.001, ‡p < 0.05).
Discussion
In this study, we report that activity deprivation with TTX led to a homeostatic response that produced a predominantly postsynaptic upregulation of excitatory synaptic transmission. This synaptic effect contributed to the transformation of spontaneously generated up states into paroxysmal depolarizations. Activity deprivation with TTX affected only the amplitude (peak and mean) but not duration or frequency of up states. PGE2, the major reaction product of inducible COX-2 enzymes, acutely inhibited network activity by postsynaptically inhibiting excitatory synaptic transmission. PGE2 treatment led to a similar transformation of the spontaneous network activity into PDS-up states and also to an increase in excitatory synaptic transmission. However, the upregulation of excitatory synaptic transmission after the PGE2 treatment seemed to be predominantly presynaptic and was reflected in an increase in the frequency of mEPSCs.
Conceivably, a floor effect contributed to the measured increase in mEPSC frequency as a result of PGE2/TTX treatment, i.e., by increased detection of events that were previously too small to rise above the detection threshold. However, we assume that the contribution of a floor effect cannot explain the dramatic frequency increase observed in response to PGE2 and PGE2/TTX treatment. Previous studies reported that TTX alone causes an increase in the amplitude of mEPSCs without leading to an increase in the frequency of mEPSCs (Turrigiano et al., 1998; Stellwagen and Malenka, 2006). The relatively small frequency increase that we observed in response to TTX treatment alone may therefore be explained by a floor effect.
Occlusion experiments in which slices were exposed to a combination of TTX+ PGE2 suggest that the TTX-induced activity deprivation and the PGE2-evoked effects involve different homeostatic mechanisms. We observed additional network effects on frequency and duration of PDS-up states when compared with slices exposed to TTX and PGE2 in separate experiments. This is corroborated by the increase in both amplitude and frequency of mEPSCs (Fig. 10) and a significantly higher active caspase-3 staining (apoptosis) in the slice exposed to TTX+PGE2 than in slices that were exposed to TTX or PGE2 alone (Fig. 11). We conclude that activity deprivation and PGE2 treatment activate parallel homeostatic pathways that increase excitatory synaptic transmission via different mechanisms. Our experiments indicate that TTX treatment leads predominantly to an increase in amplitude of mEPSCs. This could be caused by the following postsynaptic mechanisms: (1) a change in the state of existing glutamate receptors resulting from phosphorylation (McGlade-McCulloh et al., 1993), (2) an insertion of previously inactive glutamate receptors (AMPA) into the postsynaptic membrane (Newpher and Ehlers, 2008; Kessels and Malinow, 2009), and/or (3) a synthesis of new receptors and insertion in the postsynaptic membrane (Liang and Jones, 1997). However, minianalysis cannot exclude the possibility that TTX caused a presynaptic change in vesicular neurotransmitter content leading to activation of a larger number of receptors. Yet, previous studies of homeostatic plasticity strongly suggest that TTX-induced synaptic scaling is mediated by postsynaptic changes (Turrigiano et al., 1998). PGE2 treatment, on the other hand resulted predominantly in an increase in mEPSC frequency. This effect can only be explained presynaptically by (1) an increased number of vesicles leading to an increased probability of spontaneous neurotransmitter release, and (2) an increased number of synaptic connections to a given neuron. The concept that network plasticity and stability can involve multiple homeostatic mechanisms is consistent with studies obtained in microcircuits of the visual cortex (Maffei and Turrigiano, 2008).
In addition to changes in excitatory synaptic transmission, homeostatic mechanisms can also involve alterations in synaptic inhibition and shifts in the intrinsic excitability of neurons (Desai et al., 1999; Aizenman et al., 2003). The present study focused only on a detailed characterization of excitatory synaptic changes associated with TTX and PGE2 treatment. However, we cannot rule out that additional changes in intrinsic excitability also contribute to the observed phenomena. Although our preliminary current injection experiments into layer 5 pyramidal neurons (data not shown) suggest that intrinsic excitability was not consistently affected by either of the pharmacological treatments reported in this study, it is possible that different subtypes of neocortical neurons are differentially affected by these treatments. These treatments may possibly affect inhibitory neurons, which in turn could result in changes in synaptic inhibition, aspects that were not investigated in the present study.
Homeostatic responses have been reported to occur when neocortical neurons are silenced (Turrigiano et al., 1998; Davis and Bezprozvanny, 2001; Wierenga et al., 2006), and this is generally accepted as an important regulatory response that keeps neurons in their physiological firing range. So far, not much is known about the molecular pathways that control homeostatic plasticity. Interestingly, TNF-α, a molecule upstream of COX-2 expression, has been reported to be critical for homeostatic plasticity, and a direct involvement of inflammation pathways in the scaling of synaptic transmission has been suggested (Beattie et al., 2002; Stellwagen and Malenka, 2006).
In this study, we show that PGE2, the main metabolite of the COX-2 pathway, can also lead to a homeostatic response. Thus, this homeostatic response might constitute the first event that occurs within 48 h after an insult. It has been shown that COX-2 expression in the brain is elevated within 30 min of a traumatic event (Yamagata et al., 1993), and COX-2 is highly expressed in spines of excitatory cortical neurons (Kaufmann et al., 1996).
While paroxysmal depolarizations are a hallmark of epileptic seizures, the PGE2-evoked depolarizations shown in the present study are unlikely to reflect a seizure activity at the behavioral level. Indeed, homeostatic mechanisms would be expected to reverse this hyperexcitable state, if the inflammatory process does not persist. In fact, in our experiments, the PGE2-, TTX-, and PGE2+TTX-induced changes returned at the cellular and network level to values similar to the control slices after a 1 week recovery period. Indeed, the described homeostatic response may be adaptable and necessary to reestablish network connectivity after an injury. Therefore, COX-2 and PGE2 may, under physiological conditions, play an important part in regulating synaptic transmission in networks that are highly plastic, such as the neocortical and hippocampal network.
However, if TBI leads to persistent changes in the inflammatory pathway, the hyperexcitable state as described in the present study could reflect the beginning of a latent period that is very characteristic for epileptogenesis. Typically, weeks pass before the occurrence of the first seizure in animal models (Wuarin and Dudek, 2001; Williams et al., 2009) and days to months before onset of posttraumatic epilepsy in patients (Englander et al., 2003). Thus, a critical question is how the homeostatically induced hyperexcitable state eventually becomes manifested in a behavioral seizure. As shown also in the present study, TTX-induced activity deprivation of cortical networks leads to increased active caspase-3-positive apoptosis of neurons in vitro and in vivo (Heck et al., 2008). This activity-dependent apoptosis could under normal conditions be part of the programmed cell death in the developing cortex. Several reports have shown that in the postnatal development of the cortex a substantial elimination of the neuronal population is an essential process of maturation (Ferrer et al., 1990; Verney et al., 2000; Hodge et al., 2007). However, pathological conditions that also lead to activity deprivation could result in increased apoptotic cell death and might therefore induce permanent alterations of network function.
Here, we demonstrated that PGE2 as well as TTX exposure altered not only synaptic transmission, but also led to increased cell death. Increased cell death is another hallmark of epileptogenesis and may contribute to the irreversible manifestation of a seizure state. We therefore propose that the hyperexcitable state together with the permanent changes associated with cell death may constitute the first events leading to a change in the balance between inhibition and excitation that could eventually become permanently manifested in an epileptic patient. However, the entire process of epileptogenesis will most likely involve a complex cascade of many additional molecular and cellular events that occur over a period of weeks and months.
Footnotes
This work was supported in part by the Tarrson family and the Falk Foundation.
References
- Ahmadi S, Lippross S, Neuhuber WL, Zeilhofer HU. PGE(2) selectively blocks inhibitory glycinergic neurotransmission onto rat superficial dorsal horn neurons. Nat Neurosci. 2002;5:34–40. doi: 10.1038/nn778. [DOI] [PubMed] [Google Scholar]
- Aizenman CD, Akerman CJ, Jensen KR, Cline HT. Visually driven regulation of intrinsic neuronal excitability improves stimulus detection in vivo. Neuron. 2003;39:831–842. doi: 10.1016/s0896-6273(03)00527-0. [DOI] [PubMed] [Google Scholar]
- Akaneya Y, Tsumoto T. Bidirectional trafficking of prostaglandin E2 receptors involved in long-term potentiation in visual cortex. J Neurosci. 2006;26:10209–10221. doi: 10.1523/JNEUROSCI.3028-06.2006. [DOI] [PMC free article] [PubMed] [Google Scholar]
- Annegers JF, Coan SP. The risks of epilepsy after traumatic brain injury. Seizure. 2000;9:453–457. doi: 10.1053/seiz.2000.0458. [DOI] [PubMed] [Google Scholar]
- Armstrong CM, Gilly WF. Access resistance and space clamp problems associated with whole-cell patch clamping. Methods Enzymol. 1992;207:100–122. doi: 10.1016/0076-6879(92)07007-b. [DOI] [PubMed] [Google Scholar]
- Avramescu S, Timofeev I. Synaptic strength modulation after cortical trauma: a role in epileptogenesis. J Neurosci. 2008;28:6760–6772. doi: 10.1523/JNEUROSCI.0643-08.2008. [DOI] [PMC free article] [PubMed] [Google Scholar]
- Beattie EC, Stellwagen D, Morishita W, Bresnahan JC, Ha BK, Von Zastrow M, Beattie MS, Malenka RC. Control of synaptic strength by glial TNFalpha. Science. 2002;295:2282–2285. doi: 10.1126/science.1067859. [DOI] [PubMed] [Google Scholar]
- Chandrasekaran AR, Shah RD, Crair MC. Developmental homeostasis of mouse retinocollicular synapses. J Neurosci. 2007;27:1746–1755. doi: 10.1523/JNEUROSCI.4383-06.2007. [DOI] [PMC free article] [PubMed] [Google Scholar]
- Chen C, Bazan NG. Endogenous PGE2 regulates membrane excitability and synaptic transmission in hippocampal CA1 pyramidal neurons. J Neurophysiol. 2005;93:929–941. doi: 10.1152/jn.00696.2004. [DOI] [PubMed] [Google Scholar]
- Contreras D, Steriade M. Cellular basis of EEG slow rhythms: a study of dynamic corticothalamic relationships. J Neurosci. 1995;15:604–622. doi: 10.1523/JNEUROSCI.15-01-00604.1995. [DOI] [PMC free article] [PubMed] [Google Scholar]
- Davis GW, Bezprozvanny I. Maintaining the stability of neural function: a homeostatic hypothesis. Annu Rev Physiol. 2001;63:847–869. doi: 10.1146/annurev.physiol.63.1.847. [DOI] [PubMed] [Google Scholar]
- Desai NS, Rutherford LC, Turrigiano GG. Plasticity in the intrinsic excitability of cortical pyramidal neurons. Nat Neurosci. 1999;2:515–520. doi: 10.1038/9165. [DOI] [PubMed] [Google Scholar]
- Englander J, Bushnik T, Duong TT, Cifu DX, Zafonte R, Wright J, Hughes R, Bergman W. Analyzing risk factors for late posttraumatic seizures: a prospective, multicenter investigation. Arch Phys Med Rehabil. 2003;84:365–373. doi: 10.1053/apmr.2003.50022. [DOI] [PubMed] [Google Scholar]
- Ferrer I, Bernet E, Soriano E, del Rio T, Fonseca M. Naturally occurring cell death in the cerebral cortex of the rat and removal of dead cells by transitory phagocytes. Neuroscience. 1990;39:451–458. doi: 10.1016/0306-4522(90)90281-8. [DOI] [PubMed] [Google Scholar]
- Haider B, Duque A, Hasenstaub AR, McCormick DA. Neocortical network activity in vivo is generated through a dynamic balance of excitation and inhibition. J Neurosci. 2006;26:4535–4545. doi: 10.1523/JNEUROSCI.5297-05.2006. [DOI] [PMC free article] [PubMed] [Google Scholar]
- Heck N, Golbs A, Riedemann T, Sun JJ, Lessmann V, Luhmann HJ. Activity-dependent regulation of neuronal apoptosis in neonatal mouse cerebral cortex. Cereb Cortex. 2008;18:1335–1349. doi: 10.1093/cercor/bhm165. [DOI] [PubMed] [Google Scholar]
- Hevner RF, Shi L, Justice N, Hsueh Y, Sheng M, Smiga S, Bulfone A, Goffinet AM, Campagnoni AT, Rubenstein JL. Tbr1 regulates differentiation of the preplate and layer 6. Neuron. 2001;29:353–366. doi: 10.1016/s0896-6273(01)00211-2. [DOI] [PubMed] [Google Scholar]
- Hodge RD, D'Ercole AJ, O'Kusky JR. Insulin-like growth factor-I (IGF-I) inhibits neuronal apoptosis in the developing cerebral cortex in vivo. Int J Dev Neurosci. 2007;25:233–241. doi: 10.1016/j.ijdevneu.2007.03.004. [DOI] [PMC free article] [PubMed] [Google Scholar]
- Hodge RD, Kowalczyk TD, Wolf SA, Encinas JM, Rippey C, Enikolopov G, Kempermann G, Hevner RF. Intermediate progenitors in adult hippocampal neurogenesis: Tbr2 expression and coordinate regulation of neuronal output. J Neurosci. 2008;28:3707–3717. doi: 10.1523/JNEUROSCI.4280-07.2008. [DOI] [PMC free article] [PubMed] [Google Scholar]
- Houweling AR, Bazhenov M, Timofeev I, Steriade M, Sejnowski TJ. Homeostatic synaptic plasticity can explain post-traumatic epileptogenesis in chronically isolated neocortex. Cereb Cortex. 2005;15:834–845. doi: 10.1093/cercor/bhh184. [DOI] [PMC free article] [PubMed] [Google Scholar]
- Johnson HA, Buonomano DV. Development and plasticity of spontaneous activity and Up states in cortical organotypic slices. J Neurosci. 2007;27:5915–5925. doi: 10.1523/JNEUROSCI.0447-07.2007. [DOI] [PMC free article] [PubMed] [Google Scholar]
- Kaufmann WE, Worley PF, Pegg J, Bremer M, Isakson P. COX-2, a synaptically induced enzyme, is expressed by excitatory neurons at postsynaptic sites in rat cerebral cortex. Proc Natl Acad Sci U S A. 1996;93:2317–2321. doi: 10.1073/pnas.93.6.2317. [DOI] [PMC free article] [PubMed] [Google Scholar]
- Kessels HW, Malinow R. Synaptic AMPA receptor plasticity and behavior. Neuron. 2009;61:340–350. doi: 10.1016/j.neuron.2009.01.015. [DOI] [PMC free article] [PubMed] [Google Scholar]
- Liang F, Jones EG. Differential and time-dependent changes in gene expression for type II calcium/calmodulin-dependent protein kinase, 67 kDa glutamic acid decarboxylase, and glutamate receptor subunits in tetanus toxin-induced focal epilepsy. J Neurosci. 1997;17:2168–2180. doi: 10.1523/JNEUROSCI.17-06-02168.1997. [DOI] [PMC free article] [PubMed] [Google Scholar]
- Maffei A, Turrigiano GG. Multiple modes of network homeostasis in visual cortical layer 2/3. J Neurosci. 2008;28:4377–4384. doi: 10.1523/JNEUROSCI.5298-07.2008. [DOI] [PMC free article] [PubMed] [Google Scholar]
- Maffei A, Nataraj K, Nelson SB, Turrigiano GG. Potentiation of cortical inhibition by visual deprivation. Nature. 2006;443:81–84. doi: 10.1038/nature05079. [DOI] [PubMed] [Google Scholar]
- Mahon S, Vautrelle N, Pezard L, Slaght SJ, Deniau JM, Chouvet G, Charpier S. Distinct patterns of striatal medium spiny neuron activity during the natural sleep–wake cycle. J Neurosci. 2006;26:12587–12595. doi: 10.1523/JNEUROSCI.3987-06.2006. [DOI] [PMC free article] [PubMed] [Google Scholar]
- McGlade-McCulloh E, Yamamoto H, Tan SE, Brickey DA, Soderling TR. Phosphorylation and regulation of glutamate receptors by calcium/calmodulin-dependent protein kinase II. Nature. 1993;362:640–642. doi: 10.1038/362640a0. [DOI] [PubMed] [Google Scholar]
- Nelson SB, Turrigiano GG. Strength through diversity. Neuron. 2008;60:477–482. doi: 10.1016/j.neuron.2008.10.020. [DOI] [PMC free article] [PubMed] [Google Scholar]
- Newpher TM, Ehlers MD. Glutamate receptor dynamics in dendritic microdomains. Neuron. 2008;58:472–497. doi: 10.1016/j.neuron.2008.04.030. [DOI] [PMC free article] [PubMed] [Google Scholar]
- Nita DA, Cissé Y, Timofeev I, Steriade M. Increased propensity to seizures after chronic cortical deafferentation in vivo. J Neurophysiol. 2006;95:902–913. doi: 10.1152/jn.00742.2005. [DOI] [PubMed] [Google Scholar]
- O'Brien RJ, Kamboj S, Ehlers MD, Rosen KR, Fischbach GD, Huganir RL. Activity-dependent modulation of synaptic AMPA receptor accumulation. Neuron. 1998;21:1067–1078. doi: 10.1016/s0896-6273(00)80624-8. [DOI] [PubMed] [Google Scholar]
- Okun M, Naim A, Lampl I. The subthreshold relation between cortical local field potential and neuronal firing unveiled by intracellular recordings in awake rats. J Neurosci. 2010;30:4440–4448. doi: 10.1523/JNEUROSCI.5062-09.2010. [DOI] [PMC free article] [PubMed] [Google Scholar]
- Prince DA, Tseng GF. Epileptogenesis in chronically injured cortex: in vitro studies. J Neurophysiol. 1993;69:1276–1291. doi: 10.1152/jn.1993.69.4.1276. [DOI] [PubMed] [Google Scholar]
- Reig R, Sanchez-Vives MV. Synaptic transmission and plasticity in an active cortical network. PLoS One. 2007;2:e670. doi: 10.1371/journal.pone.0000670. [DOI] [PMC free article] [PubMed] [Google Scholar]
- Salazar AM, Jabbari B, Vance SC, Grafman J, Amin D, Dillon JD. Epilepsy after penetrating head injury. I. Clinical correlates: a report of the Vietnam Head Injury Study. Neurology. 1985;35:1406–1414. doi: 10.1212/wnl.35.10.1406. [DOI] [PubMed] [Google Scholar]
- Sanchez-Vives MV, McCormick DA. Cellular and network mechanisms of rhythmic recurrent activity in neocortex. Nat Neurosci. 2000;3:1027–1034. doi: 10.1038/79848. [DOI] [PubMed] [Google Scholar]
- Sang N, Zhang J, Marcheselli V, Bazan NG, Chen C. Postsynaptically synthesized prostaglandin E2 (PGE2) modulates hippocampal synaptic transmission via a presynaptic PGE2 EP2 receptor. J Neurosci. 2005;25:9858–9870. doi: 10.1523/JNEUROSCI.2392-05.2005. [DOI] [PMC free article] [PubMed] [Google Scholar]
- Stellwagen D, Malenka RC. Synaptic scaling mediated by glial TNF-alpha. Nature. 2006;440:1054–1059. doi: 10.1038/nature04671. [DOI] [PubMed] [Google Scholar]
- Steriade M. Active neocortical processes during quiescent sleep. Arch Ital Biol. 2001;139:37–51. [PubMed] [Google Scholar]
- Timofeev I, Grenier F, Steriade M. Disfacilitation and active inhibition in the neocortex during the natural sleep-wake cycle: an intracellular study. Proc Natl Acad Sci U S A. 2001;98:1924–1929. doi: 10.1073/pnas.041430398. [DOI] [PMC free article] [PubMed] [Google Scholar]
- Topolnik L, Steriade M, Timofeev I. Hyperexcitability of intact neurons underlies acute development of trauma-related electrographic seizures in cats in vivo. Eur J Neurosci. 2003;18:486–496. doi: 10.1046/j.1460-9568.2003.02742.x. [DOI] [PubMed] [Google Scholar]
- Trasande CA, Ramirez JM. Activity deprivation leads to seizures in hippocampal slice cultures: is epilepsy the consequence of homeostatic plasticity? J Clin Neurophysiol. 2007;24:154–164. doi: 10.1097/WNP.0b013e318033787f. [DOI] [PubMed] [Google Scholar]
- Turrigiano GG, Leslie KR, Desai NS, Rutherford LC, Nelson SB. Activity-dependent scaling of quantal amplitude in neocortical neurons. Nature. 1998;391:892–896. doi: 10.1038/36103. [DOI] [PubMed] [Google Scholar]
- van Drongelen W, Koch H, Marcuccilli C, Pena F, Ramirez JM. Synchrony levels during evoked seizure-like bursts in mouse neocortical slices. J Neurophysiol. 2003;90:1571–1580. doi: 10.1152/jn.00392.2003. [DOI] [PubMed] [Google Scholar]
- van Drongelen W, Koch H, Elsen FP, Lee HC, Mrejeru A, Doren E, Marcuccilli CJ, Hereld M, Stevens RL, Ramirez JM. Role of persistent sodium current in bursting activity of mouse neocortical networks in vitro. J Neurophysiol. 2006;96:2564–2577. doi: 10.1152/jn.00446.2006. [DOI] [PubMed] [Google Scholar]
- Verney C, Takahashi T, Bhide PG, Nowakowski RS, Caviness VS., Jr Independent controls for neocortical neuron production and histogenetic cell death. Dev Neurosci. 2000;22:125–138. doi: 10.1159/000017434. [DOI] [PubMed] [Google Scholar]
- Warden D. Military TBI during the Iraq and Afghanistan wars. J Head Trauma Rehabil. 2006;21:398–402. doi: 10.1097/00001199-200609000-00004. [DOI] [PubMed] [Google Scholar]
- Wierenga CJ, Walsh MF, Turrigiano GG. Temporal regulation of the expression locus of homeostatic plasticity. J Neurophysiol. 2006;96:2127–2133. doi: 10.1152/jn.00107.2006. [DOI] [PubMed] [Google Scholar]
- Williams PA, White AM, Clark S, Ferraro DJ, Swiercz W, Staley KJ, Dudek FE. Development of spontaneous recurrent seizures after kainate-induced status epilepticus. J Neurosci. 2009;29:2103–2112. doi: 10.1523/JNEUROSCI.0980-08.2009. [DOI] [PMC free article] [PubMed] [Google Scholar]
- Wuarin JP, Dudek FE. Excitatory synaptic input to granule cells increases with time after kainate treatment. J Neurophysiol. 2001;85:1067–1077. doi: 10.1152/jn.2001.85.3.1067. [DOI] [PubMed] [Google Scholar]
- Yamagata K, Andreasson KI, Kaufmann WE, Barnes CA, Worley PF. Expression of a mitogen-inducible cyclooxygenase in brain neurons: regulation by synaptic activity and glucocorticoids. Neuron. 1993;11:371–386. doi: 10.1016/0896-6273(93)90192-t. [DOI] [PubMed] [Google Scholar]
- Yang H, Zhang J, Andreasson K, Chen C. COX-2 oxidative metabolism of endocannabinoids augments hippocampal synaptic plasticity. Mol Cell Neurosci. 2008;37:682–695. doi: 10.1016/j.mcn.2007.12.019. [DOI] [PMC free article] [PubMed] [Google Scholar]


