Abstract
Occupational exposure to Cr is concerning because of its myriad of health effects. Assessing chromium exposure is also cost and resource intensive because the analysis typically uses sophisticated instrumental techniques like Inductively-Coupled Plasma-Mass Spectrometry (ICP-MS). Here, we report a novel, simple, inexpensive microfluidic paper-based analytical device (µPAD) for measuring total Cr in airborne particulate matter. In the µPAD, tetravalent cerium (Ce(IV)) was used in a pretreatment zone to oxidize all soluble Cr to Cr(VI). After elution to the detection zone, Cr(VI) reacts with 1,5-diphenylcarbazide (1,5- DPC) forming 1,5-diphenylcarbazone (DPCO) and Cr(III). The resulting Cr(III) forms a distinct purple colored complex with the DPCO. As proof-of-principle, particulate matter (PM) collected on a sample filter was analyzed with the µPAD to quantify the mass of total Cr. A log-linear working range (0.23–3.75 µg; r2=0.998) between Cr and color intensity was obtained with a detection limit of 0.12 µg. For validation, a certified reference containing multiple competing metals was analyzed. Quantitative agreement was obtained between known Cr levels in the sample and the Cr measured using the µPAD.
1. Introduction
There are many industrial uses of Cr, including pigment dyes, plastics, protective coatings, ferrochromium alloys, chromate production, tannery facilities, and steel alloys [1]. Chromium exists primarily in one of two oxidation states, trivalent (Cr(III)) and hexavalent (Cr(VI)). Trivalent chromium has an LD50 of 200–600 mg/kg and is suggested to play an important role in insulin action and glucose regulation in the human body [2–5]. Cr(VI) has an LD50 of 50–150 mg/kg and effects respiratory, gastrointestinal, immunological, hematological, reproductive, and developmental systems [6, 7]. In addition, Cr(VI) is a potent carcinogen [8]. Airborne exposure to both forms of chromates in dye pigments, anticorrosive agents, surface coatings, and welding is linked with lung, nasal, and stomach cancers [9]. The legal limit for airborne exposure to total Cr in U.S. workplaces is 0.05 µg/m3, set by The Occupational Safety and Health Administration (OSHA) in 2012.
At present, occupational exposure to metals in particulate matter (PM) requires sampling onto filters, which are then transported to a centralized analytical laboratory for analysis. Many instrumental techniques have been used to measure Cr, including UV-Visible spectrophotometry [10], ion chromatography [11], inductively couple plasma-mass spectrometry [12], atomic absorption spectroscopy [13], and X-ray techniques [14]. Although highly sensitive, these approaches are time-consuming (approximately two weeks for assessment), expensive (over $100 per sample), and require trained operators. Consequently, there is a need for simple, sensitive methods for Cr analysis to enable more frequent assessment of exposures of ‘at-risk’ workers.
Paper-based microfluidic devices (µPADs) have emerged as a low-cost alternative for quantitative chemical measurement. Relative to traditional assays, µPADs are easy to operate, consume small reagent volumes, and provide rapid results (typically in min) [15–19]. µPADs represent a new generation of lateral-flow chemical assays utilizing hydrophobic barriers printed on paper. These barriers direct flow so that specific chemical assays may be conducted rapidly and efficiently [20]. Paper substrates are easy to use because flow is generated via capillary action. Reagents impregnated in ‘detection zones’ on the µPAD allow analytes to be quantified by visual assessment using an external optical reader (i.e. camera, scanner) [21–23]. The utility of this technology has been demonstrated for applications in point-of-care [24–26], food safety [27–29], and environmental monitoring [30–33]. Several reports have focused on quantifying metals using µPADs. Hossain and Brennan used the enzymatic activity of β-galactosidase and silver nanoparticle aggregation to detect metals in water [31]. Yang and Wang developed a method for determining Ag and Cu via an autocatalytic reaction with o-phenylenediamine followed by detection with fluorescence [34]. Ratnarathorn et al. used silver nanoparticles to detect Cu ions in water [35]. Our group demonstrated the use of µPADs for determination of Fe, Cu, and Ni in aerosolized incineration ash as a first step towards monitoring occupational exposure, with detection limits of 1 – 1.5 µg [30].
Here, a µPAD was developed for total Cr determination using tetravalent cerium Ce(IV) and 1,5-diphenylcarbazide (1,5-DPC) as oxidizing [36] and colorimetric [37] reagents, respectively. The µPAD approach is different from previous reports because it includes sample pretreatment on the device as well as addition of stabilizing agents to give the device long-term shelf life. Furthermore, the device includes four separate detection zones to provide an estimate of analytic precision and to ensure (statistical) reproducibility. Tetravalent cerium oxidizes all forms of soluble Cr to Cr(VI) for reaction with 1,5-DPC. We chose Ce(IV) over hydrogen peroxide [38], perchloric acid [39], and bromine [40] because these latter chemicals typically require multiple reagent additions, time-consuming steps, and precise temperature control. Alternatively, Ce(IV) does not require precise temperature control, is easy to use, and can be stored on paper. For colorimetric detection of Cr(VI), many published methods have been reported including the use of gold and silver nanoparticles [41, 42] and nanoparticle derivatives [43]. 1,5-diphenylcarbazide has been used as a selective Cr(VI) reagent for decades [44]. 1,5-DPC reduces Cr(VI) to Cr(III) and is itself oxidized to diphenylcarbazone (DPCO). DPCO complexes with the generated Cr(III) to form an intensely purple-colored complex [37]. Phthalic anhydride stabilizes 1,5-DPC on the µPADs [45]. Method viability was established using standardized metal-containing baghouse dust samples. Dust collected on cellulose filters was digested using microwave-assisted wet digestion, followed by µPAD analysis. Quantitative evaluation showed good correlation with known Cr levels.
2. Experimental
2.1 Materials and equipment
Ammonium dichromate (VI), lead(II) nitrate, cadmium(II) nitrate tetrahydrate, iron(III) chloride hexahydrate, nickel(II) sulfate hexahydrate, barium(II) chloride, manganese(II) chloride tetrahydrate, zinc(II) nitrate hexahydrate, vanadium(III) chloride, silver(II) nitrate, cobalt(II) chloride, aluminum(III) sulfate hydrate, copper(II) sulfate pentahydrate, phthalic anhydride, cerium (IV) ammonium nitrate, 1,5-diphenylcarbazide, and polydiallyldimethylammonium chloride (medium molecular weight) were obtained from Sigma-Aldrich (St. Louis, MO). Sodium acetate and glacial acetic acid were obtained from Fisher Scientific (Pittsburgh, PA). Metal-containing certified industrial incineration ash samples (RTC-CRM012) and pre-validated baghouse dust (RTC-CRM014) were purchased from LGC Standards (Teddington, UK). Milli-Q water from Millipore (R ≥ 18.2 MΩ cm−1) was used for all experiments. All chemicals were used as received.
2.2 Device design and fabrication
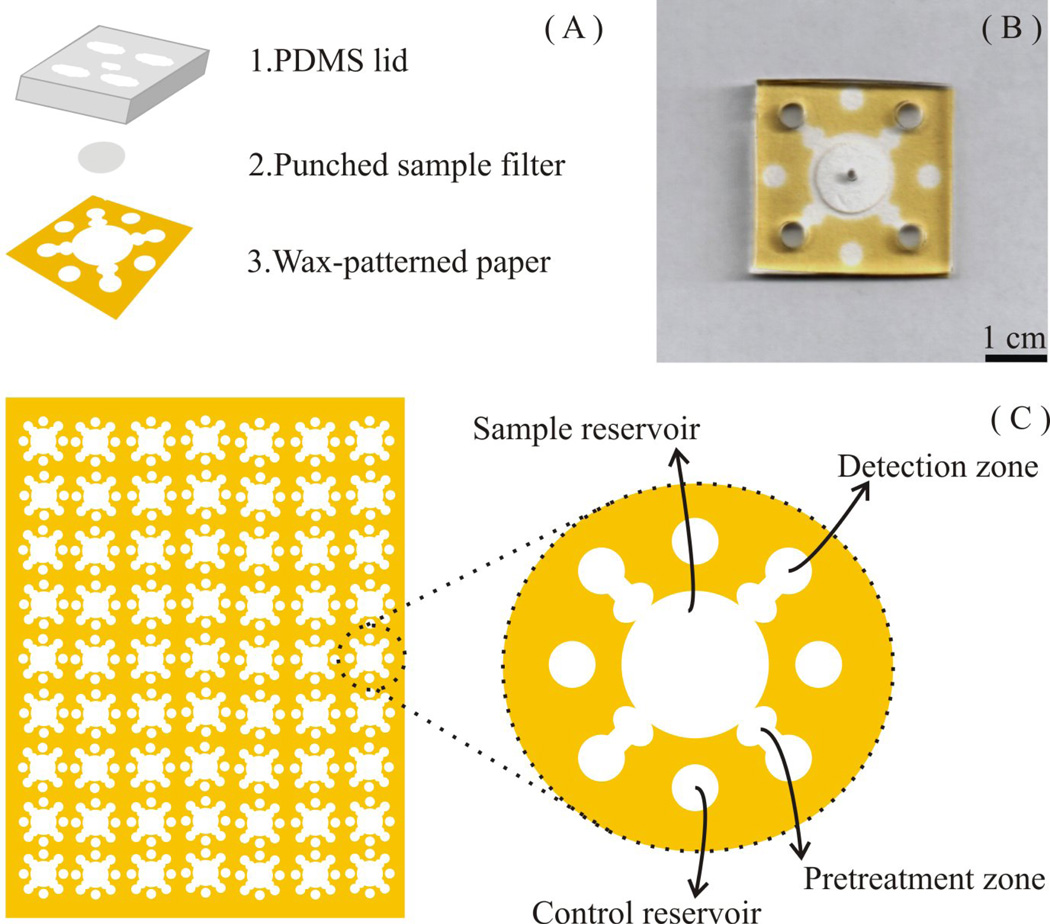
The µPADs described here were fabricated using wax printing [20]. Hydrophobic barriers were printed using a commercial wax printer (Xerox Phaser 8860, VWR) onto Whatman grade one filter paper, as described previously [20, 27]. The µPAD design shown in Figure 1 was generated using graphics software (CorelDRAW). The RGB values 248-195-0 were selected as the barrier color, providing a high contrast background for subsequent image analysis. Printed wax was melted at 200 °C for 120 s on a hot plate. One side of the paper substrate was then covered with packing tape to prevent leakage of eluent through the bottom of the µPAD.
Fig. 1.
(A) Schematic of a µPAD, consisting of a PDMS lid for applying equal pressure across the paper surface, a 10 mm filter punch containing PM from baghouse dust, and a patterned filter paper treated with reagents for colorimetric analysis of total Cr. (B) The combined device. (C) Analytical devices can be mass-produced on a single sheet of filter paper (the figure shows 63 individual devices).
2.3 Colorimetric detection of total chromium
For Cr detection, a solution containing 1.5 g of 1,5-diphenylcarbazide (1,5-DPC) and 4.0 g of phthalic anhydride was dissolved in 100 mL of acetone. The µPAD was prepared by adding 0.5 µL of ceric(IV) ammonium nitrate (0.35 mM) twice onto the pretreatment zone, followed by 0.5 µL of polydiallyldimethylammonium chloride (PDDA) (5% w/v). PDDA was added to stabilize the reaction product between Cr and 1,5-DPC and to prevent the complex from flowing to the edges of the hydrophilic channels [30]. Two 0.25 µL aliquots of the detection reagent solution (1,5-DPC and phthalic anhydride) were then added to the detection zone. The device was allowed to dry completely between each reagent addition.
2.4 Experimental procedure
An overview of the experimental procedure is shown in Figure 2. For measurements, a 10 mm (diameter) circular punch was taken from an air sampling filter (described below). Calibration plots were generated by adding standard solutions to one 10 mm punch. When dry, the punch was placed on the µPAD sample reservoir. For method validation, a sample of baghouse PM was resuspended in the laboratory and onto mixed cellulose ester (MCE) filters. After sample collection, 20 µL of SDS was added to each 10 mm punch to enhance the elution of metal ions from the relatively hydrophobic MCE filter. Microwave-assisted acid digestion on the filter samples was performed by adding 5 µL of concentrated nitric acid, followed by 30 µL of water to the filter punch. The punch was then placed in a household microwave (1100 W) for a total of 30 s (two 15 s intervals). Between each 15 s interval, 30 µL of deionized water was added to each punch to wet the filter. After digestion, 10 µL of sodium bicarbonate (0.5 M, pH 9.5) was added to neutralize the acid. To accelerate neutralization, the µPAD was heated in the microwave for an additional 15 s. Finally, a polydimethylsiloxane (PDMS) lid with holes punched over the sample reservoir (2 mm diameter) and detection zone (5 mm diameter) was placed on top of the µPAD. Acetate buffer (40 µL, 0.1 M, pH 4.5) was added to the center hole of the PDMS lid, eluting the digested metals from the filter through the pretreatment zones to the detection zones. A 300 g weight (a water filled Erlenmeyer flask) was placed on the PDMS lid to distribute pressure evenly across the device. Color formation was complete in less than 10 min. The device was allowed to dry before color intensity was measured.
Fig. 2.
Acid digestion procedure for measuring total soluble Cr. HNO3 is deposited on a 10 mm filter punch and digested using a commercial microwave. The digested punch is placed on the µPAD and acetate buffer (pH 4.5) is added to the paper substrate through the PDMS lid. The buffer elutes Cr ions from the MCE filter to the detection zones.
2.5 Quantitative image processing
Color intensity was measured using a desktop scanner (XEROX DocuMate 3220). To quantify intensity, a color threshold window was applied to the Cr(III)-1,5-diphenylcarbazone product (0-180) using NIH ImageJ software, effectively removing all unwanted color channels. This method passes only the purple of the Cr(III)-1,5-DPC complex, and removes the wax background. After thresholding, images were converted to gray scale and inverted, yielding higher intensity values for darker (more concentrated) Cr samples [30]. For background measurements, color intensities for blank samples were measured using the same protocol described above. The background values were used to determine the baseline intensity for detection limit calculations.
2.6 Particulate metal collection and digestion
A suspension of 0.1% (w/v %) incineration ash in deionized water was prepared and nebulized into a 0.8 m3 plexiglass chamber. The average PM concentration in the chamber was 0.73 mg/m3 as measured using an aerosol photometer (TSI, Model 8250). Relative humidity was not controlled but was monitored and remained below 50% throughout all experiments. Resuspended dust was sampled onto Pallflex and mixed cellulose ester (MCE) filters (37 mm diameter) at a flow rate of 10 L/min for 4 hrs. Sampled PM mass was quantified using a Mettler-Toledo analytical microbalance (model MX5). These filters collected approximately 1.16 µg ash per mm2 of exposed filter area (or 91.14 µg per punch). After sample collection, 10 mm diameter punches were taken from the filter, extracted, and prepared according to the procedure described above.
3. Results and discussion
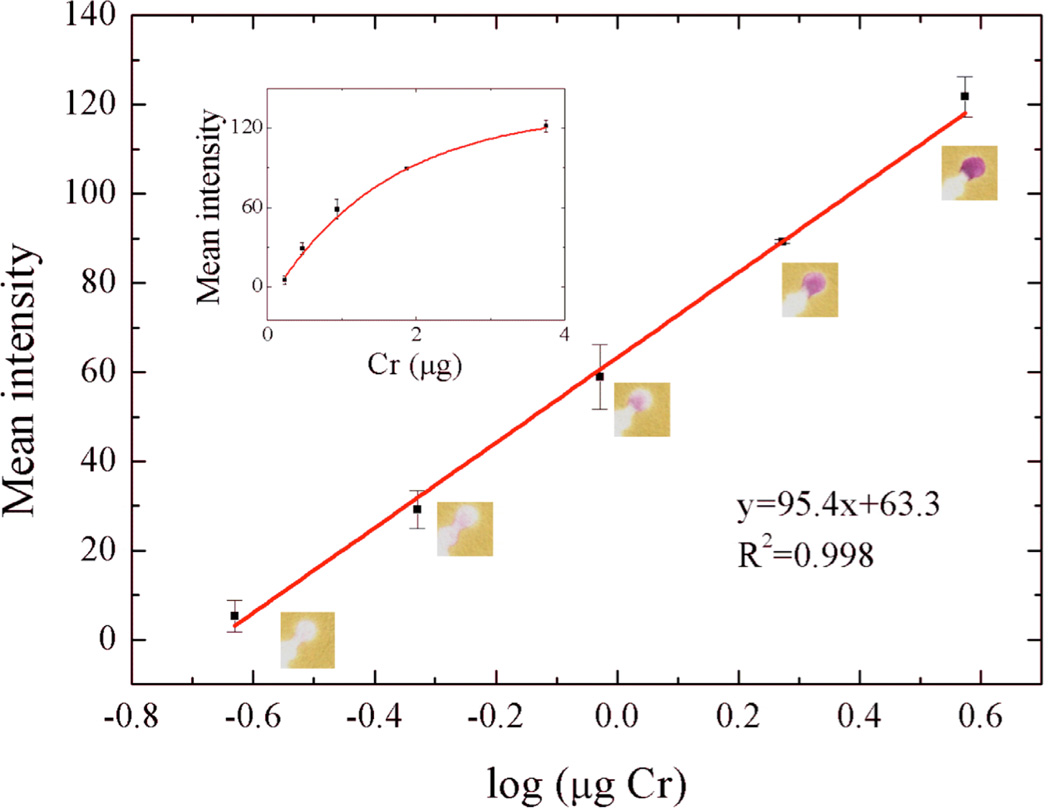
We first evaluated the ability to measure total Cr using the combination of Ce(IV) oxidation followed by colorimetric detection with 1,5-DPC. After the reaction was complete, the purple 1,5-DPCO product was readily visible in the detection zone. A log-linear calibration curve was obtained from standard chromium solutions added to 10 mm MCE punches (Figure 3). Intensities were linear with respect to total chromium mass (log scale) from 0.23–3.75 µg with a detection limit of 0.12 µg and a pooled relative standard deviation (RSD) for all measurements (n = 7 measures for each Cr level) of 4.9%. The detection limit was determined by the lowest Cr mass with an intensity three standard deviations above the background standard deviation. Above 3.75 µg, the paper surface saturated and no additional increase in intensity was measured. Although the overall linear range covers only one order of magnitude, this range should be sufficient for hazard evaluation, since higher exposures (once detected) will likely require further investigation. Analysis of smaller punch sizes can also be employed. The linear range of the assay is extendable by increasing the surface area of the detection zone; larger detection zones facilitate analysis of greater chromium mass. The minimum detectable levels of Cr using the µPAD were compared to the permissible exposure limit (PEL), stipulated by the OSHA. For method validation, minimum detectable limits were measured as a TWA, collected at sampling rate of 4 L/min. At the detection limit of 0.12 µg Cr, we calculated a minimum detectable level as a TWA of 0.72 µg/m3. Although this level exceeds the PEL for Cr, stacking MCE punches and analyzing multiple filters simultaneously can be used to further decrease detection sensitivity. As a result, this proposed method should be sufficient for monitoring occupational exposure to particulate Cr.
Fig. 3.
Colorimetric intensity as a function of log Cr mass added to the µPAD. The working range was 0.23–3.75 µg and is log-linear with measured intensity. The inset shows the same data plotted on a linear mass scale (n = 3).
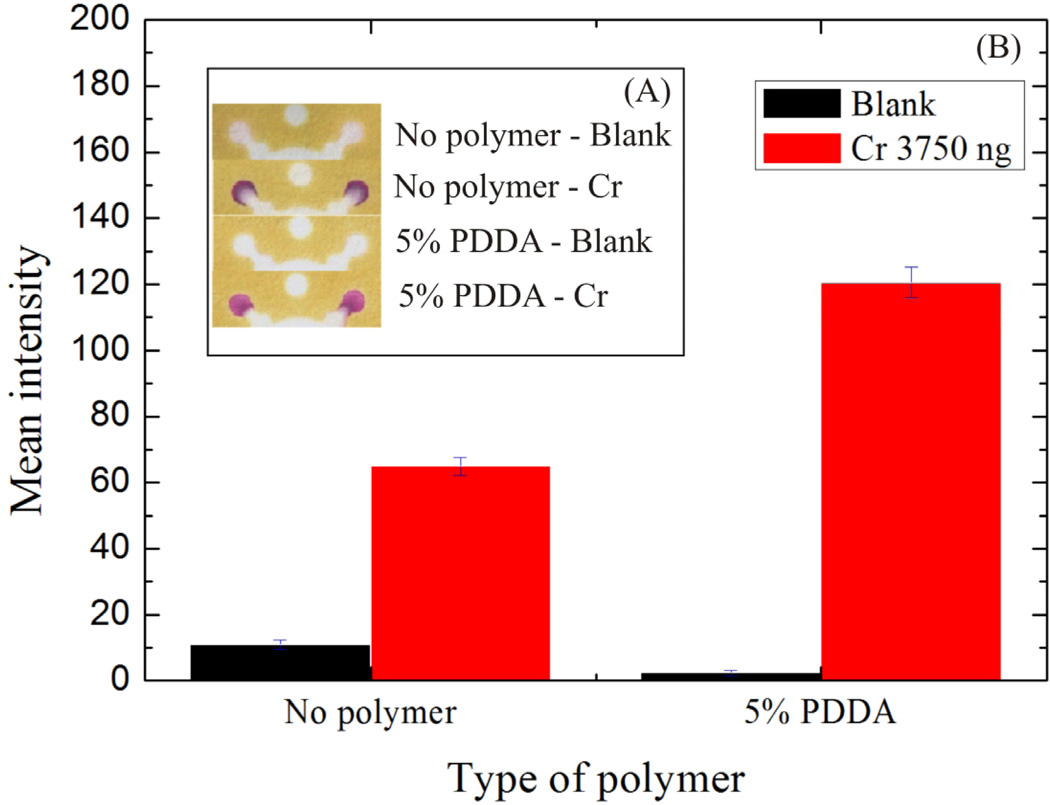
We found, from prior work in our laboratory, that the metal complex should be homogenously distributed over the detection zone to maximize accuracy and detection sensitivity [30]. If the reaction product migrates to the detection zone edge, quantification (via color intensity integration) is more challenging. The final Cr complex generated here was highly mobile on paper, and as a result, the reaction product flowed to the detection zone edge, reducing measurement accuracy and sensitivity (Figure 4A). Tricapylmethyl ammonium chloride has been used previously to prevent the Cr-DPCO complex from spreading on spot tests [46]. Unfortunately, this surfactant must be dissolved in acetone. When applied to the device, the acetone caused dissolution of the wax and leaking of subsequent aqueous solutions. As a result, polydiallyldimethylammonium chloride (PDDA) was used to produce the same effect (Figure 4) [30]. The intensities of blank samples (0.1 M acetate buffer, pH 4.5) in the presence and absence of PDDA were measured to be 2.4 ± 1.1 and 10.8 ± 1.7 (n=7). The use of PDDA achieved a two-fold increase in signal strength; intensities of 3.75 µg Cr with and without PDDA were measured to be 121.4 ± 4.4 and 65.1 ± 1.1, respectively.
Fig. 4.
PDDA was investigated as a compound for retaining Cr the detection zone. (A) The devices were photographed, and (B) mean color intensity was measured in the presence and absence of PDDA in the detection zone.
We next investigated potential interferences from other metals. Cr(III) was added to the µPAD in the presence of Mg, Mn, Zn, Al, Ba, V, Co, Cu, Fe, and Ni (Figure 5) in metal:Cr ratios of 1:1 and 4:1. The measured levels of Cr were found to be 0.5 ± 0.1 and 1.8 ± 0.2 (n=7) µg in the two samples. A paired t-Test confirmed that the presence of other metals did not significantly impact measurement (Table S.D.1).
Fig. 5.
Representative µPADs for total Cr with and without potential interfering metals showing the ability to selectively measure Cr. Two different masses of Cr were analyzed in the presence of Mg, Mn, Zn, Al, Ba, V, Co, Cu, Fe, and Ni.
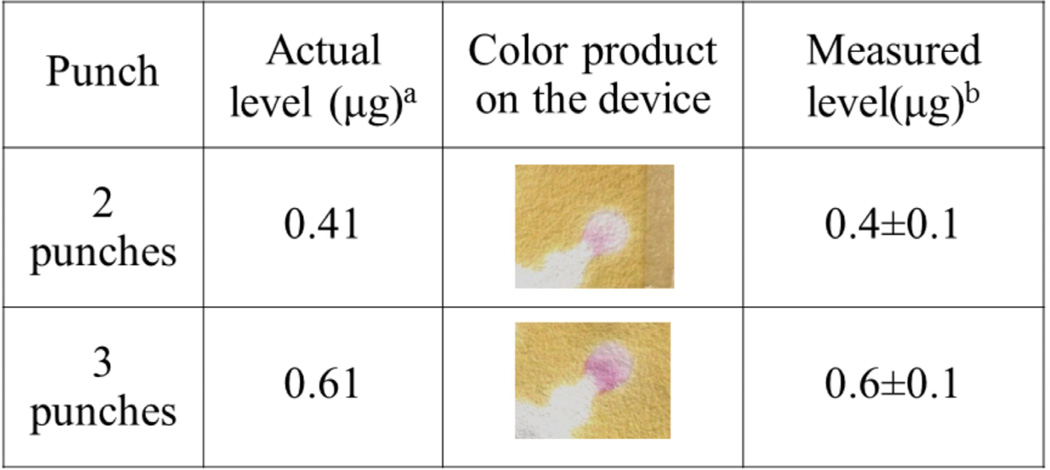
For method validation, a baghouse sample certified for Cd, Cr, and Pb, and containing unmeasured levels of Al, Sb, As, Ba, B, Be, Ca, Co, Cu, Fe, Mg, Mn, Hg, Mo, Ni, P, K, Ag, Se, Na, Sr, Tl, Sn, Ti, V, and Zn, was aerosolized and collected on filters. Total Cr mass was measured using combinations of two and three punches stacked over the sample zone (Figure 6). The measured Cr intensities were 31.8 ± 0.9 and 44.6 ± 2.1 (n=7), respectively. Gravimetric analysis was also performed on the filter punches to verify the Cr mass present. For two punches, the actual and measured Cr levels were 0.41 and 0.4 ± 0.1 (n=7) µg, respectively. For three punches, the absolute and measured Cr levels were 0.61 µg and 0.6 ± 0.1 (n=7) µg, respectively. These results suggest we can measure Cr concentrations from complex PM samples. Furthermore, detection limits and method sensitivity can be improved using multiple sample punches analyzed simultaneously on a single device.
Fig. 6.
Detection of Cr from baghouse dust containing the Al, Sb, As, Ba, B, Be, Ca, Co, Cu, Fe, Mg, Mn, Hg, Mo, Ni, P, K, Ag, Se, Na, Sr, Tl, Sn, Ti, V, and Zn. Measured levels are shown in which multiple 10 mm punches were taken and stacked for simultaneous analysis to enhance the mean intensity of the colored product.
aThe actual mass of Cr was calculated from gravimetric analysis of the filters after collection of baghouse dust.
bThe measured mass of Cr was obtained from the paper-based colorimetric assay.
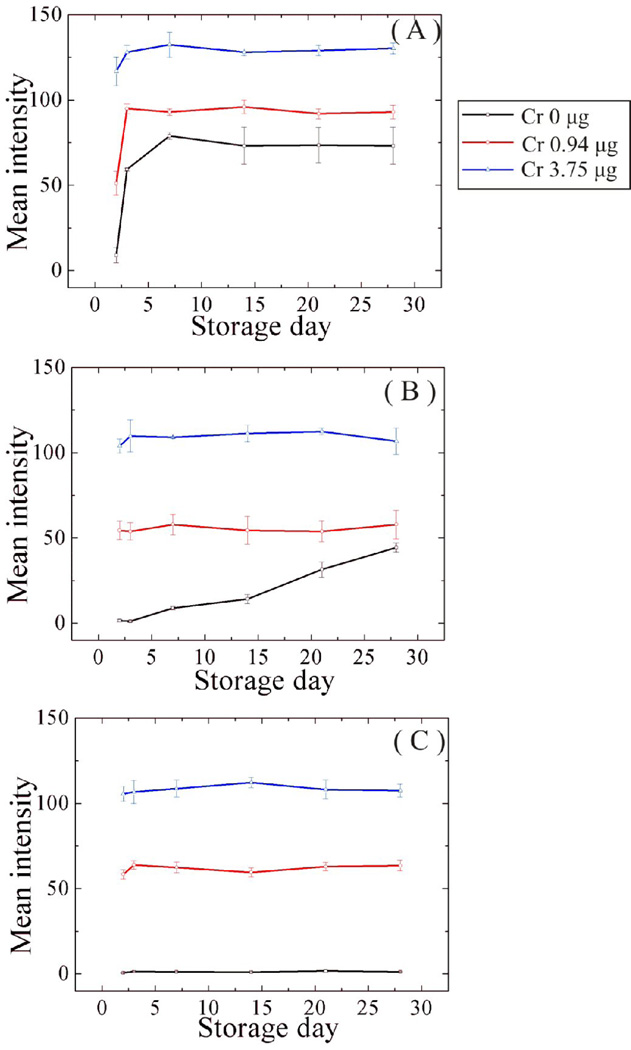
We also investigated the effects of long-term storage on device performance. A series of µPADs were stored at 4 and 22 ± 2°C for 2, 3, 7, 14, 21, and 28 days. Colorimetric intensities as a function of storage time are shown in Figure 7 for samples with 0.0, 0.94, and 3.75 µg Cr. In the absence of Cr and phthalic anhydride, the indicator (1,5-DPC) changed color after two days, regardless of temperature. In the presence of phthalic anhydride, color formation was observed after three days only at 22°C. In the presence of phthalic anhydride, no significant color developed after 28 days when the device was covered and stored at 4°C. These results show that when storing the device it is important to cover and keep in a cold environment.
Fig. 7.
Effect of storage on µPAD performance in the presence and absence of pretreatment reagents. Cr masses of 0, 0.94, and 3.75 µg were measured using the µPAD with the following conditions: (A) devices stored at 4°C without phthalic anhydride(B) devices stored at 25°C with phthalic anhydride(C) devices stored at 4°C with phthalic anhydride. The µPADs were stored for 2, 3, 7, 14, 21, and 28 days.
4. Conclusions
A µPAD was developed for quantifying levels of particulate Cr. Colorimetric µPADs provide a simple, portable approach for measuring particulate Cr relative to traditional methods. Using our system, total Cr mass can be quantified using devices that are inexpensive (<$0.05/test) and easy to use. Ultimately, the goal of this work is to provide a system whereby the analysis is performed at the point of use to avoid transportation costs. Rapid sample analysis will lead to more effective risk communication, improved assessment, and a lower exposure to occupational aerosol hazards.
Supplementary Material
Highlights.
Cr detection using a paper-based analytical device
Analysis of total Cr levels in particulate matter was achieved
Method for on-paper oxidation of Cr to Cr(VI) using Ce(IV) was established
Acknowledgements
This work was supported by the National Institute for Occupational Safety and Health (R21OH010050). PR thankfully acknowledges financial support from the Thailand Research Fund, through the Royal Golden Jubilee Ph.D. Program (Grant No. PHD/0251/2552). Also, this work was supported by grants from the National Research Council of Thailand, the 90th Anniversary of Chulalongkorn University Fund (Ratchadaphiseksomphot Endowment Fund), the Thailand Research Fund, Chulalongkorn University Centenary Academic Development Project, and the National Research University Project of CHE and the Ratchadaphisaksomphot Endowment Fund (project code AM003A and AM1009I-56).
Footnotes
Publisher's Disclaimer: This is a PDF file of an unedited manuscript that has been accepted for publication. As a service to our customers we are providing this early version of the manuscript. The manuscript will undergo copyediting, typesetting, and review of the resulting proof before it is published in its final citable form. Please note that during the production process errors may be discovered which could affect the content, and all legal disclaimers that apply to the journal pertain.
References
- 1.Abdolmohammad-Zadeh H, Sadeghi GH. Talanta. 2012;94:201. doi: 10.1016/j.talanta.2012.03.022. [DOI] [PubMed] [Google Scholar]
- 2.Han Z, Qi L, Shen G, Liu W, Chen Y. Analytical Chemistry. 2007;79:5862. doi: 10.1021/ac062453d. [DOI] [PubMed] [Google Scholar]
- 3.Schroeder HA, Balassa JJ, Tipton IH. Journal of Chronic Diseases. 1962;15:941. doi: 10.1016/0021-9681(62)90114-5. [DOI] [PubMed] [Google Scholar]
- 4.Zhao L, Jin Y, Yan Z, Liu Y, Zhu H. Analytica Chimica Acta. 2012;731:75. doi: 10.1016/j.aca.2012.04.022. [DOI] [PubMed] [Google Scholar]
- 5.Katz SA, Salem H. J. Appl. Toxicol. 1993;13:217. doi: 10.1002/jat.2550130314. [DOI] [PubMed] [Google Scholar]
- 6.Tandon SK, Saxena DK, Gaur JS, Chandra SV. Environ. Res. 1978;15:90. doi: 10.1016/0013-9351(78)90082-8. [DOI] [PubMed] [Google Scholar]
- 7.Katz SA, Salem H. J. Appl. Toxicol. 1993;13:217. doi: 10.1002/jat.2550130314. [DOI] [PubMed] [Google Scholar]
- 8.Sedman RM, Beaumont J, McDonald TA, Reynolds S, Krowech G, Howd R. Journal of environmental science and health. Part C, Environmental carcinogenesis & ecotoxicology reviews. 2006;24:155. doi: 10.1080/10590500600614337. [DOI] [PubMed] [Google Scholar]
- 9.Hayes RB. Cancer Causes Control. 1997;8:371. doi: 10.1023/a:1018457305212. [DOI] [PubMed] [Google Scholar]
- 10.Wang J, Ashley K, Kennedy ER, Neumeister C. Analyst. 1997;122:1307. doi: 10.1039/a704474g. [DOI] [PubMed] [Google Scholar]
- 11.Talebi SM. Environ. Res. 2003;92:54. doi: 10.1016/s0013-9351(02)00036-1. [DOI] [PubMed] [Google Scholar]
- 12.Powell MJ, Boomer DW, Wiederin DR. Analytical Chemistry. 1995;67:2474. [Google Scholar]
- 13.Huang YL, Chuang IC, Pan CH, Hsiech C, Shi TS, Lin TH. Atom. Spectrosc. 2000;21:10. [Google Scholar]
- 14.Tsuyumoto I, Maruyama Y. Analytical Chemistry. 2011;83:7566. doi: 10.1021/ac201606c. [DOI] [PubMed] [Google Scholar]
- 15.Martinez AW, Phillips ST, Whitesides GM, Carrilho E. Analytical Chemistry. 2010;82:3. doi: 10.1021/ac9013989. [DOI] [PubMed] [Google Scholar]
- 16.Parolo C, Merkoci A. Chem. Soc. Rev. 2013;42:450. doi: 10.1039/c2cs35255a. [DOI] [PubMed] [Google Scholar]
- 17.Li X, Ballerini DR, Shen W. Biomicrofluidics. 2012;6 doi: 10.1063/1.3687398. [DOI] [PMC free article] [PubMed] [Google Scholar]
- 18.Ballerini DR, Li X, Shen W. Microfluid. Nanofluid. 2012;13:769. [Google Scholar]
- 19.Liana DD, Raguse B, Gooding JJ, Chow E. Sensors. 2012;12:11505. doi: 10.3390/s120911505. [DOI] [PMC free article] [PubMed] [Google Scholar]
- 20.Carrilho E, Martinez AW, Whitesides GM. Analytical Chemistry. 2009;81:7091. doi: 10.1021/ac901071p. [DOI] [PubMed] [Google Scholar]
- 21.Martinez AW, Phillips ST, Wiley BJ, Gupta M, Whitesides GM. Lab on a Chip. 2008;8:2146. doi: 10.1039/b811135a. [DOI] [PMC free article] [PubMed] [Google Scholar]
- 22.Martinez AW, Phillips ST, Butte MJ, Whitesides GM. Angew Chem Int Ed Engl. 2007;46:1318. doi: 10.1002/anie.200603817. [DOI] [PMC free article] [PubMed] [Google Scholar]
- 23.Shen L, Hagen JA, Papautsky I. Lab Chip. 2012;12:4240. doi: 10.1039/c2lc40741h. [DOI] [PubMed] [Google Scholar]
- 24.Dungchai W, Chailapakul O, Henry CS. Analytica Chimica Acta. 2010;674:227. doi: 10.1016/j.aca.2010.06.019. [DOI] [PubMed] [Google Scholar]
- 25.Vella SJ, Beattie P, Cademartiri R, Laromaine A, Martinez AW, Phillips ST, Mirica KA, Whitesides GM. Analytical Chemistry. 2012;84:2883. doi: 10.1021/ac203434x. [DOI] [PMC free article] [PubMed] [Google Scholar]
- 26.Ge L, Yan JX, Song XR, Yan M, Ge SG, Yu JH. Biomaterials. 2012;33:1024. doi: 10.1016/j.biomaterials.2011.10.065. [DOI] [PubMed] [Google Scholar]
- 27.Jokerst JC, Adkins JA, Bisha B, Mentele MM, Goodridge LD, Henry CS. Analytical Chemistry. 2012;84:2900. doi: 10.1021/ac203466y. [DOI] [PubMed] [Google Scholar]
- 28.Hossain SMZ, Luckham RE, McFadden MJ, Brennan JD. Analytical Chemistry. 2009;81:9055. doi: 10.1021/ac901714h. [DOI] [PubMed] [Google Scholar]
- 29.Hossain SMZ, Ozimok C, Sicard C, Aguirre SD, Ali MM, Li YF, Brennan JD. Anal. Bioanal. Chem. 2012;403:1567. doi: 10.1007/s00216-012-5975-x. [DOI] [PubMed] [Google Scholar]
- 30.Mentele MM, Cunningham J, Koehler K, Volckens J, Henry CS. Anal Chem. 2012;84:4474. doi: 10.1021/ac300309c. [DOI] [PubMed] [Google Scholar]
- 31.Hossain SMZ, Brennan JD. Analytical Chemistry. 2011;83:8772. doi: 10.1021/ac202290d. [DOI] [PubMed] [Google Scholar]
- 32.Apilux A, Siangproh W, Praphairaksit N, Chailapakul O. Talanta. 2012;97:388. doi: 10.1016/j.talanta.2012.04.050. [DOI] [PubMed] [Google Scholar]
- 33.Ratnarathorn N, Chailapakul O, Henry CS, Dungchai W. Talanta. 2012;99:552. doi: 10.1016/j.talanta.2012.06.033. [DOI] [PubMed] [Google Scholar]
- 34.Yang X, Wang EK. Analytical Chemistry. 2011;83:5005. doi: 10.1021/ac2008465. [DOI] [PubMed] [Google Scholar]
- 35.Ratnarathorn N, Chailapakul O, Henry CS, Dungchai W. Talanta. 2012;99:552. doi: 10.1016/j.talanta.2012.06.033. [DOI] [PubMed] [Google Scholar]
- 36.Whitaker MJ. Analytica Chimica Acta. 1985;174:375. [Google Scholar]
- 37.Kong FG, Ni YH. BioResources. 2009;4:1088. [Google Scholar]
- 38.Andersen JET. Analytica Chimica Acta. 1998;361:125. [Google Scholar]
- 39.Lichtin JJ. Ind. Eng. Chem.-Anal. Edition. 1930;2:0126. [Google Scholar]
- 40.Balasubramanian N, Maheswari V. J. AOAC Int. 1996;79:989. [Google Scholar]
- 41.Ravindran A, Elavarasi M, Prathna TC, Raichur AM, Chandrasekaran N, Mukherjee A. Sens. Actuator B-Chem. 2012;166:365. [Google Scholar]
- 42.Zhao L, Jin Y, Yan ZW, Liu YY, Zhu HJ. Analytica Chimica Acta. 2012;731:75. doi: 10.1016/j.aca.2012.04.022. [DOI] [PubMed] [Google Scholar]
- 43.Lai YJ, Tseng WL. Analyst. 2011;136:2712. doi: 10.1039/c1an15162b. [DOI] [PubMed] [Google Scholar]
- 44.Stover NM. J. Am. Chem. Soc. 1928;50:2363. [Google Scholar]
- 45.Ege JF, Silverman L. Analytical Chemistry. 1947;19:693. [Google Scholar]
- 46.Saha B, Gill RJ, Bailey DG, Kabay N, Arda M. React. Funct. Polym. 2004;60:223. [Google Scholar]
Associated Data
This section collects any data citations, data availability statements, or supplementary materials included in this article.


