

Abstract
WebGLORE is a free web service that enables privacy-preserving construction of a global logistic regression model from distributed datasets that are sensitive. It only transfers aggregated local statistics (from participants) through Hypertext Transfer Protocol Secure to a trusted server, where the global model is synthesized. WebGLORE seamlessly integrates AJAX, JAVA Applet/Servlet and PHP technologies to provide an easy-to-use web service for biomedical researchers to break down policy barriers during information exchange.
Availability and implementation: http://dbmi-engine.ucsd.edu/webglore3/. WebGLORE can be used under the terms of GNU general public license as published by the Free Software Foundation.
Contact: x1jiang@ucsd.edu
1 INTRODUCTION
In the biomedical context, a major challenge to ensure sufficient power of a predictive model is to obtain enough samples. This is especially important for scenarios like rare disease prognosis, where individual institutions do not have enough observations. With the massive adaptation of electronic health records, it becomes possible to combine information across institutions to build powerful global models. There are, however, reality challenges in combining raw data because of the privacy concern.
To address privacy challenges, researchers proposed many privacy-preserving models to facilitate data sharing, including models using generalization, noisy perturbation and a hybrid of both techniques. Please refer to Fung’s review Fung et al. (2010). These models try to enforce confidentiality through introducing ‘indistinguishability’, however, may alter values in the original data. Results based on such perturbed data cannot be reliably trusted, for example, in applications like medical surveillance and healthcare decision support. An alternative solution is, instead of releasing data, to share model through secure multiparty computing, which approaches leverage security enhanced protocols (e.g. transmitting aggregated statistics) to offer a practical solution and shed lights on building accurate predictive models without disclosing sensitive raw data. In this manuscript, we target at constructing a collaborative framework for logistic regression through secure multiparty computing. We focus on horizontally partitioned data, i.e. using information from locally hosted databases containing different observations that share the same attributes (i.e. horizontal partitions of stackable sets of patient records), which is most common for cross-institutional studies.
2 METHOD
The authors have previously studied distributed logistic regression models theoretically but there was no practically useful collaborative software framework developed for biomedical data analysts to deploy in real healthcare environment. To close the gap, we developed a software as a service that allows data analysts to easily construct models across different sites. The foundation of this work is based on our previous research: Grid LOgistic REgression (GLORE) (building shared models without sharing data) (Wu et al., 2012) and expectation propagation logistic regression (explorer): distributed privacy-preserving online model learning (Wang et al., 2013).
3 FRAMEWORK
To avoid sensitive data transferring, we developed a heavy-client light-server framework in which raw data related computation tasks are conducted locally. Our system is platform independent and the client-side functionality can be interoperated in a wide variety of environments to cope with arbitrary WebGLORE participants. To ensure wide accessibility of our framework, we developed signed communications between Servlets and Applets using JAVA. Participants only need a web browser to join the collaborative global model construction through Applets. These Applets are embedded in the web pages to handle local computation so that local data never leave their host institutions. Because only signed Applets can execute and communicate with Servlets, we can easily check the validity of inputs from participants on the server side.
WebGLORE uses a three-layer structure. The front-end consists of AJAX-supported web pages, which dynamically reflect the user status (in preparation, prepared, offline) and task status (created, finished). After passing the validity check (i.e. task name, expiration date, model parameters), an initiator can invite participants, who have similar type of data and want to build GLORE together. Once a task is created, invited participants will receive emails from the server; each one is provided with a unique link (e.g. hashed by task name and participant’s email). Our system also memorizes existing collaborators and stores their emails in a list to be quickly retrieved in the invitation panel. After some participants confirm attendance, the task creator (initiator) can trigger the computation at any time so that the server starts to interact with all participants.
When the computation begins, WebGLORE works in an asynchronized manner. In each iteration (Newton–Raphson step), the server combines intermediary results collected from participants. The server renews and distributes the value of globally estimated parameters of the current iteration. The optimization terminates when it meets the accuracy requirement or the iteration number exceeds the maximum iteration limit. Each participant can retrieve reports for the global model or the local model to compare with. These reports contain important statistic graphs and variables, sensitivity, specificity, area under the Receiver-Operating Characteristic (ROC) curve and Hosmer–Lemeshow tests. We also plot the ROC curve and the reliability diagram for the models. Finally, WebGLORE provides each participant with an interface to test additional local observations using the global model. Because WebGLORE does not access individual records, users have to handle missing data, check attribute consistency and ensure data quality.
We picked the myocardial infarction dataset (1253 records), which was collected in Edinburgh, UK (Kennedy et al., 1996), to demonstrate our system. These records were partitioned (314, 313, 313 and 313) in four sites. We selected nine non-redundant features in this dataset including pain in left arm, pain in right arm, nausea, hypoperfusion, ST elevation, new Q waves, ST depression, T wave inversion and sweating. The binary response indicates the presence of disease. We listed two tables from the WebGLORE report. Table 1 summarizes the model performance in terms of discrimination and calibration. Various metrics like Area Under the ROC Curve (AUC), F-score, sensitivity, specificity and type-I error were listed for discrimination. Regarding calibration, the web service calculates the calibration error, also known as, Brier score (i.e. mean squared error from predictions to observations) and conducts two types of Hosmer–Lemeshow tests (H-test and C-test) to evaluate the goodness of fit. Table 2 shows information regarding estimated parameters. A small P-value ( ) indicates the corresponding parameter plays a significant role in prediction.
Table 1.
Summary of the global model performance
| Discrimination | Calibration | ||
|---|---|---|---|
| AUC = 0.699 | F-Score = 0.451 | Calibration error = 0.16 | |
| S.D. = 0.019 | Sensitivity = 0.715 | Hosmer- Lemeshow C-test | Hosmer- Lemeshow H-test |
| C.I. = (0.662, 0.737) | Specificity = 0.592 | 0.01 | 0.51 |
| — | Type-I error = 0.285 | — | — |
Table 2.
Statistics on the globally estimated parameters
| Predictor | Beta | SE | Z-statistic | df | P-value | Odds ratio |
|---|---|---|---|---|---|---|
| Intercept | −1.0158 | 0.1940 | −5.2370 | 1 | 0.0000 | N/A |
| Smoker | 0.0799 | 0.1498 | 0.5331 | 1 | 0.5940 | 1.0831 |
| Family history | 0.2939 | 0.1639 | 1.7933 | 1 | 0.0729 | 1.3417 |
| Pain in left chest | −0.8456 | 0.2010 | −4.2074 | 1 | 0.0000 | 0.4293 |
| Pain in right chest | −0.4011 | 0.2840 | −1.4126 | 1 | 0.1578 | 0.6696 |
| Pain in back | 0.2864 | 0.2292 | 1.2494 | 1 | 0.2115 | 1.3316 |
| Sharp pain | −1.2899 | 0.2344 | −5.5040 | 1 | 0.0000 | 0.2753 |
| Tight pain | 0.1638 | 0.1621 | 1.0105 | 1 | 0.3123 | 1.1779 |
| Previous angina | −0.4165 | 0.1485 | −2.8055 | 1 | 0.0050 | 0.6593 |
| Sex | 0.2450 | 0.1559 | 1.5721 | 1 | 0.1159 | 1.2777 |
df, degree of freedom; SE, standard errors.
Results in tables mentioned earlier in the text match exactly with those of a logistic regression model that was trained on the combined data from all four individual datasets, which validates our system. In addition, WebGLORE (Fig. 1) generates visual measurement like the ROC curve and the reliability diagram to illustrate discrimination and calibration, as shown in Figures 2 and 3, respectively.
Fig. 1.

A screenshot of the WebGLORE system
Fig. 2.
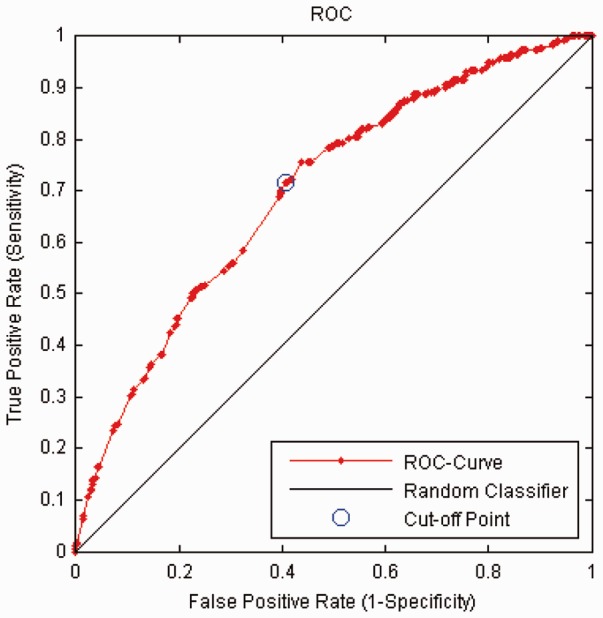
The ROC plot
Fig. 3.
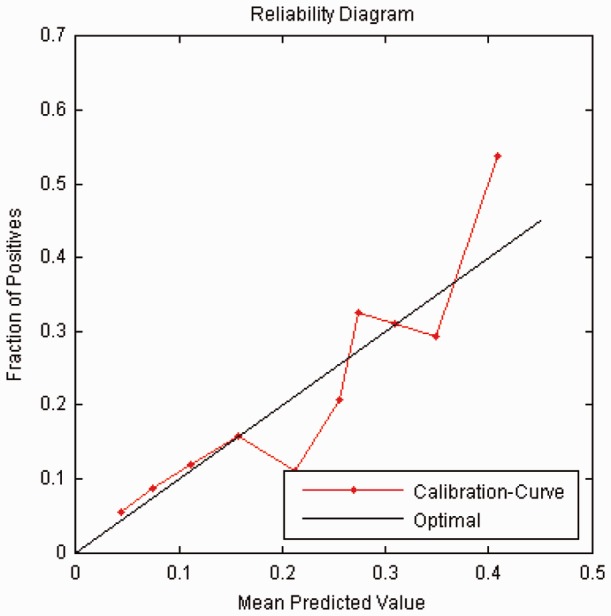
The reliability diagram
Funding: AHRQ grant U13HS19564 (EDM forum) and NIH grants R00LM0011392 and U54HL108640 (in part).
Conflict of Interest: none declared.
REFERENCES
- Fung BCM, et al. Privacy-preserving data publishing: a survey of recent developments. ACM Comput. Surv. 2010;42:1–53. [Google Scholar]
- Kennedy RL, et al. Early diagnosis of acute myocardial infarction using clinical and electrocardiographic data at presentation: derivation and evaluation of logistic regression models. Eur. Heart J. 1996;17:1181–1191. doi: 10.1093/oxfordjournals.eurheartj.a015035. [DOI] [PubMed] [Google Scholar]
- Wang S, et al. Expectation propagation logistic regression (explorer): distributed privacy-preserving online model learning. J. Biomed. Inform. 2013;46:480–496. doi: 10.1016/j.jbi.2013.03.008. [DOI] [PMC free article] [PubMed] [Google Scholar]
- Wu Y, et al. Grid Binary LOgistic REgression (GLORE): building shared models without sharing data. J. Am. Med. Inform. Assoc. 2012;19:758–764. doi: 10.1136/amiajnl-2012-000862. [DOI] [PMC free article] [PubMed] [Google Scholar]