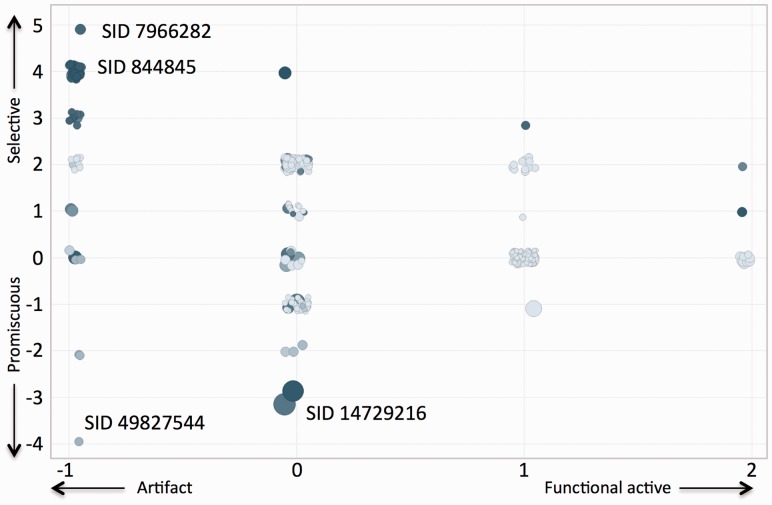
Fig. 5.
Cross-campaign activity category map of tested compounds. ‘Global’ aggregated scores are shown for the different categories reflecting selectivity and functional activity. Promiscuity is the negative selectivity score, size indicates the aggregate confidence score and color corresponds to the number of screening campaigns (increasing from light to dark). Representative structures and data are in Supplementary Table S12

