

Abstract
We expect social networks to change as a result of illness, but social contact data are generally collected from healthy persons. Here we quantified the impact of influenza-like illness on social mixing patterns. We analyzed the contact patterns of persons from England measured when they were symptomatic with influenza-like illness during the 2009 A/H1N1pdm influenza epidemic (2009–2010) and again 2 weeks later when they had recovered. Illness was associated with a reduction in the number of social contacts, particularly in settings outside the home, reducing the reproduction number to about one-quarter of the value it would otherwise have taken. We also observed a change in the age distribution of contacts. By comparing the expected age distribution of cases resulting from transmission by (a)symptomatic persons with incidence data, we estimated the contribution of both groups to transmission. Using this, we calculated the fraction of transmission resulting from (a)symptomatic persons, assuming equal duration of infectiousness. We estimated that 66% of transmission was attributable to persons with symptomatic disease (95% confidence interval: 0.23, 1.00). This has important implications for control: Treating symptomatic persons with antiviral agents or encouraging home isolation would be expected to have a major impact on transmission, particularly since the reproduction number for this strain was low.
Keywords: behavioral change, contact networks, disease transmission, influenza, R0 ratio, social interaction
Knowledge of social networks is vital when seeking to understand and predict the spread of infectious diseases in human populations. In recent years, concerted efforts have been made to characterize patterns of social mixing within communities using electronic motes (1), mobile phones (2), or diaries of self-reported contacts (3–5). As a result, it is now common practice for mathematical models of disease spread to incorporate mixing data to describe interactions between different population subgroups (6–12). However, at present, most models assume that contact patterns remain constant over time. In reality, it is clear that patterns of contact are changeable. For example, social behavior differs between weekdays and weekends (6) and between school terms and holiday periods (6–9, 13). These regular temporal variations in contact patterns can be appropriately included in epidemiologic models, given the increasing availability of data describing them. However, there remains a critical gap in our current knowledge—namely, the impact of illness on social contact patterns. If, as might be expected, people modify their behavior when they are ill, the value to mathematical models of social mixing data collected predominantly from healthy persons is questionable. If illness results in people's taking time off from work or school, avoiding social gatherings, or changing their social behavior in other ways, the behavior of ill persons would be poorly described by commonly collected social contact data. If asymptomatic infections are common or if transmission takes place before symptoms appear, then possible changes in social behavior are less important.
During the 2009 influenza pandemic, we asked persons from England to record their social contacts when they were symptomatic with influenza-like illness (ILI), and again 2 weeks later after they had recovered (9). We analyzed these data, and here we demonstrate that not only does the number of social contacts change when a person is ill, so does the distribution of contacts across age groups. We show that this has a major impact on the basic reproduction number (R0) (14) and the expected age distribution of cases in the population. It is suspected that the 2009 A/H1N1pdm epidemic resulted in a large number of infections that displayed no symptoms or mild symptoms. Both serological data and modeling work indicated that patients with ILI who sought medical attention were a small fraction of the total number of persons with infections in the United Kingdom (13, 15). By comparing the observed age distribution of cases with that predicted by the measured contact patterns of asymptomatic and symptomatic persons, we were able to address one of the more intractable problems of influenza epidemiology: What contribution do asymptomatic persons make to overall influenza transmission? The findings have important implications for public health, since the proportion of transmission resulting from symptomatic persons determines how effective treatment with antiviral agents or home isolation will be in limiting spread of the disease.
MATERIALS AND METHODS
Contact surveys
Social contacts were measured using self-completed contact diaries closely based on those developed in the POLYMOD (Improving Public Health Policy in Europe through the Modelling and Economic Evaluation of Interventions for the Control of Infectious Diseases) Study, a large-scale population-based study carried out in several European countries (3). The current survey was carried out during the A/H1N1pdm influenza epidemic in England in the autumn and winter of 2009–2010 and is described in detail elsewhere (9). In brief, during the epidemic, participants were recruited into the study through questionnaire packs distributed with antiviral medication at 31 antiviral distribution centers throughout England. Participants were asked to complete the questionnaire while they were symptomatic with ILI. For children below 16 years of age, either the children could fill in the diary by themselves or a parent/guardian could fill it in on their behalf. The questionnaire consisted of 2 parts: first, a background survey asking questions about demographic factors (such as age and gender) and the participant's illness (such as onset date and severity); and second, a social contact diary in which participants were asked to record details about each person they met during the course of a day: the gender and (estimated) age of the contact, the social setting and duration of the encounter, the frequency with which that person was met, and whether the encounter involved any skin-to-skin contact (e.g., a handshake, a kiss, or contact sports). Participants were asked to return the questionnaire in a prepaid envelope and to supply their address. Two weeks later (by which time participants were expected to have recovered from their illness), participants were sent a similar, follow-up questionnaire, again including a social contact diary. Thus, during the survey we aimed to obtain 2 contact diaries from each participant: one completed when the participant was symptomatic and one completed after he or she had recovered.
We will refer to persons with symptoms of ILI as “ill” or “symptomatic” and to persons without symptoms of ILI as “healthy” or “asymptomatic.”
A total of 301 participants returned a contact diary with their first questionnaire. A total of 174 participants returned a contact diary with their second questionnaire. One participant did not report his/her age and was excluded from analyses. Not all participants were ill when they completed the first questionnaire, and not all had recovered by the time they completed their second questionnaire. A total of 140 participants returned 2 contact diaries, one completed when they were ill and one completed when they were healthy; these 280 contact diaries made up the paired sample. A total of 283 participants were ill when they completed their first contact diary; these 283 contact diaries completed when participants were ill made up the ill sample. A total of 159 participants were either recovered when they completed their second contact diary (n = 151) or were not ill when they completed their first contact diary and did not complete a second contact diary (n = 8); these 159 contact diaries, completed when participants were healthy, made up the healthy sample. A summary of the participants’ demographic information can be found in Web Table 1 (available at http://aje.oxfordjournals.org/).
Analyses
We compared social mixing patterns reported by ill participants with those reported by healthy participants, investigating both the number of contacts and the distribution of contacts between age groups. Age categorization for children and young adults was based on the United Kingdom schooling system; for the adults, 3 age classes were chosen to allow for likely family, household, and workplace arrangements at different ages. The resulting age classes were ≤3, 4–10, 11–21, 22–45, 46–64, and ≥65 years. We made several comparisons: First, we used the paired contact diaries to assess the impact of ILI symptoms on social mixing behavior at the individual level; and second, we compared unpaired contact diaries (completed by ill or healthy participants) with the POLYMOD data from Great Britain as a historical control.
The contact diaries used in this study had space for encounters with 33 different people to be recorded. Ten participants also reported additional encounters. In the results presented here, we capped the number of encounters at 33. Sensitivity analyses showed no strong deviations when all reported contacts were used.
The contact diaries used in this study give a number of different ways of defining an epidemiologically meaningful encounter. Here, in common with previous studies (16, 17), we focused on 2 possibilities: First, we analyzed all encounters recorded in the diary; and second, we analyzed only those encounters that included physical (skin-to-skin) contact (see Web Table 2 and Web Figures 1 and 2).
Estimating transmission rates
Adapting the methodology of Wallinga et al. (18) and Goeyvaerts et al. (16), we estimate the social contact matrix M, with elements mij representing the mean number of contacts with people in age class j during 1 day reported by a respondent in age class i:
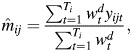 |
where yijt is the reported number of contacts made by participant t in age class i with people in age class j, Ti is the number of participants in age class i, and  is a diary weight for partici-pant t. To be able to compare the current results with those of other studies, such as POLYMOD, the age of the participant and the day on which the contacts were recorded are used in the weighting. Hence, these weights account for different sampling probabilities in different age groups and on different days of the week and consequently yield estimates of population-based contact matrices (further information is available in Web Appendix 1).
We also consider the next-generation matrix G with elements gij representing the average number of secondary infections in age class i resulting from the introduction of a single infectious individual of age class j into a population (14). This next-generation matrix describes how infection is passed within and between age classes and is defined as gij = mjisiDq, where si is the fraction of group i that is susceptible to infection, D is the average duration of infectiousness, and q is the disease-specific (proportionality) factor (16–18). Since people's mixing patterns when ill (symptomatic) are different from those present when they are healthy (asymptomatic), we can calculate matrices MS and GS based on behavior when symptomatic and matrices MA and GA based on behavior when asymptomatic.
Comparing contact matrices
While it is possible to display contact patterns graphically using the social contact matrix M, it is not immediately clear how best to quantify epidemiologically relevant differences between contact matrices.
Here we compare contact patterns using the basic reproduction number, R0, defined as the dominant eigenvalue of the next-generation matrix G when the entire population is susceptible (i.e., si = 1) (14). Following the method of Hens et al. (6), we consider the ratio of estimates of R0 derived from different mixing matrices GS and GA, which is equivalent to comparing the dominant eigenvalues of MS and MA. Under the null hypothesis of equal contact matrices and assuming q to be constant, this ratio is expected to equal 1.
For each comparison, we assess the significance of any deviation from the null hypothesis by calculating 95% confidence intervals based on a paired nonparametric bootstrap (19) (see Web Appendix 2). We also calculate the expected age distribution of incidence in the population during the exponential phase, as given by the leading eigenvector of the next-generation matrix (14, 20).
Contribution of symptomatic cases to influenza transmission
We seek to estimate the proportion of cases generated by asymptomatic individuals, η. To do this, we assume that a proportion φ of infectious individuals are asymptomatic (i.e., have mixing patterns described by MA), with the remaining proportion (1 − φ) being symptomatic (i.e., having mixing patterns described by MS). We assume φ to be the same for all age groups. To obtain an estimate for φ, we consider vmixed, the leading eigenvector of the adapted next-generation operator Gmixed = φqAGA + (1 − φ)qSGS. Here, qA and qS represent the transmissibility for asymptomatic and symptomatic persons, respectively. Multiplying Gmixed by a constant does not change the (normalized) eigenvector; hence, vmixed is also the leading eigenvector of
 . We define
 , from which φ can be deduced if qR is known. The susceptibility of the population (si) in the calculation of GA and GS is obtained from a serological study conducted using samples from England taken during the year prior to the pandemic (21). The predicted distribution of incidence across age groups using Gmixed is compared with general practitioners’ consultation data from England and Wales from the early part of the epidemic (weeks 23–28 in 2009) (22). During this part of the epidemic, the number of cases was growing approximately exponentially; hence, the expected distribution of incidence is given by vmixed, the leading eigenvector of Gmixed. This analysis uses slightly different age groups (≤4, 5–14, 15–44, 45–64, and ≥65 years) to match those in the general practitioners’ data. The optimal value of
  is estimated as the value leading to the smallest least-squares difference between the observed and estimated age distributions of cases, using all contacts, physical contacts, or contacts of a duration longer than 1 hour (these last 2 categories being included for consideration because more intimate and longer-duration contacts have previously been shown to be closely related to transmission patterns (16, 17, 23)). We note that the best-fitting value of
  is independent of the value of qR. The proportion of infections generated by asymptomatic persons is given by
The estimate of η is independent of qR; that is, the fraction of infections caused by asymptomatic persons is independent of the relative transmissibility in symptomatic and asymptomatic persons. Having calculated the best-fitting value for  , then if we are able to independently measure φ we can calculate qR and vice versa.
Further methodological details, including the notation used and details on the weighting process, construction of confidence intervals, and additional analyses, can be found in Web Appendices 1–4.
RESULTS
The general information we used, such as symptoms, severity of illness, and a preliminary analysis of the number of contacts (but not the age distribution of contacts), had been presented previously (9). It was observed that when healthy, people reported an average of 14.9 (95% confidence interval: 11.2, 20.1) contacts each day and, when ill, they reported 3.8 (95% confidence interval: 3.2, 4.6) contacts daily.
Here, we observed that ill people altered whom they contacted (Figure 1). As expected, a large proportion of encounters reported by participants when they were healthy were with people of a similar age as themselves, with particularly high numbers of contacts occurring among schoolchildren and young adults. Indeed, the contact patterns of participants when healthy were very similar to those observed in the POLYMOD Study (see Web Table 2 and Web Figures 1 and 2). In contrast, the strong like-with-like pattern of social mixing was not evident in encounters reported when participants were unwell. We note that the contact patterns displayed in Figure 1 may be asymmetric, since, for example, people contacted by ill participants may have been either ill or healthy.
Figure 1.

Daily numbers of social contacts made between age groups during the 2009 A/H1N1pdm influenza epidemic, England, 2009–2010. Contact patterns were reported by study participants who completed a contact diary on 2 occasions, once when they were asymptomatic (left; n = 140) and once when they were symptomatic (right; n = 140). Colors represent the mean number of encounters reported by each participant with contacts in each age group. There was less like-with-like mixing reported by symptomatic participants.
That illness results in a particular reduction in the number of contacts between people of similar ages can be understood when considering the social setting of encounters (Figure 2, Table 1; also see Web Appendix 3) (24). When ill, participants reported having far fewer contacts in the work/school and leisure settings—both settings where like-with-like mixing between age groups would be expected to take place. In contrast, illness has little discernible effect on the number of contacts made at home. Although it is tempting to assume that home contacts provide an appropriate proxy for contacts made when ill, we did not find this to be the case: Comparing the reported contacts made at home with the reported contacts made during illness, we found an R0 ratio significantly different from 1 (R0 ratio = 1.42, 95% confidence interval: 1.01, 2.53). Turning to the duration of encounters, we see in Figure 2 that in most settings there was a tendency for participants to report briefer encounters when they were ill.
Figure 2.
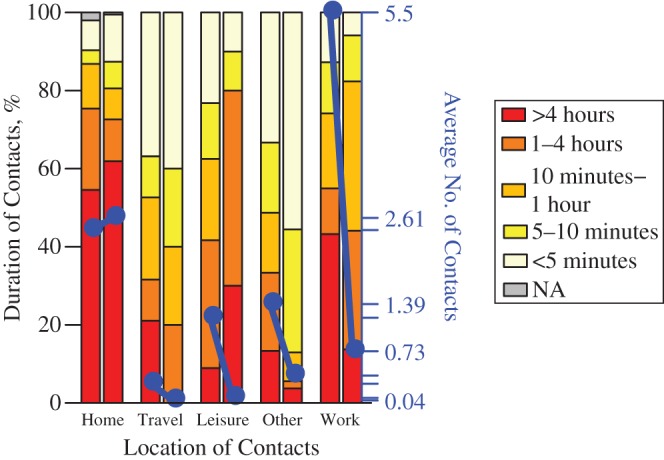
Numbers and durations of encounters in different social settings during the 2009 A/H1N1pdm influenza epidemic for asymptomatic and symptomatic study participants in the paired data set (n = 140), England, 2009–2010. The blue points show the average number of encounters in each setting (right-hand axis), and the colors show the distribution of encounter durations (left-hand axis). For each pair of bars, the left-hand bar represents contacts made when asymptomatic, and the right-hand bar represents contacts made when symptomatic. In every location except home, a drop in the average number of contacts can be observed. NA, not applicable.
Table 1.
Relative Change in the Number of Contacts Made When Experiencing Influenza-like Illness for Different Social Settings During the 2009 A/H1N1pdm Influenza Epidemic (n = 140), England, 2009–2010a,b
| Setting | Relative No. of Contacts | 95% Confidence Interval |
|---|---|---|
| Home | 1.01 | 0.68, 1.34 |
| Work/school | 0.09 | 0.04, 0.14 |
| Travel | 0.13 | 0.01, 0.26 |
| Leisure | 0.06 | 0.01, 0.11 |
| Other | 0.25 | 0.11, 0.39 |
a Results were based on a generalized linear mixed model (Web Appendix 3).
b At all locations except home, a significant decrease in the number of contacts was observed when people were ill.
The altered patterns of social encounters when people are symptomatic result in large reductions in the basic reproduction number, R0. When calculated using the symptomatic contact matrix, R0 is only one-quarter of the value it takes when calculated using the asymptomatic contact matrix (Table 2). These changes also affect the expected distribution of infection during the early stages of an outbreak. As Figure 3 shows, the contact patterns of healthy participants would result in a concentration of incidence among children of primary-school age. However, the contact patterns of ill participants resulted in a greater concentration of incidence in young adults. This effect emerged because children reported far fewer contacts with other children when symptomatic. Because like-with-like mixing was less evident in ill persons, mixing among adults and between adults and children played a greater role in transmission.
Table 2.
Basic Reproduction Numbers for Different Types of Social Contacts Made During the 2009 A/H1N1pdm Influenza Epidemic, England, 2009–2010a
| Comparison | R0 Ratio | 95% Confidence Intervalb |
|---|---|---|
| Results based on all social encounters | ||
| Paired ill vs. healthy (n = 140) | 0.29 | 0.15, 0.56 |
| Healthy (n = 159) vs. POLYMOD GB (n = 1,012) | 1.07 | 0.73, 1.88 |
| Ill (n = 283) vs. POLYMOD GB (n = 1,012) | 0.34 | 0.28, 0.43 |
| Results based on skin-to-skin encounters | ||
| Paired ill vs. healthy (n = 140) | 0.45 | 0.22, 0.60 |
| Healthy (n = 159) vs. POLYMOD GB (n = 1,012) | 0.83 | 0.57, 1.19 |
| Ill (n = 283) vs. POLYMOD GB (n = 1,012) | 0.36 | 0.31, 0.49 |
Abbreviations: GB, Great Britain; POLYMOD, Improving Public Health Policy in Europe through the Modelling and Economic Evaluation of Interventions for the Control of Infectious Diseases.
a Comparisons of ill participants with healthy participants and ill participants with POLYMOD GB participants showed a significant difference in the R0 ratio. Healthy participants and POLYMOD GB participants did not differ significantly.
b Bootstrap-based 95% confidence interval.
Figure 3.

Age distribution of cases in the early stages of the 2009 A/H1N1pdm influenza epidemic as predicted by asymptomatic contact patterns (left; n = 140) and symptomatic contact patterns (right; n = 140) in the paired data set, assuming full susceptibility in the population, England, 2009–2010. The indicated 95% confidence intervals (T-shaped bars) were obtained using a nonparametric bootstrap. Because of the skewness of the underlying distributions, the mean values are not in the middle of the intervals.
Under the assumption that persons with an asymptomatic infection do not change their social contact behavior, we can use our data to estimate the fraction of cases infected by asymptomatic persons, by comparing the age distribution of incidence from general practitioners’ consultation data (points in Figure 4 (both panels)) with that predicted using the ill and healthy contact data (lines in Figure 4 (right panel)). The left panel of Figure 4 shows this estimation method for different φ values (assuming qR = 1): If φ = 0, then only symptomatic persons transmit infection, and the age distribution of cases during the exponential phase of the epidemic would be given by the solid line. If φ = 1, then only asymptomatic persons transmit infection, and the age distribution of cases would be given by the dashed line. We find (see Figure 4 (right panel) and Table 3) that the observed distribution of ILI cases during the early stage of the epidemic is consistent with the majority of transmission's being due to persons with overt symptoms of ILI; we found that approximately two-thirds of the infections (Table 3, “all contacts”) were caused by symptomatic persons. The best fit to the data was found when using patterns of mixing derived from all reported contacts; restricting encounters to those involving some physical contact or those lasting longer than an hour resulted in a poorer fit to the incidence data (Table 3).
Figure 4.

Theory (left) and fit (right) of a model to the observed age distribution from general practitioners’ consultation data from England and Wales for the early phase of the 2009 A/H1N1pdm influenza pandemic (black dots), England, 2009–2010. The left-hand panel shows different φ values (assuming qR = 1, for illustration) leading to different age distributions. The right-hand panel shows the fit obtained using the best-fitting value of  from all capped contacts (the gray area surrounding it indicates the 95% confidence interval, bootstrapping for
  ), from skin-to-skin contacts, and from long-duration contacts (>1 hour).
Table 3.
Estimated Proportions of Influenza Infections Caused by Asymptomatic People During the 2009 A/H1N1pdm Influenza Epidemic, Obtained Using Different Contact Matrices, England, 2009–2010
| Contact Matrix | Fraction of Cases Caused by Asymptomatic Infections | 95% Confidence Interval | Sum of Squared Residualsa |
|---|---|---|---|
| All contacts | 0.34 | 3.61 × 10⁻⁴, 0.77 | 0.0003 |
| Skin-to-skin contacts | 2.35 × 10⁻⁴ | 6.00 × 10⁻⁶, 2.91 × 10⁻¹ | 0.0187 |
| Long-duration contacts (>1 hour) | 0.18 | 1.06 × 10⁻³, 0.35 | 0.0773 |
a A lower value of the sum of squared residuals indicates a better fit to the data.
Using the contact matrices describing all contacts, the best-fitting value for  was 5.86. It has been suggested that approximately two-thirds of infections involved any symptoms of ILI (25), which leads to qR ≈ 2.93, implying that persons with symptomatic infections are about 3 times as infectious per social contact as persons with asymptomatic infections. If it were the case that one-third of infections were symptomatic (e.g., considering only infection that causes fever (25)), then qR would be estimated to be 11.72. If half of the infections were symptomatic, then qR would be estimated to be 5.86.
DISCUSSION
We have quantified the marked effect that being infected with ILI has on people’s social mixing behavior. People report significantly fewer social encounters when they have influenza symptoms. Not only does the number of encounters fall, but the patterns of contact change; people with ILI have fewer contacts at work/school and during leisure activities, which results in fewer contacts in their own age group. This can be understood as a result of people taking time off from work/school and avoiding social activities when ill.
We have found that patterns of incidence during the early stages of the influenza A/H1N1pdm pandemic in England and Wales suggest that symptomatic persons generated the majority of cases. Therefore, there is scope to focus intervention resources on targeting symptomatic persons, encouraging efficient treatment, and recommending time off from work and social distancing for persons with symptoms. It appears that during the A/H1N1pdm epidemic, symptomatic persons were, in general, sufficiently unwell that they moderated their social behavior; had a substantial fraction of them continued to engage in normal social activities, there would have been a large increase in transmission.
R0 is a common measure of viral fitness (26). Using this measure, we have demonstrated that there is a considerable fitness cost associated with illness through the disruption of social networks. Changes in behavior, in our sample, were correlated with severity of illness (measured by number of symptoms reported) (9). However, the presence of symptoms is also correlated with higher transmissibility: If, as seems plausible, between one-third and two-thirds of A/H1N1pdm infections were symptomatic (25), then our calculations suggest that symptomatic infections were 3–12 times as infectious as asymptomatic infections. Therefore, there appears to be a trade-off between infectiousness and opportunities for transmission. Symptomatic persons are more infectious per contact but make fewer contacts than asymptomatic persons.
Accessing symptomatic persons is challenging and, as with any such study, it is possible that the participants in this study were not representative of all people with ILI. However, the fact that patterns of incidence during the early stages of the epidemic were so well predicted by the mixing patterns reported by participants suggests that we succeeded in capturing true epidemiologically relevant behavior. Furthermore, when healthy, the participants had mixing patterns very similar to those found in other social-contact studies, suggesting that the sample was reasonably representative in terms of normal social mixing behavior. We note that the social-contact data used here were collected only in England, while data from other sources have covered all of Great Britain or England and Wales; however, in all cases, the majority of the information came from England, so we are confident that the differences in sampling locations did not affect our conclusions.
The potential limitations of the diary-based approach are well known (27). Collecting data from young children is difficult, since proxies have to be used and people (of any age) may not record all of their contacts. Electronic methods (1) can reduce these problems, but such methods require very high rates of participation in order to record most contacts (27) and are therefore not suitable for a general population survey. Different biases could appear when participants are unwell, which could have affected our results. For example, diaries could be filled in better when people are ill, since fewer contacts are easier to remember and record, or they could be filled in less well, since illness may make participation more burdensome. We were unable to quantify the magnitude of such effects.
In this analysis, the duration of infectiousness was assumed to be equal for symptomatic and asymptomatic persons. The influences of this assumption have not yet been investigated, since they were beyond the scope of this initial paper, but will be the focus of further work. We assumed that infected persons are behaviorally “asymptomatic” or “symptomatic” throughout their infectious period. Alternatively, it is possible that people with symptoms change their social mixing behavior some time after symptom onset or that people are infectious for some time before symptoms appear. Exploring the impact of these possibilities will be the focus of ongoing work; in the models presented here, in the absence of good data with which to link infectiousness, symptom onset, and behavior change, we have taken the simpler approach.
To our knowledge, this study was the first to assess the individual-level impact of infection on social contact patterns and the consequences of altered social encounters on epidemic transmission. Even though the 2009 pandemic influenza strain was relatively mild, the change in contact patterns induced was large and epidemiologically significant. Epidemic models that fail to take these changes into account are likely to be inaccurate—even more so if disease severity is high. Symptomatic persons appear to have been responsible for most of the infection transmission, and efforts to reduce influenza transmission should target them. Indeed, should this result hold for other strains of influenza, identifying, treating, and isolating symptomatic individuals should be the focus of public health efforts in order to prevent transmission to others in the community.
Supplementary Material
ACKNOWLEDGMENTS
Author affiliations: Faculty of Science, Interuniversity Institute for Biostatistics and Statistical Bioinformatics, Hasselt University, Diepenbeek, Belgium (Kim Van Kerckhove, Niel Hens); Faculty of Medicine, Centre for Health Economics Research and Modelling Infectious Diseases, Vaccine and Infectious Disease Institute, University of Antwerp, Campus Drie Eiken, Antwerp, Belgium (Niel Hens); and Centre for the Mathematical Modelling of Infectious Diseases, Department of Infectious Disease Epidemiology, London School of Hygiene and Tropical Medicine, London, United Kingdom (W. John Edmunds, Ken T. D. Eames).
This study was funded by the United Kingdom National Institute of Health Research (project 09/84/157); funding for the analysis was provided through Simulation Models of Infectious Diseases, a strategic basic research project funded by the Agency for Innovation by Science and Technology in Flanders, Belgium (project 06008). K.E. was supported by a Career Development Fellowship award from the National Institute for Health Research (grant NIHR-CDF-2001-04-019). Support was also received from the Interuniversity Attraction Poles Programme of the Belgian Science Policy Office (grant P7/06). N.H. received support from the University of Antwerp Scientific Chair in Evidence-based Vaccinology, financed in 2009–2014 by a gift from Pfizer, Inc. (New York, New York).
We thank the participating antiviral distribution centers for distributing the questionnaires during the pandemic. We thank Prof. Liz Miller of the United Kingdom Health Protection Agency (now Public Health England) for providing the influenza serological data and Dr. Douglas Fleming of the Royal College of General Practitioners for the general practitioners’ consultation data. We thank Dr. Peter White, Dr. Elisabeth Adams, and Natasha Tilston for assistance in carrying out the contact study.
The views expressed in this publication are those of the authors and not necessarily those of the United Kingdom National Health Service, the United Kingdom National Institute for Health Research, or the United Kingdom Department of Health.
Conflict of interest: none declared.
REFERENCES
- 1.Cattuto C, Van den Broeck W, Barrat A, et al. Dynamics of person-to-person interactions from distributed RFID sensor networks. PloS One. 2010;5(7):e11596. doi: 10.1371/journal.pone.0011596. [DOI] [PMC free article] [PubMed] [Google Scholar]
- 2.Eagle N, Pentland AS, Lazer D. Inferring friendship network structure by using mobile phone data. Proc Natl Acad Sci USA. 2009;106(36):15274–15278. doi: 10.1073/pnas.0900282106. [DOI] [PMC free article] [PubMed] [Google Scholar]
- 3.Mossong J, Hens N, Jit M, et al. Social contacts and mixing patterns relevant to the spread of infectious diseases. PLoS Med. 2008;5(3):e74. doi: 10.1371/journal.pmed.0050074. [DOI] [PMC free article] [PubMed] [Google Scholar]
- 4.McCaw JM, Forbes K, Nathan PM, et al. Comparison of three methods for ascertainment of contact information relevant to respiratory pathogen transmission in encounter networks. BMC Infect Dis. 2010;10:166. doi: 10.1186/1471-2334-10-166. [DOI] [PMC free article] [PubMed] [Google Scholar]
- 5.Edmunds WJ, O'Callaghan CJ, Nokes DJ. Who mixes with whom? A method to determine the contact patterns of adults that may lead to the spread of airborne infections. Proc Biol Sci. 1997;264(1384):949–957. doi: 10.1098/rspb.1997.0131. [DOI] [PMC free article] [PubMed] [Google Scholar]
- 6.Hens N, Ayele GM, Goeyvaerts N, et al. Estimating the impact of school closure on social mixing behaviour and the transmission of close contact infections in eight European countries. BMC Infect Dis. 2009;9:187. doi: 10.1186/1471-2334-9-187. [DOI] [PMC free article] [PubMed] [Google Scholar]
- 7.Hens N, Goeyvaerts N, Aerts M, et al. Mining social mixing patterns for infectious disease models based on a two-day population survey in Belgium. BMC Infect Dis. 2009;9:5. doi: 10.1186/1471-2334-9-5. [DOI] [PMC free article] [PubMed] [Google Scholar]
- 8.Eames KT, Tilston NL, Edmunds WJ. The impact of school holidays on the social mixing patterns of school children. Epidemics. 2011;3(2):103–108. doi: 10.1016/j.epidem.2011.03.003. [DOI] [PubMed] [Google Scholar]
- 9.Eames KT, Tilston NL, White PJ, et al. The impact of illness and the impact of school closure on social contact patterns. Health Technol Assess. 2010;14(34):267–312. doi: 10.3310/hta14340-04. [DOI] [PubMed] [Google Scholar]
- 10.Mikolajczyk RT, Akmatov MK, Rastin S, et al. Social contacts of school children and the transmission of respiratory-spread pathogens. Epidemiol Infect. 2008;136(6):813–822. doi: 10.1017/S0950268807009181. [DOI] [PMC free article] [PubMed] [Google Scholar]
- 11.Conlan AJ, Eames KT, Gage JA, et al. Measuring social networks in British primary schools through scientific engagement. Proc Biol Sci. 2011;278(1711):1467–1475. doi: 10.1098/rspb.2010.1807. [DOI] [PMC free article] [PubMed] [Google Scholar]
- 12.Hens N, Shkedy Z, Aerts M, et al. Modeling Infectious Disease Parameters Based on Serological and Social Contact Data: A Modern Statistical Perspective. New York, NY: Springer Publishing Company; 2012. [Google Scholar]
- 13.Eames KT, Tilston NL, Brooks-Pollock E, et al. Measured dynamic social contact patterns explain the spread of H1N1v influenza. PLoS Comput Biol. 2012;8(3):e1002425. doi: 10.1371/journal.pcbi.1002425. [DOI] [PMC free article] [PubMed] [Google Scholar]
- 14.Diekmann O, Heesterbeek JA, Metz JA. On the definition and the computation of the basic reproduction ratio R0 in models for infectious diseases in heterogeneous populations. J Math Biol. 1990;28(4):365–382. doi: 10.1007/BF00178324. [DOI] [PubMed] [Google Scholar]
- 15.Baguelin M, Hoschler K, Stanford E, et al. Age-specific incidence of A/H1N1 2009 influenza infection in England from sequential antibody prevalence data using likelihood-based estimation. PloS One. 2011;6(2):e17074. doi: 10.1371/journal.pone.0017074. [DOI] [PMC free article] [PubMed] [Google Scholar]
- 16.Goeyvaerts N, Hens N, Ogunjimi B, et al. Estimating infectious disease parameters from data on social contacts and serological status. J R Stat Soc Ser C Appl. 2010;59(2):255–277. [Google Scholar]
- 17.Ogunjimi B, Hens N, Goeyvaerts N, et al. Using empirical social contact data to model person to person infectious disease transmission: an illustration for varicella. Math Biosci. 2009;218(2):80–87. doi: 10.1016/j.mbs.2008.12.009. [DOI] [PubMed] [Google Scholar]
- 18.Wallinga J, Teunis P, Kretzschmar M. Using data on social contacts to estimate age-specific transmission parameters for respiratory-spread infectious agents. Am J Epidemiol. 2006;164(10):936–944. doi: 10.1093/aje/kwj317. [DOI] [PubMed] [Google Scholar]
- 19.Efron B, Tibshirani R. An Introduction to the Bootstrap. New York, NY: Chapman & Hall, Inc; 1993. [Google Scholar]
- 20.Vynnycky E, White R. An Introduction to Infectious Disease Modelling. New York, NY: Oxford University Press; 2010. [Google Scholar]
- 21.Miller E, Hoschler K, Hardelid P, et al. Incidence of 2009 pandemic influenza A H1N1 infection in England: a cross-sectional serological study. Lancet. 2010;375(9720):1100–1108. doi: 10.1016/S0140-6736(09)62126-7. [DOI] [PubMed] [Google Scholar]
- 22.Public Health England. Weekly Epidemiological Updates Archive. London, United Kingdom:: Public Health England; 2010. http://www.hpa.org.uk/Topics/InfectiousDiseases/InfectionsAZ/PandemicInfluenza/H1N1PandemicArchive/SIEpidemiologicalData/SIEpidemiologicalReportsArchive/influswarchiveweeklyepireports/ Accessed December 20, 2010. [Google Scholar]
- 23.Melegaro A, Jit M, Gay N, et al. What types of contacts are important for the spread of infections? Using contact survey data to explore European mixing patterns. Epidemics. 2011;3(3-4):143–151. doi: 10.1016/j.epidem.2011.04.001. [DOI] [PubMed] [Google Scholar]
- 24.Molenberghs G, Verbeke G. Models for Discrete Longitudinal Data. New York, NY: Springer Publishing Company; 2005. [Google Scholar]
- 25.Carrat F, Vergu E, Ferguson NM, et al. Time lines of infection and disease in human influenza: a review of volunteer challenge studies. Am J Epidemiol. 2008;167(7):775–785. doi: 10.1093/aje/kwm375. [DOI] [PubMed] [Google Scholar]
- 26.Alizon S, Hurford A, Mideo N, et al. Virulence evolution and the trade-off hypothesis: history, current state of affairs and the future. J Evol Biol. 2009;22(2):245–259. doi: 10.1111/j.1420-9101.2008.01658.x. [DOI] [PubMed] [Google Scholar]
- 27.Read JM, Edmunds WJ, Riley S, et al. Close encounters of the infectious kind: methods to measure social mixing behaviour. Epidemiol Infect. 2012;140(12):2117–2130. doi: 10.1017/S0950268812000842. [DOI] [PMC free article] [PubMed] [Google Scholar]
Associated Data
This section collects any data citations, data availability statements, or supplementary materials included in this article.