

Background: ATP-dependent proteases cannot fully degrade so-called “slippery” substrates.
Results: Reanalysis indicates ClpXP has a reduced unfolding rate for slippery substrates, not a faster substrate release rate.
Conclusion: The proteasome and ClpXP share a common mechanism of inhibition by slippery substrates.
Significance: Comparison of the mechanisms of ATP-dependent proteases across species help explain how these unfolding machines work and evolve.
Keywords: ATP-dependent Protease, Enzyme Kinetics, Pre-steady-state Kinetics, Proteasome, Protein Degradation, Protein Denaturation, Protein Evolution, Protein Translocation, Protein Unfolding
Abstract
ATP-dependent proteases are responsible for most energy-dependent protein degradation across all species. Proteases initially bind an unstructured region on a substrate and then translocate along the polypeptide chain, unfolding and degrading protein domains as they are encountered. Although this process is normally processive, resulting in the complete degradation of substrate proteins to small peptides, some substrates are released prematurely. Regions of low sequence complexity within the substrate such as the glycine-rich region (GRR) from p105 or glycine-alanine repeats (GAr) from the EBNA1 (Epstein-Barr virus nuclear antigen-1) protein, can trigger partial degradation and fragment release. Loss of processivity could be due to inability to hold on to the substrate (faster release) or inability to unfold and degrade a substrate domain (slower unfolding). I previously showed that the GRR slows domain unfolding by the proteasome (Kraut, D. A., Israeli, E., Schrader, E. K., Patil, A., Nakai, K., Nanavati, D., Inobe, T., and Matouschek, A. (2012) ACS Chem. Biol. 7, 1444–1453). In contrast, a recently published study concluded that GArs increase the rate of substrate release from ClpXP, a bacterial ATP-dependent protease (Too, P. H., Erales, J., Simen, J. D., Marjanovic, A., and Coffino, P. (2013) J. Biol. Chem. 288, 13243–13257). Here, I show that these apparently contradictory results can be reconciled through a reanalysis of the ClpXP GAr data. This reanalysis shows that, as with the proteasome, low complexity sequences in substrates slow their unfolding and degradation by ClpXP, with little effect on release rates. Thus, despite their evolutionary distance and limited sequence identity, both ClpXP and the proteasome share a common mechanism by which substrate sequences regulate the processivity of degradation.
Introduction
ATP-dependent proteases are present in all organisms and are responsible for the unfolding and degradation of intracellular proteins (1). Substrates include damaged or misfolded proteins as well as short-lived regulatory proteins whose rapid turnovers are important for cellular processes such as transcriptional regulation and cell cycle control. ATP-dependent proteases share a common architecture, with protease active sites sequestered within the interior of a barrel-shaped multi-protein complex whose opening is too narrow to admit folded proteins. A ring of ATP-dependent motor proteins guards the entrance to this degradation chamber, linking ATP hydrolysis to the unfolding and translocation of substrate proteins through the motor protein pore into the degradation chamber (1).
In bacterial cells, a number of different ATP-dependent proteases, including Lon, FtsH, HslUV, ClpAP, and ClpXP, are collectively responsible for ATP-dependent protein turnover (1). These proteases mostly recognize their substrates through sequence motifs at the N or C termini of the substrate proteins, and different proteases appear to have overlapping specificities (1–3). Additionally, these proteases appear to differ in their intrinsic ability to unfold and degrade substrate proteins, which may also be substrate-dependent, perhaps providing an additional contribution to the specificity of protein degradation (3–6).
In the cytoplasm and nucleus of eukaryotes a single protease, the 26S proteasome, is responsible for ATP-dependent protein degradation (7). The proteasome consists of a 20S core particle analogous to the protease degradation chamber component of the bacterial proteases and a 19S regulatory particle containing 19 subunits, including a hetero-hexameric ring of motor proteins (Rpt1–Rpt6) that are distantly related to the bacterial homo-hexameric motor ring of ClpX or HslU (∼10% identity). Substrate proteins are targeted to the 19S particle of the proteasome by the attachment of a chain of ubiquitin proteins. After binding, the substrate can be unfolded, translocated into the 20S particle, and degraded, simultaneously releasing the chain of ubiquitin proteins to be broken apart and reused (7, 8).
ATP-dependent proteases in both bacteria and eukaryotes are processive, moving from one end of a substrate to the other end (or in some cases, starting in the middle followed by bi-directional movement) until the substrate has been completely unfolded and degraded (9, 10). Thus, these proteases can be thought of as molecular motors that walk along a protein backbone track, unfolding as they go. Processivity, or the ability to continue walking along the track without falling off, is presumably important because a loss of processivity would generate partially degraded protein fragments that no longer contain a degradation signal. Such fragments might be dangerous for the cell, leading to aggregation, uncontrolled enzymatic or transcription factor activity, or other problems. However, release of certain partially degraded proteins has a biological purpose. Fragments from partially degraded proteins have been shown to have new biological activities, suggesting that “processing” by ATP-dependent proteases can be an important post-translational regulatory mechanism in the cell (11).
The first established example of processing by an ATP-dependent protease was that of the p105 precursor to the p50 subunit of the transcription factor NFκB by the proteasome (12). The p105 protein has a Rel homology domain followed by a glycine-rich region (GRR)2 followed by a degron containing a ubiquitination signal and initiation site. Degradation stalls at the Rel homology domain and is dependent on the stability of the domain and on the presence of the GRR or another low complexity sequence (13, 14). Presumably, the motor proteins are gripping the GRR while failing to unfold the Rel homology domain, and something about this interaction prevents unfolding from occurring or allows the domain to slip away.
The GRR sequence reduces the processivity of the proteasome in its normal biological context (p105), when combined with proteins such as dihydrofolate reductase (DHFR) in in vitro degradation assays, and also reduces the processivity of bacterial proteases such as ClpXP and ClpAP (3, 6, 14). Another low complexity sequence, a Gly-Ala repeat (GAr) in the EBNA1 (Epstein-Barr virus nuclear antigen-1) protein, inhibits proteasomal degradation of EBNA1 in cells, reduces proteasomal processivity in model substrates, and has recently been shown to reduce processivity of the bacterial protease ClpXP (15–20). Thus, it appears that sequence-dependent changes in protease processivity may be conserved across distantly related species, despite the limited sequence identity between ClpX and the Rpt subunits of the proteasome. However, there have been conflicting models proposed for how these low complexity sequences or “slippery substrates” alter processivity. In the first model, low complexity regions decrease the rate of substrate unfolding and degradation (6), whereas in the second, they increase the rate of substrate release by the protease (20).
We investigated the processivity of the proteasome using a substrate consisting of a ubiquitination signal and initiation site, an easily unfoldable barnase domain and a more difficult to unfold DHFR domain (see Fig. 1A) (6). Upon stabilization of the DHFR domain with the ligand NADPH, some full-length substrate was converted to fragment, allowing the determination of an unfolding ability (U = kdegfrag/krelfrag) for DHFR. When the proteasome was at sufficiently high concentrations (and in excess of substrate), we observed first the formation of a fragment that remained bound to the proteasome followed by its partial degradation (disappearance) or release (failure to disappear; this could also represent proteasome permanently bound to the remaining piece of substrate, but other experiments confirmed the fragment was no longer bound to the proteasome). We then used kinetic modeling to determine the individual rate constants kdegfrag and krelfrag by globally fitting the time courses of full-length substrate disappearance and fragment formation and disappearance. We then tested substrates containing either the GRR from p105 or a control high complexity sequence immediately adjacent to the DHFR domain and found that the large decrease in processivity induced by the GRR sequence was due almost entirely to a 7- to 15-fold decrease in kdegfrag, with only a small change in krelfrag. Thus, a low complexity sequence prevented the proteasome from unfolding the adjacent domain rather than causing the substrate to fall out more easily (6).
FIGURE 1.
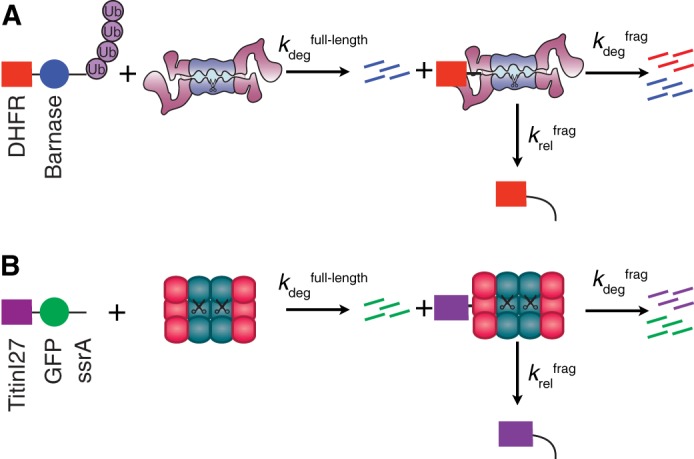
Protease processivity kinetic schemes. A, kinetic scheme to analyze proteasomal processivity modified from Ref. 6. Substrate, containing a degron (polyubiquitin (Ub) modification plus unstructured region) followed by barnase, an easily degraded domain (blue circle) and DHFR, a domain more resistant to degradation (red rectangle), is incubated with the proteasome under single turnover conditions (proteasome in vast excess of substrate such that each proteasome only reacts with a single substrate molecule). After degradation of barnase (kdegfull-length), the proteasome can partition between release of the DHFR domain (krelfrag), which can be detected as the appearance of a fragment on a gel, or unfolding and degradation of the DHFR domain to peptides (kdegfrag). For simplicity, deubiquitination of the full-length substrate is omitted. B, kinetic scheme to analyze ClpXP processivity, modified from (20). The substrate in this experiment consisted of an ssrA degron that targets the substrate to ClpXP followed by a GFP domain (easily degraded domain, green circle) and a Titin I27 domain (difficult to degrade, purple rectangle).
More recently, an independent study used a similarly structured multidomain substrate (TitinI27-GFP-ssrA degron) to determine how GAr sequences induced fragment formation of the titin I27 domain during degradation by the bacterial protease ClpXP (see Fig. 1B) (20). Using a chase assay to determine kdegfrag and krelfrag (kproc and kout, respectively, in this work), the GAr sequence led to a 12-fold increase in krelfrag with only a minimal change to kdegfrag relative to a control sequence. Thus, for ClpXP, low complexity sequences appeared to cause the protease to release the substrate more rapidly, rather than decreasing the rate of unfolding and degradation (20).
Although both studies agree that low complexity sequences impair degradation, they found that opposing mechanisms were responsible. A low complexity sequence slows forward movement and weakens the ability of the proteasome to unfold and degrade its substrate as normal, but a similar sequence causes ClpXP to release its substrate prematurely. It would be exciting if there were fundamental differences in the way bacterial and eukaryotic ATP-dependent proteases deal with slippery substrates, and it would suggest major differences in the degradation machineries. However, a careful reexamination and reanalysis of the ClpXP GAr data shows that the bacterial and eukaryotic proteases actually behave in a similar manner, with low complexity sequences principally slowing the unfolding and degradation of substrate proteins.
EXPERIMENTAL PROCEDURES
Kinetic Analysis of Chase Experiment
Data points from Fig. 8C of Too et al. (20) were digitized using GraphClick (Arizona Software). Fig. 8C shows the log of total fragment concentration (equal to [protease·fragment] + [fragment]) versus time for the chase experiment, normalized to a scale of 1 to 0. The authors used the log10 rather than a natural log function to linearize their rate data and extract a rate constant ([S]t = [S]0e−kt, so ln([S]t/[S]0) = −kt); this can be easily corrected by multiplying with ln(10). The resulting slope is equal to −kobs, and, as described in the results below, kobs = kdegfrag + krelfrag. Fig. 8B of Too et al. (20) shows the fraction of fragment (relative to the initial amount of full-length substrate) as a function of time for an experiment in which no chase was added. The final [fragment] from Fig. 8B, which is equivalent to the amount of fragment released and not degraded, was used along with the partitioning equation below and kobs to solve for kdegfrag and krelfrag.
 |
Analysis of comparable chase data from Kraut et al. (6) indicate that the normalization and linearization process may lead to modest errors (<30%) in the observed value of kobs due to uneven weighting of the data and uncertainty in the end point, but raw data for the chase experiment was not provided in Ref. 20.
Kinetic Modeling
COPASI (21) was used to simulate the reaction described in Fig. 1B. For simplicity, the step with rate constant kdegfull-length, which includes binding, initiation, unfolding of GFP, and translocation to the I27 domain, was modeled as a first order process. Data points from Fig. 8B of Too et al. (20) were digitized using GraphClick (Arizona Software). Fig. 8B of Too et al. (20) gives the concentration of fragment as a function of time. This data were directly fit to the kinetic scheme in Fig. 1B as described previously (6) to directly obtain values for kdegfrag, krelfrag, and kdegfull-length. Alternatively, the values for kdegfrag and krelfrag were held fixed as described under the “Results.”
To simulate a chase assay, kdegfull-length was changed to 0 after 4 min of degradation. Initial values of kdegfull-length (before the chase) were taken from the fitting of data in Fig. 8B from Too et al. (20) but could not be independently determined because no data for the disappearance of full-length substrate was given. Nonetheless, changes in kdegfull-length between 0.1 and 1 min−1 did not affect the value of kobs determined from the simulated data. Values of kdegfrag and krelfrag were held fixed to the values determined above or the literature values, as described under “Results.” After simulating the chase assay, the data were processed as described (20) to compare with the previously reported results. Briefly, the post-chase fragment concentrations were corrected for any fragment that was ultimately released and then normalized to the initial (chase time) concentration of fragment. Thus, fragment concentration was normalized to a scale of 1 at 4 min to 0 at long times when the reaction was complete. Finally, the log10 of this value was taken and plotted versus the time after the chase.
RESULTS
The authors of the ClpXP study used a classic chase experiment to kinetically isolate a partially degraded intermediate bound to ClpXP and watch it partition between unfolding coupled to irreversible degradation in one branch of the reaction and irreversible release in the other branch (20). Incubating protease with a labeled substrate, waiting until some intermediate had formed, and then chasing with an unlabeled substrate prevented any further binding of labeled substrate, thereby allowing the first-order disappearance of bound intermediate (from degradation) to be observed. This experiment is analogous to starting with some amount of the proteasome·DHFR intermediate in the middle of Fig. 1A and then letting it either degrade (with rate constant kdegfrag) or release (with rate constant krelfrag) (Scheme 1).
SCHEME 1.
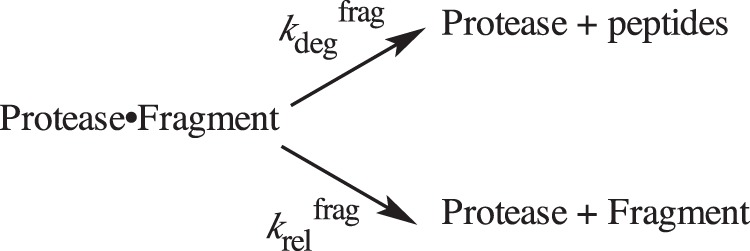
Partitioning of protease-bound fragment between degradation and release.
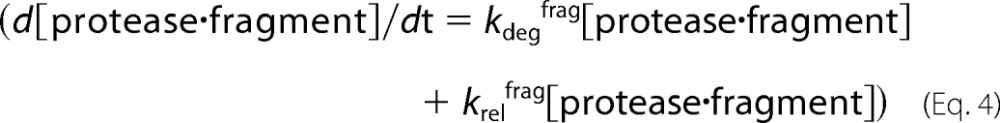
The chase experiment actually follows the total concentration of fragment as a function of time ([protease·fragment] + [fragment]), and a first-order rate constant for the disappearance of fragment was observed. Because the only mechanism by which fragment can disappear is by degradation or processing, the study assumed that the observed rate constant was the molecular rate constant kdegfrag. However, the observed rate constant is actually the sum of the two molecular rate constants for the disappearance of the intermediate (protease·fragment), kdegfrag + krelfrag. The reason for this dependence on both rate constants can be rationalized intuitively by considering what will make the observed rate constant larger. First, if kdegfrag is increased, the initial rate of fragment degradation will increase, increasing the observed rate constant. Less obviously, if krelfrag is increased, the total amount of fragment that ultimately has to be degraded is smaller (since release is occurring faster, and more of the fragment will be released instead of degraded). However, the bound fragment will be degraded with the same initial rate (which depends only on kdegfrag and the initial concentration of bound fragment). With the same initial rate and a smaller amplitude, the observed rate constant for the disappearance of total fragment will by necessity increase.
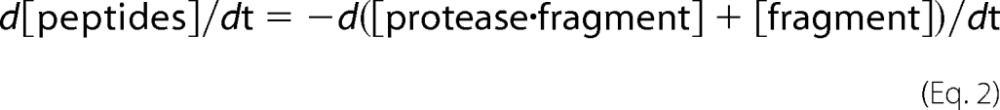
Alternatively, we can see that this relationship (kobs = kdegfrag + krelfrag) follows simply from solving the rate equations directly as demonstrated in kinetics textbooks (22). The derivation is simpler if we consider the rate of appearance of peptides (products of complete degradation) directly instead of the rate of disappearance of fragment, as they will occur with the same rate.
 |
However, [protease·fragment] depends on both kdegfrag and krelfrag.
 |
The rate of peptide appearance must therefore also depend on both kdegfrag and krelfrag. Substituting and integrating (22) yields Equation 5.
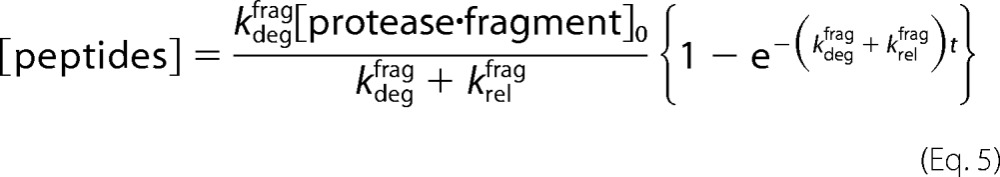 |
The same analysis shows the following.
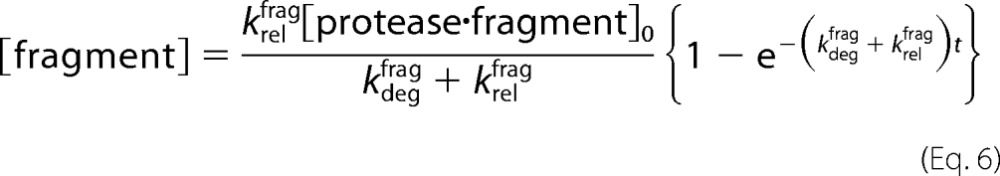 |
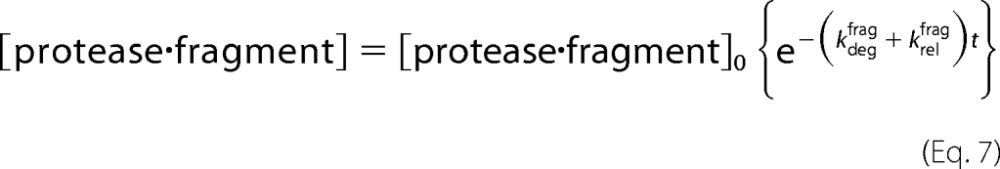 |
Adding these together yields the following.
 |
Thus, the rate of disappearance of total fragment will obey a first-order exponential reaction with an observed rate constant kobs.
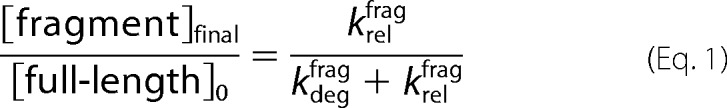
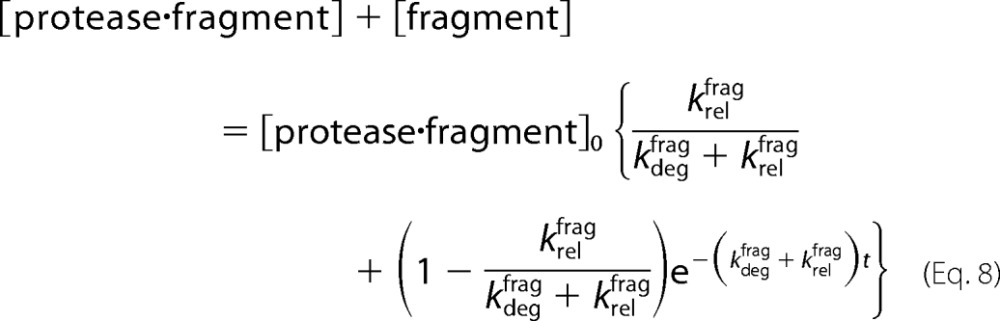
The amount of fragment remaining at the end of the chase reaction is then given by the amount at the beginning of the reaction multiplied by a partitioning function.
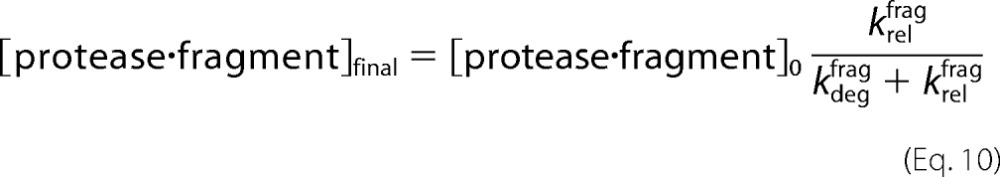 |
Assuming the protease begins to degrade all of the substrate, the final fraction released as fragment (in the absence of a chase) can be expressed similarly (Equation 1).
To further validate the above analysis, kinetic modeling software was used to fit the experimental data shown in Fig. 8B of Too et al. (20), which consists of the fragment formation and disappearance as a function of time in the absence of a chase, to the kinetic scheme of Fig. 1B. When the fit was constrained to force kdegfrag and krelfrag to the values reported by Too et al. (20) (corrected only for conversion to natural log; fit was substantially worse for the control sequence without correction), the fit to the data were poor for both the control and GAr sequences (Fig. 2A). Using the correct rate equation for the disappearance of fragment under chase conditions (Equation 9) and for the total amount of fragment formed in the absence of a chase (Equation 1) allows the calculation of kdegfrag and krelfrag from the reported values of kobs (after conversion from log10 to ln). This reanalysis of the chase experiment results in values for the kinetic parameters very different from those reported by Too et al. (20) (Table 1, chase reanalysis). According to this reanalysis, the GAr sequence causes a 5-fold decrease in the unfolding and degradation rate constant kdegfrag and only a 3.5-fold increase in the release rate krelfrag. Fitting a time course of fragment formation and degradation with these values of kdegfrag and krelfrag held fixed gives substantially better agreement with the data than the original parameters from Too et al. (20) (Fig. 2C). However, the fit was still not perfect, especially for the control sequence. The deviations could stem from peculiarities of the particular example time courses published, or more likely result from noise in the raw data from the chase experiment (only five time points were taken post-chase, and at least for the GAr sequence only a single half-life may have been observed) that is amplified during the linearization procedure of Too et al. (20). We therefore turned to direct fitting of the experimental data in Fig. 8B of Ref. 20.
FIGURE 2.

Kinetic modeling of the ClpXP processivity assay. A, plot of the appearance and disappearance of the I27 fragment in the absence of a chase for the I27-GFP-ssrA substrate. Solid blue and red symbols are a single representative experiment given in Fig. 8B of Too et al. for GAr and control (20), whereas open symbols are from a fit to the kinetic scheme of Fig. 1B holding the parameters kdegfrag and krelfrag determined in Too et al. (20) fixed (without reanalysis other than correcting for the use of a log plot instead of a ln plot). Only kdegfull-length was allowed to vary to improve the fit; values obtained were 1.2 ± 0.2 for the GAr sequence and 0.18 ± 0.02 for the control sequence. A fit using the original parameters (without correcting for the use of a log plot) is shown in purple and orange. B, data were fit as shown in A, but kdegfrag and krelfrag as determined from the reanalysis of the chase experiment (Table 1) were used to constrain the fit. Only kdegfull-length was allowed to vary to improve the fit; values obtained were 0.97 ± 0.02 for the GAr sequence and 0.150 ± 0.005 for the control sequence. C, data were fit as shown in A, allowing all three parameters to vary freely. Values obtained for kdegfull-length were 0.94 ± 0.04 for the GAr sequence and 0.28 ± 0.06 for the control sequence. D, log plot of the disappearance of I27 fragment after a chase versus time for the I27-GFP-ssrA substrate. Time 0 is the chase (which occurred 4 min after initial incubation of protease with substrate). Red is the control sequence and blue is the GAr sequence. Circles indicate values from Fig. 7C of Too et al. (20), squares indicate values from simulating the chase experiment using reanalyzed (from the chase in Too et al. (20)) values of kdegfrag and krelfrag, crosses indicate values from simulating the chase experiment using values of kdegfrag and krelfrag determined from direct fitting, and diamonds indicate values from simulating the chase experiment using values of kdegfrag and krelfrag from (20) without reanalysis (except changing log10 to ln). In all cases, slopes are equal to log(e) × (kdegfrag + krelfrag) from Table 1.
TABLE 1.
Reanalysis of ClpXP chase and partitioning experiments
| Original analysis (Ref. 20)a |
Chase reanalysis |
Direct fitting |
|||||||
|---|---|---|---|---|---|---|---|---|---|
| GAr | Control | Ratio GAr/ctrlb | GAr | Control | Ratio GAr/ctrl | GAr | Control | Ratio GAr/ctrl | |
| krelfrag (min−1) | 0.435 | 0.037 | 11.8 | 0.111 | 0.032 | 3.5 | 0.06 | 0.067 | 0.9 |
| kdegfrag (min−1) | 0.145 | 0.21 | 0.7 | 0.037 | 0.179 | 0.2 | 0.027 | 0.38 | 0.07 |
a Corrected for the use of a log plot.
b ctrl, control.
When kdegfrag and krelfrag, along with kdegfull-length, were allowed to vary during the fitting process, excellent agreement with the data were obtained (Fig. 2C). The parameters derived from the curve fit (Table 1, direct fitting) showed no difference in krelfrag between the control versus GAr sequence (0.067 ± 0.007 min−1 versus 0.06 ± 0.01 min−1) and a 14-fold reduction in kdegfrag caused by the GAr sequence (0.38 ± 0.02 min−1 versus 0.027 ± 0.03 min−1). Because the fitting was applied to the single experiment for each substrate provided by Too et al. (20), without access to concentrations of the full-length substrate as a function of time, these parameters are likely underdetermined. Nonetheless, the simulated overall rates of degradation (kdegfull-length) of between 0.1 and 1 min−1 are reasonable compared with other degradation rates observed in Too et al. (20) and to those found in the analyses above, and both kdegfrag and krelfrag determined from direct fitting of the fragment concentrations are within ∼2-fold of those determined above by reanalysis of the chase experiment.
To further evaluate the original and reanalyzed kinetic parameters, kinetic modeling software was used to simulate a set of chase reactions. After processing the data as described in Too et al. (20) a normalized log plot of the relative fragment concentration versus time was generated and compared with Fig. 8C of Ref. 20 (Fig. 2D). Not surprisingly, almost perfect agreement is seen using kdegfrag and krelfrag determined from the chase reanalysis, and there is qualitative agreement (kobs within ∼2-fold, kobs is greater for the control sequence than for the GAr) for kdegfrag and krelfrag determined by direct fitting. There is a large disagreement, however (∼4-fold difference in kobs in the simulated chase) for the GAr sequence using the kdegfrag and krelfrag values given by Too et al. (20), and those parameters would also predict a larger value of kobs for GAr than for the control sequence, the opposite of what was seen experimentally.
DISCUSSION
The above reanalysis of the effect of the GAr sequence on ClpXP processivity leads to two important conclusions. First, kinetic modeling is a powerful tool to validate the consistency of data with a complicated kinetic scheme (although of course it cannot prove that the scheme is correct). Second, and most importantly, the results obtained from the reanalysis lead to a common mechanism of impaired processivity for both ClpXP and the proteasome. The published analysis of the ClpXP-GAr experiments suggested that the GA repeats inhibit degradation because they cause the substrate to fall out: the GA repeats lead to 12-fold increase in the rate of fragment release (krelfrag) while leaving the unfolding and degradation rate (kdegfrag) almost unchanged (1.4-fold slower). The reanalysis of the original data suggests almost the opposite: averaging the kinetic parameters determined from two independent methods of reanalysis, GA repeats slow unfolding and degradation ∼9-fold and increase release rates only ∼2-fold, and if the more reliable direct fitting approach is used, the effects of the GAr are entirely on unfolding and degradation. These results are similar to our earlier findings with the proteasome where a glycine-rich sequence caused a 7 to 15-fold decrease in the unfolding and degradation rate and only a small change in the fragment release rate (6).
Since the unfolding ability or processivity of both ClpXP and the proteasome are reduced by low complexity sequences such as the GRR from p105 or the GAr from EBNA1, and in both cases the primary mechanism is through a reduction in the ability of the protease to unfold and degrade the substrate rather than through accelerated release, it is likely that the basic mechanism underlying processivity has been conserved between bacteria and eukaroytes despite the evolutionary distance between them. Indeed, the proteasome Rpt motor ring shares a set of so-called “aromatic paddles” with bacterial unfoldases such as ClpX and HslU, and these paddles are predicted to be important for grabbing on to elements of the substrate and translocating them through the central pore (23, 24). Aromatic paddle mutations have been associated with failures of processivity (although the kinetic basis is not known), so it seems likely that substrate modifications that reduce processivity will do so through an interaction with the aromatic paddles (23). Further experiments are necessary to determine how these paddles interact with the peptide chain and how these low complexity sequences affect said interaction. In the case of the proteasome, with six distinct ATPase subunits, it is also possible that some subunits are specialized for different sorts of pulling or holding interactions, or for pulling on different sorts of sequences (24, 25).
Finally, despite the commonalities between the mechanisms of the proteasome and ClpXP, there are also substantial differences in the levels of processivity that each protein displays - for example, in the absence of a low complexity region the proteasome chews through unstabilized Escherichia coli DHFR without leaving a fragment, whereas ClpXP, when degrading a similar substrate, leaves a substantial portion of the DHFR undegraded (3). Understanding these differences in processivity across species and across evolutionary distances will greatly increase our understanding of the shared mechanisms of unfolding and degradation and how they are tuned to give different levels of unfolding ability.
Acknowledgments
The author thanks Andreas Matouschek (University of Texas, Austin), Robert Sauer (Massachusetts Institute of Technology) and Daniel Herschlag (Stanford University) for advice and helpful discussions, and Anita Engh for editorial assistance and helpful discussions.
Footnotes
- GRR
- glycine-rich region
- DHFR
- dihydrofolate reductase
- GAr
- Gly-Ala repeat.
REFERENCES
- 1. Sauer R. T., Baker T. A. (2011) AAA+ proteases: ATP-fueled machines of protein destruction. Annu. Rev. Biochem. 80, 587–612 [DOI] [PubMed] [Google Scholar]
- 2. Schrader E. K., Harstad K. G., Matouschek A. (2009) Targeting proteins for degradation. Nat. Chem. Biol. 5, 815–822 [DOI] [PMC free article] [PubMed] [Google Scholar]
- 3. Koodathingal P., Jaffe N. E., Kraut D. A., Prakash S., Fishbain S., Herman C., Matouschek A. (2009) ATP-dependent proteases differ substantially in their ability to unfold globular proteins. J. Biol. Chem. 284, 18674–18684 [DOI] [PMC free article] [PubMed] [Google Scholar]
- 4. Herman C., Prakash S., Lu C. Z., Matouschek A., Gross C. A. (2003) Lack of a robust unfoldase activity confers a unique level of substrate specificity to the universal AAA protease FtsH. Mol. Cell 11, 659–669 [DOI] [PubMed] [Google Scholar]
- 5. Gur E., Vishkautzan M., Sauer R. T. (2012) Protein unfolding and degradation by the AAA+ Lon protease. Protein Sci. 21, 268–278 [DOI] [PMC free article] [PubMed] [Google Scholar]
- 6. Kraut D. A., Israeli E., Schrader E. K., Patil A., Nakai K., Nanavati D., Inobe T., Matouschek A. (2012) Sequence- and species-dependence of proteasomal processivity. ACS Chem. Biol. 7, 1444–1453 [DOI] [PMC free article] [PubMed] [Google Scholar]
- 7. Finley D. (2009) Recognition and processing of ubiquitin-protein conjugates by the proteasome. Annu. Rev. Biochem. 78, 477–513 [DOI] [PMC free article] [PubMed] [Google Scholar]
- 8. Lander G. C., Martin A., Nogales E. (2013) The proteasome under the microscope: the regulatory particle in focus. Curr. Opin. Struct. Biol. 23, 243–251 [DOI] [PMC free article] [PubMed] [Google Scholar]
- 9. Lee C., Schwartz M. P., Prakash S., Iwakura M., Matouschek A. (2001) ATP-dependent proteases degrade their substrates by processively unraveling them from the degradation signal. Mol. Cell 7, 627–637 [DOI] [PubMed] [Google Scholar]
- 10. Liu C. W., Corboy M. J., DeMartino G. N., Thomas P. J. (2003) Endoproteolytic activity of the proteasome. Science 299, 408–411 [DOI] [PMC free article] [PubMed] [Google Scholar]
- 11. Rape M., Jentsch S. (2002) Taking a bite: proteasomal protein processing. Nat. Cell Biol. 4, E113–E116 [DOI] [PubMed] [Google Scholar]
- 12. Palombella V. J., Rando O. J., Goldberg A. L., Maniatis T. (1994) The ubiquitin-proteasome pathway is required for processing the NF-κB1 precursor protein and the activation of NF-κ B. Cell 78, 773–785 [DOI] [PubMed] [Google Scholar]
- 13. Lin L., Ghosh S. (1996) A glycine-rich region in NF-κB p105 functions as a processing signal for the generation of the p50 subunit. Mol. Cell Biol. 16, 2248–2254 [DOI] [PMC free article] [PubMed] [Google Scholar]
- 14. Tian L., Holmgren R. A., Matouschek A. (2005) A conserved processing mechanism regulates the activity of transcription factors Cubitus interruptus and NF-κB. Nat. Struct. Mol. Biol. 12, 1045–1053 [DOI] [PubMed] [Google Scholar]
- 15. Levitskaya J., Coram M., Levitsky V., Imreh S., Steigerwald-Mullen P. M., Klein G., Kurilla M. G., Masucci M. G. (1995) Inhibition of antigen processing by the internal repeat region of the Epstein-Barr virus nuclear antigen-1. Nature 375, 685–688 [DOI] [PubMed] [Google Scholar]
- 16. Levitskaya J., Sharipo A., Leonchiks A., Ciechanover A., Masucci M. G. (1997) Inhibition of ubiquitin/proteasome-dependent protein degradation by the Gly-Ala repeat domain of the Epstein-Barr virus nuclear antigen 1. Proc. Natl. Acad. Sci. U.S.A. 94, 12616–12621 [DOI] [PMC free article] [PubMed] [Google Scholar]
- 17. Sharipo A., Imreh M., Leonchiks A., Brändén C., Masucci M. G. (2001) cis-Inhibition of proteasomal degradation by viral repeats: impact of length and amino acid composition. FEBS Lett. 499, 137–142 [DOI] [PubMed] [Google Scholar]
- 18. Hoyt M. A., Zich J., Takeuchi J., Zhang M., Govaerts C., Coffino P. (2006) Glycine-alanine repeats impair proper substrate unfolding by the proteasome. EMBO J. 25, 1720–1729 [DOI] [PMC free article] [PubMed] [Google Scholar]
- 19. Daskalogianni C., Apcher S., Candeias M. M., Naski N., Calvo F., Fåhraeus R. (2008) Gly-Ala repeats induce position- and substrate-specific regulation of 26 S proteasome-dependent partial processing. J. Biol. Chem. 283, 30090–30100 [DOI] [PMC free article] [PubMed] [Google Scholar]
- 20. Too P. H., Erales J., Simen J. D., Marjanovic A., Coffino P. (2013) Slippery substrates impair function of a bacterial protease ATPase by unbalancing translocation versus exit. J. Biol. Chem. 288, 13243–13257 [DOI] [PMC free article] [PubMed] [Google Scholar]
- 21. Hoops S., Sahle S., Gauges R., Lee C., Pahle J., Simus N., Singhal M., Xu L., Mendes P., Kummer U. (2006) COPASI–a COmplex PAthway SImulator. Bioinformatics 22, 3067–3074 [DOI] [PubMed] [Google Scholar]
- 22. Fersht A. R. (1999) Structure and Mechanism in Protein Science: A Guide to Enzyme Catalysis and Protein Folding, 2nd Ed., p. 149, W.H. Freeman and Company, New York [Google Scholar]
- 23. Martin A., Baker T. A., Sauer R. T. (2008) Pore loops of the AAA+ ClpX machine grip substrates to drive translocation and unfolding. Nat. Struct. Mol. Biol. 15, 1147–1151 [DOI] [PMC free article] [PubMed] [Google Scholar]
- 24. Erales J., Hoyt M. A., Troll F., Coffino P. (2012) Functional asymmetries of proteasome translocase pore. J. Biol. Chem. 287, 18535–18543 [DOI] [PMC free article] [PubMed] [Google Scholar]
- 25. Śledź P., Unverdorben P., Beck F., Pfeifer G., Schweitzer A., Förster F., Baumeister W. (2013) Structure of the 26S proteasome with ATP-γS bound provides insights into the mechanism of nucleotide-dependent substrate translocation. Proc. Natl. Acad. Sci. U.S.A. 110, 7264–7269 [DOI] [PMC free article] [PubMed] [Google Scholar]