

Background: Loop L5 shapes the enzymology of kinesin motors to meet specific physiologic roles.
Results: L5 is in a dynamic equilibrium of three conformations whose relative proportions shift during the ATPase cycle.
Conclusion: Interactions between L5 and helix α3 modulate the kinetics of microtubule binding.
Significance: Combining transient kinetics with time-resolved fluorescence reveals important insights in the structural dynamics of molecular motors.
Keywords: Electron Microscopy (EM), Fluorescence, Kinesin, Kinetics, Microtubules, Eg5, Anisotropy Decay, Cryo-EM, Stopped Flow, Time-resolved Fluorescence
Abstract
Members of the kinesin superfamily of molecular motors differ in several key structural domains, which probably allows these molecular motors to serve the different physiologies required of them. One of the most variable of these is a stem-loop motif referred to as L5. This loop is longest in the mitotic kinesin Eg5, and previous structural studies have shown that it can assume different conformations in different nucleotide states. However, enzymatic domains often consist of a mixture of conformations whose distribution shifts in response to substrate binding or product release, and this information is not available from the “static” images that structural studies provide. We have addressed this issue in the case of Eg5 by attaching a fluorescent probe to L5 and examining its fluorescence, using both steady state and time-resolved methods. This reveals that L5 assumes an equilibrium mixture of three orientations that differ in their local environment and segmental mobility. Combining these studies with transient state kinetics demonstrates that there is a major shift in this distribution during transitions that interconvert weak and strong microtubule binding states. Finally, in conjunction with previous cryo-EM reconstructions of Eg5·microtubule complexes, these fluorescence studies suggest a model in which L5 regulates both nucleotide and microtubule binding through a set of reversible interactions with helix α3. We propose that these features facilitate the production of sustained opposing force by Eg5, which underlies its role in supporting formation of a bipolar spindle in mitosis.
Introduction
Each member of the kinesin superfamily of molecular motors performs a unique role. Some, like kinesin 1, transport cargoes; some, like kinesin 8 and 13, control microtubule depolymerization; and others, like members of the kinesin 5 family, control spindle segregation during cell division. All of these functions result from the coordination of the kinesin biochemical ATPase and force-generating mechanical cycles. Although the general features of these cycles are highly conserved across the kinesin family, key differences in their enzymologies and mechanics allow for the unique roles that these different isoforms serve (1, 2). These differences result from polymorphisms in critical structural motifs, which control the coupling of nucleotide and microtubule binding to structural transitions in the motor mechanical element, the neck linker (NL).2 One of these consists of an α-helix (α2), which is interrupted by a stem and loop motif that is referred to as L5 (Fig. 1). The length of L5 varies greatly across the kinesin family, being shortest (7–9 residues) in kinesin 1 and CENP-E and longest (18 residues) in members of the kinesin 5 family (2–5).
FIGURE 1.

Nucleotide-dependent structural snapshots of the Eg5 loop L5. A, left, cryo-EM reconstruction (pale orange density; EMDB-2077) of the MT-bound human Eg5 motor domain bound to AMPPNP, viewed toward the nucleotide binding site (14). The density of L5 is highlighted in dark orange. The cryo-EM-derived docked coordinates (PDB entry 4AQV) are depicted in coral apart from the secondary structures adjacent to L5 (colored according to the labels). The loop L5 conformation of the Eg5·AMPPNP crystal structure (PDB entry 3HQD) (12) is superimposed in cyan for comparison. Right, enlarged view of loop L5. The conformation of L5 in the cryo-EM-derived rigor model (orange) and the ADP crystal structure (dark blue; PDB entry 1II6) (13) are also depicted, with the position of Trp-127 shown in a ball and stick representation in each. The residue Tyr-211 in the Eg5·AMPPNP crystal structure is also shown. B, monastrol/ADP-bound crystal structure of the human Eg5 motor domain (PDB entry 1Q0B) viewed toward the nucleotide binding site. Secondary structures adjacent to L5 are colored according to the labels, and monastrol is shown in orange sticks, indicated by an asterisk. Note the extended conformation of helix α3 (green) compared with its short conformation in the MT-bound motor. C, left, cryo-EM reconstruction (pale yellow density; EMDB-2078) of the MT-bound human Eg5 motor domain in the absence of nucleotide (rigor), viewed toward the nucleotide binding site. The density of L5 is highlighted in pink. The cryo-EM-derived docked coordinates (PDB entry 4AQW) are depicted in yellow apart from the secondary structures adjacent to L5 (colored according to the labels). Right, enlarged view of loop L5. The conformations of L5 in the AMPPNP (cyan) and the ADP (dark blue) crystal structures are also depicted, with the position of Trp-127 shown in a ball and stick representation in each. In each panel, the MT plus-end is toward the top, and bound nucleotide is depicted in a space-filling representation. EM reconstructions were contoured according to the expected molecular weight of the complex, and figures were prepared using Chimera (27).
The variability in the length of L5 implies that it plays a key role in modulating the distinct enzymologies of different kinesins. In the case of the kinesin 5 family member Eg5, this conclusion is supported by recent studies that show that L5 regulates the ATPase cycle by modulating ATP binding (4), ADP release (6), microtubule binding (4), and the coupling of ATP binding to NL movement (7). L5 also binds several small molecules that allosterically inhibit the Eg5 ATPase activity (8–10) and that have been examined in phase I and II clinical trials as anti-mitotics in patients with solid malignancies (11).
The structural basis by which L5 accomplishes these tasks remains unclear. However, several crystallographic and cryo-EM studies have demonstrated that this loop undergoes major conformational changes as it transitions through the discrete steps of its mechanochemical cycle (12–14). In a crystallographic model of Eg5·AMPPNP, the apex of L5 makes a close association with the α3 helix (Fig. 1A) that is stabilized by a π stacking interaction between Trp-127 (L5) and Tyr-211 (α3) and an ionic interaction between Glu-128 (L5) and Lys-207 (α3) (12). Both of these are associated with a bending and shortening of the α3 helix in the AMPPNP crystal structure, and both are disrupted in the Eg5·ADP crystal structure (13), in which the α3 helix is longer and straightened, and the switch 1 loop is shortened. A corresponding atomic level model of nucleotide-free Eg5 (referred to in this work as “rigor”) does not exist. However, a cryo-EM reconstruction of a rigor Eg5·microtubule complex has recently been reported (14) and demonstrates that L5 assumes a third conformation, in which it appears to sterically block the catalytic site (Fig. 1C). We have previously proposed that this steric effect might explain two key differences between the Eg5 and kinesin 1 mechanochemical cycles. First, ATP binding to Eg5 is 20–30 times slower than to kinesin 1. Second, although ATP binding precedes neck linker docking in kinesin 1, both events occur simultaneously in Eg5, as if some structure is regulating the timing of both events. Although the resolution of the cryo-EM method (∼10 Å) does not allow for precise visualization of L5 conformations, it does reveal that in rigor, Trp-127 (L5) and Tyr-211 (α3) are likely to be too far from each other to allow for a π stacking interaction (Fig. 1C) (14). However, the model also indicates that other hydrophobic amino acid side chains in α3 and switch I are sufficiently close to L5 to allow hydrophobic interactions. We note that in the crystal structure of the mitotic kinesin nod, Pro-101 (which is located in L5 and corresponds to Pro-121 in Eg5) makes a hydrophobic ring stacking interaction with His-181 in the nod helix α3 (15). Furthermore, we had earlier shown that mutation of Pro-121 to alanine in Eg5 has profound effects on nucleotide and MT binding, speaking to the importance of this residue in regulating the kinetics of the ATPase cycle in this motor.
Although L5 thus undergoes at least three conformational changes during the course of the Eg5 mechanochemical cycle, these structural studies only provide “static” images and do not reveal how L5 dynamics are coupled to ATP binding, hydrolysis, phosphate release, or ADP release. To address these questions, we have attached an environmentally sensitive fluorescent probe to the apex of L5 in a monomeric Eg5 construct and have used transient state kinetics, time-resolved fluorescence, and a novel combination of these two methodologies (16, 17) in order to characterize the nature and timing of the structural changes that occur in this loop during the Eg5 mechanochemical cycle. Our results show that L5 isomerizes between three distinct structural states that can be distinguished by their local environments and rotational dynamics and that the mole fraction of these states undergoes a major shift with a change in microtubule affinity. Combining these results with both published cryo-EM reconstructions (14) and prior studies of L5 with EPR probes (7) allows us to propose a model in which L5 regulates both nucleotide and microtubule binding through a set of interactions with helix α3.
EXPERIMENTAL PROCEDURES
Expression, Purification, Labeling, and ATPase Assays of the W127C Construct
For these studies, we started with a cysteine-light Eg5 monomer (referred to herein as W127CLM), whose properties have been described previously (2, 4). We then generated a construct from this motor domain (MD) monomer containing a single cysteine at position 127 (W127C) and a C-terminal His6 tag by chemical synthesis of the insert (GenScript, Piscataway, NJ). This cysteine is located in the center of L5 and replaces a tryptophan residue that has been shown to make a hydrophobic ring stacking interaction with tyrosine 211 in α3 in AMPPNP (12). The construct was expressed and purified as described previously (2, 4). The W127C construct was labeled with the fluorescent probe monobromobimane (mBBr) by incubation with a 10-fold molar excess of mBBr over MD at 4 °C overnight. Excess probe was removed by gel filtration on Sephadex G25 prepacked columns (PD10, GE Healthcare). Labeling stoichiometries of 1.7–1.9 were routinely achieved (data not shown). The ATPase activity of W127C was determined by measuring phosphate production with a commercially available kit (EnzChek, Molecular Probes).
Transient Kinetic Methodologies
The kinetics of ATP and ADP-induced fluorescence change of mBBr-labeled W127C was measured using a KinTek SF-2004 stopped flow instrument with an instrument dead time of 1.2 ms. Monobromobimane fluorescence was monitored by exciting the fluorophore at 395 nm and observing the emission at 90° to the incident beam through a 500-nm-broad band pass filter. Complexes of MD and MTs (1:4 MD/MT stoichiometry) were formed prior to stopped flow experiments by removing unbound nucleotide through gel filtration (PD10), followed by the addition of 0.2 units/ml apyrase. All kinetic studies were performed in 25 mm HEPES, 50 mm potassium acetate, 5 mm magnesium acetate, 1 mm EGTA, pH 7.50, at 20 °C.
Transient Time-resolved Methodologies
Time-resolved fluorescence and transient time-resolved fluorescence were measured on a custom built time-resolved fluorescence spectrometer. This instrument, described in our previous publications (16, 17), utilizes direct waveform recording to digitize the time-resolved fluorescence emission following a single (1-ns full-width half-maximum) laser pulse from a 10-kHz microchip laser. For time-resolved fluorescence and anisotropy experiments acquired under equilibrium biochemical conditions, samples were placed in a standard quartz cuvette mounted in the optical path of the TRF spectrophotometer. For transient experiments, the excitation laser was focused into the cuvette of a Biologic SFM-20 single mix stopped flow instrument, modified for the acquisition of direct waveform recording-based time-resolved fluorescence (26). Decay waveforms were acquired every 100 μs after rapid mixing in the stopped flow instrument. Transient time-resolved fluorescence and time-resolved anisotropy experiments utilized a 470 ± 10-nm half-width half-maximum bandpass filter (Semrock) to isolate the sample fluorescence from scattered laser light. Polarized time-resolved fluorescence used in anisotropy experiments was detected by direct waveform recording. The G-factor for this instrument is 1.00 ± 0.01, determined by measuring direct light scatter of the excitation line with cross and co-polarization of the excitation and emission source relative to the axis of the laboratory reference frame (16, 17).
Time-resolved Fluorescence Data Analysis
The time-resolved fluorescence waveforms were analyzed utilizing an iterative convolution as described previously (17). Observed decays were fitted by a simulated decay constructed by convolving the measured instrument response function with a multiexponential fluorescence decay model (see supplemental material). Global analysis was performed as described (16, 17), with the fluorescence lifetime shared between waveforms and the pre-exponential mole fraction terms allowed to vary independently. Fluorescence decay models were selected by comparing the global χ2 after minimization of each tested model. This treatment showed that three exponentials were necessary and sufficient to describe the time-resolved fluorescence of mBBr-labeled MD. This model was verified by calculating the χ2 support plane (18, 19). Reported uncertainties in TRF parameters are S.E. values from globally fitting the time-resolved decays from at least three independent experiments.
Biochemical States
In the following discussion, we describe the effect of altering the nucleotide or microtubule content on the effect of a fluorophore attached to L5 from Eg5. For purposes of simplicity, we refer to these changes in terms of five biochemical states defined as follows: rigor, produced by incubating labeled Eg5 with 0.2 unit/ml of Type VII apyrase (Sigma-Aldrich) for 20 min; rigor + MTs, produced by incubation with apyrase as above in the presence of a 4–5-fold molar excess of polymerized tubulin; AMPPNP, produced by adding AMPPNP to a final concentration of 2 mm; AMPNP + MTs, produced by adding AMPPNP to 2 mm in the presence of a 4–5-fold molar excess of polymerized tubulin; and ADP, produced by adding ADP to 2 mm.
RESULTS
Effects of the W127C Mutation and of mBBr Labeling on Steady-state ATPase Kinetics
In Eg5·AMPPNP, a strong MT binding conformation, L5 interacts with α3 via a hydrophobic ring stacking between Trp-127 (L5) and Tyr-211 (α3) and a salt bridge between Glu-128 (L5) and Lys-207 (α3) (12). We reasoned that mutating Trp-127 to cysteine might therefore weaken the L5-α3 interaction and result in a corresponding change in the kinetics of the ATPase cycle of the MD. The presence of a cysteine in this location would also allow us to attach the environmentally sensitive fluorescent probe mBBr to position 127. Because mBBr is similar in size to the indole ring of tryptophan, we reasoned that attaching this probe to the W127C construct might at least partially restore a hydrophobic ring stacking interaction and, in the process, generate a preparation whose fluorescence could detect conformational changes in L5 that occur with nucleotide binding and/or changes in MT affinity.
We measured the MT-stimulated ATPase activity of W127C and of a preparation of W127C that was labeled with mBBr (mBBr/Eg5 molar ratio of 0.77:1). Results are depicted in Fig. 2A. Whereas the value of K0.5,MT for W127C (0.24 ± 0.06 μm; Table 1) is very similar to previously reported values for Eg5 monomeric constructs (2, 20), the value of kcat (4.4 ± 0.2 s−1; Table 1) is ∼50% lower. Labeling W127C with mBBr increases kcat by 55% (to 6.8 ± 0.2 s−1, corrected for 77% labeling with mBBr) while having a negligible effect on K0.5,MT (0.21 ± 0.05 μm). This difference in kcat without a corresponding difference in K0.5,MT implies that the W127C mutation could alter either the steps prior to MT dissociation or those after MT rebinding.
FIGURE 2.

Effect of the W127C mutation and of mBBr labeling on steady state and pre-steady state kinetics. A, microtubule-activated ATPase of W127C (red) and mBBr-labeled W127C (blue). Values of kcat and K0.5,MT are summarized in Table 1. Conditions were as follows: 25 mm HEPES, 50 mm potassium acetate, 5 mm magnesium acetate, 1 mm EGTA, 1 mm DTT, pH 7.50, 20 °C. Data represent the mean ± S.D. (error bars). B, kinetics of ATP-induced MT dissociation. Complexes of W127CLM (magenta), W127C (red), and mBBr-labeled W127C (blue; 84% labeled) with MTs were mixed with varying concentrations of ATP in the stopped flow instrument. The rate constant of the resulting decrease in turbidity is plotted versus final [ATP] and fit to a rectangular hyperbola, defining the maximum rates summarized in Table 1. Conditions were as in A. C, kinetics of binding of MD·ADP to MT. A solution of 2 μm MTs in the presence of 2 mm ATP was mixed with an excess of MD, and the rate constant for the resulting turbidity increase is plotted versus [MD]. The slopes of these linear fits define apparent second order rate constants summarized in Table 1. Data represent the mean ± S.D. (error bars). Conditions were as in A. D, kinetics of MT-stimulated release of 2′dmD. A complex of W127C·2′dmD was mixed in the stopped flow instrument with MTs plus 2 mm ATP, with either MTs in excess (magenta) or W127C·2′dmD in excess (blue). Data for W127C·2′dmD were fit to a rectangular hyperbola, defining a maximum rate summarized in Table 1. Conditions were as in A.
TABLE 1.
Summary of rate and equilibrium constants for W127CLM, W127C, and mBBr-labeled W127C
Conditions were as follows: 25 mm HEPES, 50 mm potassium acetate, 5 mm magnesium acetate, 1 mm EGTA, 1 mm DTT, pH 7.50, 20 °C.
| Description | Methoda | W127CLM | W127C | mBBr-W127C |
|---|---|---|---|---|
| ATP-induced MT dissociation | Turbidity | 10.8 ± 1.3 | 10.1 ± 0.5 | 10.5 ± 0.3 |
| ATP induced mBBr quenching (s−1) | mBBr | 10.7 ± 1.3 | ||
| ADP induced mBBr quenching (s−1) | mBBr | 10.2 ± 2.1 | ||
| Eg5-ADP binding to MT (μm−1s−1) | Turbidity | 5.1 ± 0.9 | 4.3 ± 1.2 | 3.3 ± 1.1 |
| MT-activated ADP dissociation (s−1) | 2′dmD | 76 ± 15b | 5.5 ± 2.1 | |
| Weak → strong transition (s−1) | mBBr | 13.5 ± 1.2 | ||
| Steady state ATPase kcat (s−1) | 8.3 ± 0.5c | 4.4 ± 0.2 | 6.8 ± 0.2 | |
| Steady state ATPase K0.5,MT (μm) | 1.1 ± 0.2c | 0.24 ± 0.06 | 0.21 ± 0.05 |
a Methods include the following: 1) 2′dmD, FRET from microtubule tryptophans to 2′dmD fluorophore; 2) mBBr, fluorescence change in monobromobimane probe at position 127; 3) turbidity, measured in the stopped flow spectrophotometer at 350 nm (W127CLM and W127C) or 420 nm (mBBr-labeled W127C).
b Data from Ref. 4.
c Measurement of ATP-induced dissociation was accomplished by mixing the MD·MT complex with ATP in 200 mm KCl to induce complete dissociation.
Effects of the W127C Mutation on the Transient State Kinetics of the ATPase Cycle
In order to determine the effect of the W127C mutation and of mBBr labeling, we first examined the kinetics of ATP-induced MT dissociation. We monitored this process by mixing microtubule complexes of W127C, mBBr-labeled W127C (84% labeled), and W127CLM with ATP (in the presence of 200 mm KCl to increase the final ionic strength) and monitoring dissociation in the stopped flow instrument by the turbidity change. Under these ionic strength conditions, dissociation is essentially irreversible. As depicted in Fig. 2B and summarized in Table 1, plots of the rate versus [ATP] for these three preparations demonstrate similar extrapolated maximum rate constants. These results imply that the W127C mutation has little effect on the kinetics of ATP hydrolysis and the subsequent strong-to-weak microtubule binding transition, which are the rate-limiting steps in the wild type Eg5 (20). We therefore examined the post-hydrolytic steps in the Eg5 ATPase cycle, first by measuring the kinetics of formation of a weakly bound MD·ADP·MT complex (Fig. 2C). We accomplished this by mixing an excess of MD·ADP with microtubules plus 2 mm ATP in the stopped flow instrument and monitoring the increase in turbidity. For W127C, mBBr-labeled W127C, and W127CLM, the rate constant for this process increased linearly with [MD]. The slopes of these plots, defining apparent second order rate constants, are similar to each other (Table 1), indicating that the kinetics of weak binding of MD·ADP to the MT are likewise similar.
We and others had previously demonstrated that following weak binding of the Eg5·ADP complex to the MT, the MD releases its bound ADP at a rate of 43–76 s−1 (2, 20). We measured the kinetics of ADP release from the W127C construct by mixing a complex of the W127C + 2′-deoxy-3′-mant-ADP (2′dmD) with MTs + 2 mm ATP in the stopped flow instrument. With either MTs or MDs in molar excess, we observed similar results, a decrease in mant fluorescence, reflecting 2′dmD release, associated with a rate constant that varied hyperbolically with [MT] or [MD]. However, unlike our prior results with W127CLM (2), the W127C construct released 2′dmD at a maximum rate that was nearly 14-fold slower, at 5.5 ± 2.1 s−1 (Fig. 2D). This difference is sufficient to explain the lower value of kcat for the W127C ATPase. The corresponding experiment could not be performed on mBBr-labeled W127C, because we found that the high quantum yield of the mBBr probe and its broad emission peak overwhelms the mant fluorophore signal (data not shown). Furthermore, we have found that Eg5, like other kinesins, either does not bind other fluorescent nucleotides (etheno-ADP, TNP-ADP) (data not shown) or, once bound, does not release them (BODIPY TR ADP) (data not shown). We therefore resorted to monitoring the fluorescence of the mBBr probe attached to the W127C construct to see if this could provide us with insights into the effect of substituting an mBBr probe for the Trp-127 residue.
The Fluorescence of mBBr-labeled W127C Monitors an Equilibrium between Weak and Strong MT Binding States
As noted above, crystallographic and cryo-EM studies have shown that L5 undergoes large reorganizations between the rigor, AMPPNP, and ADP biochemical states (12–14), including changes in a hydrophobic ring stacking interaction between Trp-127 and Tyr-211. We therefore hypothesized that placing an environmentally sensitive probe of similar size and ring structure to tryptophan at position 127 would allow us to monitor the strong ↔ weak conformational changes that Eg5 undergoes through its ATPase cycle. We therefore measured the steady-state fluorescence emission spectra of mBBr-labeled W127C, and results are depicted in Fig. 3A. Spectra were obtained in the absence of nucleotide (rigor; blue), in the presence of 2 mm AMPPNP (red), and in the presence of 2 mm ADP (green). Microtubule binding broadened the fluorescence emission but did not appreciably alter the relative quantum yields in the rigor (inset; blue) or AMPPNP state (inset; red). Compared with the rigor state, mBBr fluorescence is reduced ∼30% by AMPPNP and 95% by ADP.
FIGURE 3.

Steady state and transient kinetics studies of mBBr-labeled W127C fluorescence. A, fluorescence emission spectra of mBBr-labeled W127C in rigor (blue), 2 mm AMPPNP (brown), and 2 mm ADP (green). Samples were excited at 395 nm. Conditions were as in Fig. 2. Inset, fluorescence emission of a complex of mBBr-labeled W127C + MTs in rigor (blue) and 2 mm AMPPNP (red), demonstrating that MT binding does not appreciably alter the relative quantum yields in the rigor and AMPPNP biochemical states. B, fluorescence transients produced by mixing a complex of mBBr-labeled W127C + MTs (1:4, MD·MT) with 800 μm ATP (red) or 800 μm ADP (blue). In both cases, the fluorescence decreases in a monophasic process following a brief lag. The jagged curve represents the measured photomultiplier voltage, and the dashed lines represent fits to a single exponential decay. C, plots of rate constants for the transients from the experiment in B versus [ATP] (red) or [ADP] (blue). Data represent the mean ± S.D. (error bars) The dependence on [ATP] or [ADP] was fit to a rectangular hyperbola, defining extrapolated maximum rate constants summarized in Table 1. Conditions were as in Fig. 2. D, kinetics of fluorescence enhancement of mBBr-labeled W127C·ADP produced by mixing with an excess of MTs + 2 mm ATP in the stopped flow instrument. The mBBr/MD molar ratio in this experiment was 0.89, and the sample was mixed with a 4–6-fold molar excess of polymerized tubulin. The resulting fluorescence enhancement consisted of a single monophasic increase following a lag of ∼10 ms (inset, arrowhead). The rate constant for this rising phase varied hyperbolically with [MT], defining a maximum extrapolated rate summarized in Table 1. Inset, fluorescence enhancement produced by mixing 2 μm mBBr-W127C·ADP with 8 μm polymerized tubulin. Error bars, S.D.
These results demonstrate that the mBBr probe can sense a change in L5 state that is associated with some step following nucleotide binding. In order to identify the step(s) in the ATPase cycle to which the mBBr probe is responding, we examined the transient kinetics of these nucleotide-induced changes. We first mixed a nucleotide-free 1:5 mBBr-labeled MD·MT complex, with either ATP or ADP. As predicted from Fig. 2A, we noted a time-dependent decrease in fluorescence intensity in both cases (Fig. 3B), and we fit the resulting transients produced by mixing with excess ATP (red) and ADP (blue) to a single exponential process following a lag of 6–10 ms in duration (Fig. 3B, dashed black lines). The rate constant for the falling phase increased hyperbolically with either nucleotide concentration, defining essentially identical maximum rate constants for ATP and ADP (Fig. 3C and Table 1) and implying that the mBBr probe is monitoring a structural change that occurs after ATP hydrolysis. Furthermore, we also note that these rates are nearly identical to those for nucleotide-induced MT dissociation, as measured by turbidity (Fig. 2B and Table 1).
Taken together, these findings suggest that the drop in mBBr fluorescence reflects conversion of the MD to a weak MT binding state. In turn, this implies that the mBBr probe can also monitor conversion to strong MT binding. Measuring the kinetics of this step can therefore provide us with an estimate for the rate of MT-activated ADP release for mBBr-labeled W127C, because conversion from weak to strong binding has been modeled to occur hand-in-hand with ADP release (2, 20). We therefore mixed a complex of mBBr-W127C·ADP (mBBr/MD molar ratio of 0.89) with an excess of microtubules + 2 mm ATP. The resulting transient consisted of a monoexponential fluorescence rise following a lag of ∼10 ms (Fig. 3D, inset, arrowhead). The rate constant for this rising phase varied hyperbolically with [MT], defining a maximum extrapolated rate of 13.5 ± 1.2 s−1 (Fig. 3D). This result implies that labeling W127C with mBBr accelerates ADP release by ∼2.5-fold and suggests in turn that the capacity to form a reversible hydrophobic ring-stacking interaction between L5 and α3 accelerates ADP release and the transition to strong MT binding in Eg5.
Time-resolved Fluorescence of mBBr-labeled W127C in Strong and Weak MT Binding States
The experiments described above allow us to identify the steps in the Eg5 mechanochemical cycle that the mBBr probe monitors. However, they cannot tell us if L5, to which the mBBr probe is attached, shifts from one discrete conformation to another or from one distribution of conformations to another distribution with a change in biochemical state. We therefore examined mBBr-labeled W127C with time-resolved fluorescence methods, because these can provide information on the number of structural states of a fluorophore as well as on the relative mobilities of these states (18).
Using a nanosecond pulsed laser excitation source (17), we first measured the time-resolved fluorescence decay of mBBr-labeled W127C in rigor, rigor + MTs, AMPPNP + MTs, AMPPNP, and ADP. The resulting fluorescence decays are depicted in Fig. 4A. They were best fit by a global, three-state exponential decay model, which defines three fluorescence lifetimes: τ1 = 13.27 ± 0.01 ns, τ2 = 7.15 ± 0.02 ns, and τ3 = 1.74 ± 0.01 ns (described in detail in the supplemental material and Ref. 17 and tabulated in Table 2). All three lifetimes were present in each biochemical state, but the mole fractions varied from one state to another (Fig. 4B and Table 2). Increasing the complexity of the model by adding a fourth exponential term did not decrease the global χ2 of the fit, whereas decreasing to two exponentials increased χ2 by 2.4-fold, and further decreasing to one increased χ2 more than 10-fold.
FIGURE 4.
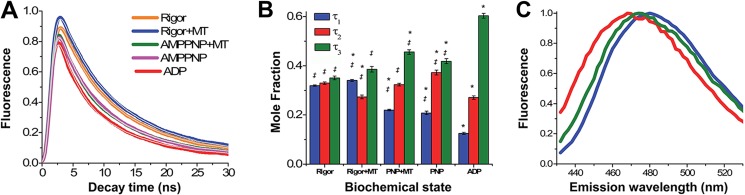
Time-resolved fluorescence of mBBr labeled W127C under rigor (orange), rigor + MT (blue), AMPPNP + MT (green), AMPPNP (magenta), and ADP-MT (red) biochemical states. A, time-resolved fluorescence detected at 470 ± 10 nm. The colored curves represent the data, and the gray curves represent the global TRF fit. B, mole fraction of lifetime species (τ1 (blue), τ2 (red), and τ3 (green)) from the global TRF fit depicted in A. Statistical significance (p < 0.05) was determined by one-way analysis of variance. *, significant between a given lifetime mole fraction and the mole fraction of that lifetime in the rigor sample; ‡, significant difference between a given lifetime mole fraction and the mole fraction of that lifetime in the ADP sample. Error bars, S.E. C, global TRF emission spectra of lifetime species in B (τ1 (blue), τ2 (red), and τ3 (green)). The peak for each emission spectrum is normalized to 1.0.
TABLE 2.
Mole fractions of lifetime-defined states
| Biochemical State | Mole fraction τ1 | Mole fraction τ2 | Mole fraction τ3 |
|---|---|---|---|
| Rigor | 0.32 ± 0.003 | 0.33 ± 0.005 | 0.35 ± 0.01 |
| Rigor + MTs | 0.34 ± 0.004 | 0.27 ± 0.008 | 0.39 ± 0.01 |
| AMPPNP | 0.21 ± 0.007 | 0.37 ± 0.01 | 0.46 ± 0.01 |
| AMPPNP + MTs | 0.23 ± 0.003 | 0.32 ± 0.006 | 0.42 ± 0.01 |
| ADP | 0.13 ± 0.004 | 0.27 ± 0.007 | 0.60 ± 0.01 |
The presence of three lifetimes suggests that the mBBr probe can exist in three distinct orientations. This is supported by our finding (Fig. 4B) that the mole fractions of these three components vary with the biochemical state. In particular, binding of AMPPNP to a rigor + MT preparation reduces the mole fraction of τ1 (Fig. 4B, blue bars) and increases the mole fraction of τ2 (red bars), effectively reversing the relative proportions of these lifetime components. ADP binding causes even more striking shifts, with a large increase in the mole fraction of the τ3 (green bars) component and corresponding drops in those for τ1 and τ2. Further support for our argument that τ1, τ2, and τ3 reflect three distinct conformations comes from measurements of the time-resolved emission spectra corresponding to these lifetimes (described in the supplemental material). As Fig. 4C demonstrates, each of these lifetime components exhibits a unique emission peak that indicates that each component corresponds to a unique dipole orientation of the mBBr fluorophore relative to the local dielectric field. The τ1 spectrum, with a peak at 482 nm, is red-shifted 14 nm from the corresponding spectrum for τ2 (peak at 468 nm), and the peak for the τ3 spectrum is in the middle (475 nm).
Time-resolved Anisotropy Decay of mBBr-labeled W127C in Strong and Weak MT Binding States
We next examined the time-resolved fluorescence anisotropy decay of mBBr-labeled W127C in rigor, rigor + MTs, AMPPNP + MTs, AMPPNP, and ADP in order to get a measure of the relative mobility of the mBBr probe in each of these three lifetime-defined states (τ1, τ2, and τ3). To accomplish this, we started by measuring the polarized time-resolved fluorescence emission of mBBr-labeled W127C at 0°, 54.7° (magic angle), and 90° relative to the excitation source in each biochemical state (rigor, rigor + MTs, AMPPNP + MTs, AMPPNP, and ADP). Fig. 5A illustrates such a measurement for a sample in rigor. We analyzed these data by using a global anisotropy decay model (described in the supplemental material) that allowed us to deconvolve the instrument response function from the observed fluorescence decay. In so doing, we derived a set of three rotational correlation times (Fig. 5B) and three final anisotropies (Fig. 5C). In this model, each lifetime-defined state (τ1, τ2, and τ3) is associated with a unique rotational correlation time (Table 3), whose value is independent of the biochemical state. In particular, the state defined by τ1 rotates with a correlation time of 9.4 ± 0.07 ns, that for τ2 with a correlation time of 1.3 ± 0.02 ns, and that for τ3 with a correlation time of 0.01 ± 0.02 ns. Adding an additional rotational correlation time for any species did not decrease the fit χ2. In this analysis, the initial anisotropy for each probe was 0.4, the theoretical limit, whereas the final anisotropy (Fig. 5C) varied with both lifetime species and biochemical state.
FIGURE 5.
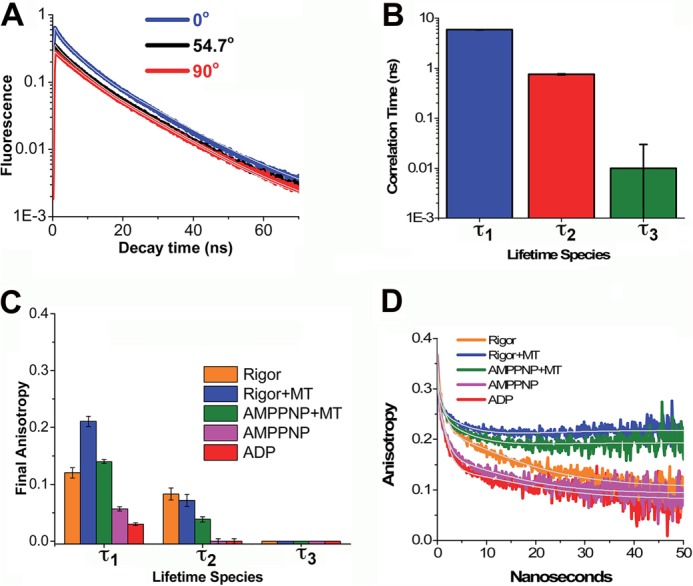
Time-resolved anisotropy of mBBr-labeled W127C as a function of biochemical state. A, example of TRF for mBBr-labeled W127C in a rigor biochemical state, detected by single photon counting with the emission polarizer set at 0° (blue), 54.7° (black), and 90° (red). B, global rotational correlation times for the states defined by τ1 (blue), τ2 (red), and τ3 (green) obtained by global fitting of the TRF waveforms observed at 0°, 54.7°, and 90° in the rigor, rigor + MT, AMPPNP + MT, AMPPNP, and ADP biochemical states. All differences between rotational correlation times are statistically significant to p < 0.001. Error bars, S.D. C, final anisotropies from global fits as described in C. D, apparent anisotropy decays computed according to r(t) = (F(t,0) − F(t,90))/(F(t,0) + 2(F(t,90))). The color code for the data is as indicated. Fits (gray lines) were as described in the supplemental material.
TABLE 3.
Time-resolved fluorescence rotational correlation times, final anisotropies, and cone angles as a function of biochemical state
| Biochemical state | Correlation time |
||
|---|---|---|---|
| τ1, 9.4 ± 0.07 ns | τ2, 1.3 ± 0.02 ns | τ3, 0.01 ± 0.02 ns | |
| Final anisotropy (r∞) | |||
| Rigor | 0.12 ± 0.01 | 0.08 ± 0.01 | 0 ± 0.01 |
| Rigor + MTs | 0.21 ± 0.01 | 0.07 ± 0.01 | 0 ± 0.01 |
| AMPPNP | 0.05 ± 0.004 | 0 ± 0.005 | 0 ± 0.01 |
| AMPPNP + MTs | 0.14 ± 0.004 | 0.04 ± 0.005 | 0 ± 0.01 |
| ADP | 0.03 ± 0.003 | 0 ± 0.004 | 0 ± 0.01 |
| Semi-cone Angle (θ) | |||
| Rigor | 48.6 ± 3.7 | 54.7 ± 6.9 | 90 |
| Rigor + MTs | 36.4 ± 1.6 | 56.8 ± 8.3 | 90 |
| AMPPNP | 59.9 ± 3.7 | 90 | 90 |
| AMPPNP + MTs | 45.8 ± 1.1 | 64.4 ± 7.7 | 90 |
| ADP | 66.9 ± 5.7 | 90 | 90 |
The expected rotational correlation time of a prolate ellipsoid of the size of the Eg5 MD in the absence of MTs is in the range of 20–30 ns (18). The correlation times we measure are less than this, implying that the three lifetime-defined states each display some degree of domain/segmental flexibility. However, these three states differ considerably in the degree of this flexibility. The correlation time associated with τ1 is only about half of that for the entire MD, implying that in this state, L5 is highly structured. That for τ2, although nearly 10 times shorter, is still in the range consistent with some limited mobility around position 127, which presumably reflects interactions with neighboring side chains. By contrast, that for τ3 is in the range expected for a molecule the size of mBBr (18) and implies that in this state, the region of L5 surrounding residue 127 is highly dynamic, allowing nearly unrestricted rotation of the mBBr probe.
Microtubules rotate in solution in the microsecond-millisecond time scale, and this is reflected in the effect of MT binding on the time-resolved anisotropy (Fig. 5D). As the figure demonstrates, MT binding in the rigor or AMPPNP state increases the anisotropy over long time intervals, reflected by a positive slope of the anisotropy decay curves. MT binding increases the final anisotropy of the τ1- and τ2-defined states while having little effect on that for the τ3 state (Fig. 5C). This is also evident from an examination of the semi-cone angles, which are also summarized in Table 3. This term (θ) represents the angular distribution of possible orientations that the mBBr fluorophore can assume (21), and it is related to the initial anisotropy (r0) and final anisotropy (r∞) by the following.
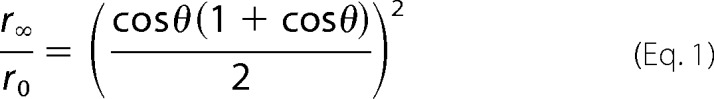 |
Unlike the correlation times, the semi-cone angles (and the final anisotropies from which they are derived) are sensitive to MT binding. As Table 3 demonstrates, the τ3 state can assume a full range of rotational motion (θ = 90°) regardless of biochemical state and even in the presence of MTs. By contrast, the τ1 and τ2 states show a reduction in θ with MT binding. Like the correlation time data summarized above, these results imply that the region of L5 to which the mBBr probe is attached is relatively structured in the τ1 and τ2 states and highly flexible in the τ3 state.
Combining Time-resolved Fluorescence with Transient State Kinetics of mBBr-labeled W127C Can Monitor Nucleotide-induced Changes in the Mole Fractions of the Three L5 Conformations
We concluded this investigation by examining the kinetics by which these conformational states interconvert. To accomplish this, we utilized a novel transient, time-resolved fluorescence methodology (16, 17), which enables us to detect nanosecond scale time-resolved fluorescence decays during a millisecond resolved biochemical transient initiated by rapid mixing with nucleotide. We accomplished this by mixing an mBBr-labeled MD·MT complex with 2 mm ATP or ADP and analyzing the resulting series of time-resolved waveforms (Fig. 6, A and C) using a global time-resolved fluorescence model to determine how nucleotide binding alters the equilibrium between τ1, τ2, and τ3 (summarized in the supplemental material).
FIGURE 6.
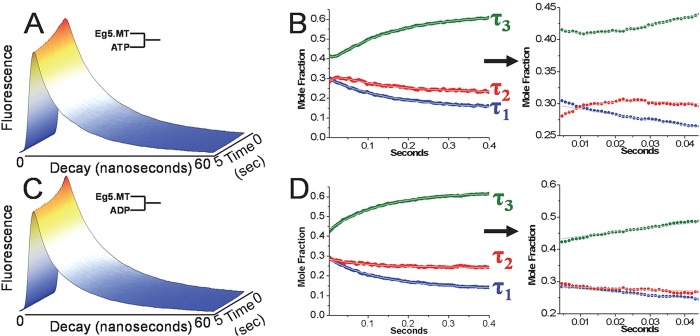
Transient time-resolved fluorescence of a complex of mBBr-labeled W127C + MTs. A, fluorescence transient following mixing with 1 mm ATP. Decay waveforms were obtained every 100 μs after the initial rapid mixing in the stopped flow instrument, and displayed waveforms are the average of 10 successive 100-μs resolution waveforms. The x-y plane illustrates the waveform, and the x-z plane illustrates the evolution of the decay waveform during the course of the reaction. B, time-dependent evolution of the mole fractions of the τ1 (blue), τ2 (red), and τ3 (green) components after rapid mixing with 1 mm ATP. The panel to the right of B (arrow) illustrates the change in mole fraction during the first 50 ms following rapid mixing. Data were fit to a single- or double-exponential rate equation, and rate constants are summarized in Table 4. C, fluorescence transient following mixing with 1 mm ADP. Decay waveforms are depicted as in A. D, time-dependent evolution of the mole fractions of the τ1 (blue), τ2 (red), and τ3 (green) components after rapid mixing with 1 mm ADP. The panel to the right (arrow) illustrates the change in mole fraction during the first 50 ms following rapid mixing. Rate constants derived from a single exponential rate equation are summarized in Table 4.
The analysis of the transient time-resolved fluorescence (Fig. 6, B and D) shows that each of the lifetime species undergoes a transient change in mole fraction following the binding of either ATP or ADP. During the ATP binding transient, the mole fraction of τ1 decreases in a single exponential process with a rate constant of 6.3 ± 0.05 s−1 (Table 4). The transients for τ2 and τ3 are more complex, consisting of an initial small amplitude phase during the first 20 ms (depicted on the shortened time scale in Fig. 6B, right) of the transient, followed by a large amplitude change in the opposite direction. The τ2 mole fraction undergoes an initial increase with a rate constant of 78.4 ± 6.4 s−1, followed by a decrease with rate constant of 7.2 ± 0.1 s−1. The corresponding results for τ3 are the mirror image: a small amplitude decrease with rate constant of 100.7 ± 6.7 s−1, followed by an increase at 6.5 ± 0.04 s−1. By contrast, mixing with ADP produced monoexponential changes in mole fractions for each lifetime component (Fig. 6 and Table 4).
TABLE 4.
Summary of rate constants determined from transient time-resolved fluorescence
| Reaction kinetics parameter | τ1 | τ2 | τ3 |
|---|---|---|---|
| s−1 | |||
| MD-MT × ATP | |||
| k1 | 78.4 ± 6.4 | 100.7 ± 6.7 | |
| k2 | 6.8 ± 0.05 | 6.3 ± 0.05 | 6.5 ± 0.04 |
| MD-MT × ADP | |||
| k1 | 7.8 ± 0.05 | 10.7 ± 0.3 | 7.1 ± 0.06 |
DISCUSSION
Residue Trp-127 in L5 Modulates the Rate of the Weak-to-strong MT Binding Transition in Eg5
Our steady state and transient kinetics studies on the W127C MD (Figs. 2 and 3) demonstrate that this mutation appears to significantly alter one transition in the Eg5 ATPase cycle, MT-activated ADP release. We chose to label this construct with mBBr because this fluorescent probe is environmentally sensitive; is similar in size to tryptophan; and, compared with other environmentally sensitive probes, including 1,5-IAEDANS and coumarin derivatives, can be attached to the W127C construct through a much shorter thioether bond. The kinetics of mBBr fluorescence changes induced by nucleotide binding allows us to conclude that the probe responds to conformational transitions that change MT affinity. Attaching this two-ringed fluorophore to position 127 also increases kcat to wild type levels, suggesting that the probe can at least partially restore a ring stacking interaction with Tyr-211 that might stabilize the weak → strong MT-binding transition. Although the high quantum yield of the mBBr fluorophore prevented us from directly measuring the effect of labeling on the kinetics of 2′dmD release, we were able to establish that the rate constant of the weak → strong transition, a surrogate marker for ADP release, is 2.5-fold faster than that for ADP release from W127C (Fig. 3).
Structural Studies Suggest That L5 Interacts with α3 in at Least Rigor and AMPPNP and That in These Two Strong Binding States, α3 Is Shortened
A crystallographic model of Eg5·AMPPNP (12) demonstrates hydrophobic and ionic interactions between L5 and α3, including but not limited to a π stacking interaction between Tyr-211 and Trp-127, as well as an ionic interaction between Glu-128 and Lys-207. These interactions are disrupted in the Eg5·ADP structure, where α3 is longer and the switch I loop is shortened. Likewise, a cryo-EM reconstruction of a rigor Eg5·MT complex also shows potential interactions between L5 and α3/switch I (Fig. 1C)(14). In this case, L5 appears to occupy a position where it could sterically interfere with ATP binding. Despite these differences, both of these strong binding biochemical states (rigor and AMPPNP) share a common feature; the α3 helix assumes a shorter length than it does in a weak binding biochemical state (ADP) (Fig. 1B). In a previous study, we had proposed that L5 is part of a communication pathway that connects the nucleotide binding site, including switch I, with the microtubule binding domain, including α4 (4). On the basis of our current work, we now propose that this pathway specifically couples the orientations of L5, α3, switch I, and α4. Thus, interactions between L5 and α3, which are monitored by the mBBr probe, favor shortening of α3 and induce in switch I and α4 conformations that are compatible with ATP and MT binding, respectively. Both α3 and L5 contain a number of hydrophobic residues that probably interact with each other to stabilize interactions between these two structural elements. Several structurally unrelated hydrophobic small molecules, including monastrol and ispinesib, bind to this region, and these Eg5 inhibitors drive the MD into a weak MT binding state (8, 9, 22). In the case of ispinesib, this can occur regardless of the occupancy of the nucleotide binding site (9). These small molecules intercalate between L5 and α3 and presumably interfere with these stabilizing α3-L5 hydrophobic interactions. Consistent with our proposal, the length of α3 in the presence of these drugs is the same as it is in Eg5·ADP (23) (Fig. 1B).
Thus, structural methods identify three L5 conformations associated with the rigor, AMPPNP, and ADP biochemical states. However, protein structural states often co-exist as a dynamic equilibrium of conformations, with allosteric modifiers shifting this equilibrium. For example, we have recently shown that the myosin II relay helix exists in a distribution of bent and straight structural states. Nucleotide and actin binding allosterically shift this equilibrium in a manner analogous to the lengthening and shortening of α3 (17). The conditions used for protein crystallographic structure determination, however, do not lend themselves to clearly examining the nature of such a conformational equilibrium. Therefore, in this study, we have utilized the fluorescence emission properties of the mBBr probe at position 127, in conjunction with time-resolved fluorescence methods, to address the following three questions. 1) Can these fluorescence methods identify three distinct L5 conformations? 2) if so, how does the biochemical state shape the relative content of these conformations? 3) when in the Eg5 ATPase cycle, do changes in the distribution of these conformations occur?
Time-resolved Fluorescence Studies Show That in All Biochemical States, L5 Is a mixture of Three Discrete Conformations Whose Equilibrium Is Modified by Nucleotide Binding
The time-resolved fluorescence of mBBr-labeled W127C is best described by a three-component decay equation (Fig. 4) (supplemental material). Although some fluorophores in solution, including mBBr, can exhibit a multiexponential decay because of the presence of rotary isomers (24), several lines of evidence argue that the three-exponential decay we observe for mBBr-labeled W127C reflects three correspondingly distinct protein conformational states. First, we detect large shifts in the time-resolved emission peaks associated with each lifetime component (Fig. 4C), indicating that they reflect a set of discrete states with correspondingly discrete local dielectric constants. Second, the anisotropy decay data indicate that each lifetime component is also associated with distinct segmental flexibility (Fig. 5). Finally, the mole fractions of the lifetime components shift with ATP and ADP binding and with kinetics that are consistent with a nucleotide-induced strong → weak MT binding transition (Fig. 6). These results therefore imply that L5 is in a dynamic equilibrium between three discrete conformations throughout the Eg5 ATPase cycle, with nucleotide acting as an allosteric modifier.
Features of the Three Lifetime-defined States Can Be Mapped onto the Three Crystallographic and Cryo-EM-resolved Structures
As Fig. 4B demonstrates, the state defined by τ3 is predominant in all biochemical states but is particularly so in the ADP state and is characterized by a high degree of mobility (Fig. 5). This is consistent with the crystal structure of Eg5·ADP, where the B-factor for residue 127 is over 2-fold larger than that for the same residue in the Eg·AMPPNP crystal structure (12, 13) These results suggest that the state defined by τ3 corresponds to the structure defined crystallographically as Eg5·ADP. Support for this argument comes as well from transient time-resolved kinetics (Fig. 6). Mixing with ATP (Fig. 6A) produces an increase in the mole fraction of τ3 that follows a short duration, low amplitude phase of decreasing fraction. The rate constant for this decreasing phase is very similar to the rate of ATP binding to Eg5 (2) and implies that ATP binding initially depletes this state, whereas hydrolysis and formation of a weak binding state reverse this and produce a large increase in the τ3 mole fraction. As expected if τ3 reflects the ADP crystallographic structure, this lag phase is absent when the experiment is repeated with ADP instead.
Even in the AMPPNP and rigor biochemical states, τ3 remains the predominant species. However, as the transient time-resolved kinetics show (Fig. 6), mixing with ATP produces a transient increase in τ2 that is the mirror image of what happens to τ3. This suggests that there is rapid exchange between the τ2 and τ3 states, relative to the time scale of ATP hydrolysis and formation of weak binding state. It also implies that the initial binding of ATP increases the mole fraction of the τ2 state, a process that is terminated by subsequent ATP hydrolysis and formation of the weak MT binding state. The τ2 state is the most blue-shifted of the three states (Fig. 4C), consistent with a hydrophobic environment, and it has a moderate degree of rotational restriction, implying some interaction with neighboring side chains. Furthermore, unlike the τ3 state, τ2 becomes depleted with formation of a weakly binding state. We note that in the AMPPNP crystal structure, Trp-127 becomes buried within a relatively hydrophobic pocket (Fig. 1), and we would expect it to have a limited mobility due to side chain interactions. We therefore propose that the structure of the τ2 state is equivalent to the crystallographic and cryo-EM structures of Eg·AMPPNP.
Finally, the state defined by τ1 has the longest fluorescence lifetime and is the most restricted in its mobility. Furthermore, it is more populated than that for τ2 in the rigor and rigor + MT biochemical states and less populated in the AMPPNP and AMPPNP + MT biochemical states. The transient time-resolved kinetic studies show that mixing with either ATP or ADP produces a monoexponential decay in the mole fraction of the τ1 state without a lag. This would be expected if this state corresponds to the rigor biochemical state, because binding of either nucleotide would immediately deplete it. Although a crystal structure of rigor Eg5 is not available, a cryo-EM reconstruction of a rigor Eg5·MT complex suggests that the approximate location of position Trp-127 is located near the apex of the density assigned to L5 (14), in a position where it might be expected to be more solvent-exposed compared with the AMPPNP Eg5·MT complex (Fig. 1C). This could explain the large red shift in the emission spectrum of the τ1 state, compared with that for the τ2 state (Fig. 4C). The rigor model reconstruction also implies that at least a portion of L5 remains in close proximity to α3/switch I. If such a spatial relationship were also associated with stabilizing side chain interactions between these two domains, this could provide sufficient structural rigidity to the entire loop to explain the relatively long rotational correlation time of the mBBr probe in the τ1 state.
A Model of L5 Function
Previous work from several laboratories has shown that the state of L5 affects nucleotide binding as well as MT affinity (4, 6, 7, 10), implying a communication pathway connecting this loop to switch I and α4. Furthermore, the conformation of the α4 helix regulates both MT affinity and NL orientation (25). This may explain why a prior study showed that partial deletion of this loop uncouples NL orientation from nucleotide binding (7). We now propose a model in which L5 interacts with α3 and switch I in a process that kinetically couples nucleotide binding to NL docking and does so through a reciprocating mechanism, trading one set of L5-α3 bonds for another through the Eg5 mechanochemical cycle.
Starting in rigor, we propose that loop L5 is in an equilibrium distribution of three conformations and that two of these, defined by τ1 and τ3, cannot bind ATP and together constitute >75% of MD molecules in this biochemical state (Fig. 4B). In the τ3 state, switch I would be in an “ADP” orientation that cannot stabilize ATP binding. In the τ1 state, ATP binding would also be blocked, in this case due to steric interference with the catalytic site by L5 (14). ATP binding would deplete the τ2 state, shift the τ1 ↔ τ2 equilibrium, and lead immediately to NL docking. This would explain our earlier finding that NL docking and ATP binding in Eg5 occur at the same rate (2). Conversion of the τ1 to the τ2 state would replace one set of L5-α3 interactions with another. Hence, the transition from rigor to ATP would be a reciprocating process, where one set of L5-α3 interactions is replaced by another, relieving the steric blocking of the catalytic site but maintaining strong MT binding. Finally, ATP hydrolysis and Pi release would drive the distribution of L5 states to favor the τ3 orientation, where the catalytic site remains unblocked and these L5-α3 interactions are disrupted, leading to a lengthening of α3 and conversion to a weak MT binding state.
Our model, in conjunction with the previously published cryo-EM reconstructions (Fig. 1) (14), thus proposes that there are major population shifts in three L5 conformations through the ATPase cycle, with different segments of this loop interacting with different residue side chains in α3 in the rigor, ATP, and ADP biochemical states. This in turn implies that the mobility of a spectroscopic probe attached to L5 may vary with the location along this loop. This may explain the results of a prior study (7), in which L5 was labeled with an EPR spin probe at position 124 in order to measure the relative mobility in three biochemical states: rigor + MTs, ADP + MTs, and ADP-AlFx + MTs. The authors of this study found that motion of the probe was restricted in their rigor and ADP biochemical states and was more mobile in the strongly bound ADP-AlFx state, in contrast to our findings (Fig. 5). These differences underscore the importance of subdomain regions within L5 in coupling nucleotide and MT binding to mechanical force generation and will be the subject of future investigations in our laboratories.
This work was supported, in whole or in part, by National Institutes of Health Grants GM102875 (to S. S. R.), AR032961 and AR057220 (to D. D. T.), and AR056191 (to J. M. M.). This work was also supported by Biotechnology and Biological Sciences Research Council Grant BB/H005137/1 (to A. G. and C. M.).

This article contains supplemental Materials, Equations 1–38, and additional references.
- NL
- neck linker
- 1,5-IAEDANS
- 5-((((2-iodoacetyl)amino)ethyl)amino)naphthalene-1 sulfonic acid
- 2′dmD
- 2′-deoxy-3′-mant-ADP
- AMPPNP
- adenosine 5′-(β,γ-imido)triphosphate
- mBBr
- monobromobimane
- MD
- motor domain
- MT
- microtubule
- TRF
- time-resolved fluorescence.
REFERENCES
- 1. Clancy B. E., Behnke-Parks W. M., Andreasson J. O., Rosenfeld S. S., Block S. M. (2011) A universal pathway for kinesin stepping. Nat. Struct. Mol. Biol. 18, 1020–1027 [DOI] [PMC free article] [PubMed] [Google Scholar]
- 2. Rosenfeld S. S., Xing J., Jefferson G. M., King P. H. (2005) Docking and rolling, a model of how the mitotic motor Eg5 works. J. Biol. Chem. 280, 35684–35695 [DOI] [PubMed] [Google Scholar]
- 3. Ferenz N. P., Gable A., Wadsworth P. (2010) Mitotic functions of kinesin-5. Semin. Cell Dev. Biol. 21, 255–259 [DOI] [PMC free article] [PubMed] [Google Scholar]
- 4. Behnke-Parks W. M., Vendome J., Honig B., Maliga Z., Moores C., Rosenfeld S. S. (2011) Loop L5 acts as a conformational latch in the mitotic kinesin Eg5. J. Biol. Chem. 286, 5242–5253 [DOI] [PMC free article] [PubMed] [Google Scholar]
- 5. Rosenfeld S. S., van Duffelen M., Behnke-Parks W. M., Beadle C., Corrreia J., Xing J. (2009) The ATPase cycle of the mitotic motor CENP-E. J. Biol. Chem. 284, 32858–32868 [DOI] [PMC free article] [PubMed] [Google Scholar]
- 6. Waitzman J. S., Larson A. G., Cochran J. C., Naber N., Cooke R., Jon Kull F., Pate E., Rice S. E. (2011) The loop 5 element structurally and kinetically coordinates dimers of the human kinesin-5, Eg5. Biophys. J. 101, 2760–2769 [DOI] [PMC free article] [PubMed] [Google Scholar]
- 7. Larson A. G., Naber N., Cooke R., Pate E., Rice S. E. (2010) The conserved L5 loop establishes the pre-powerstroke conformation of the Kinesin-5 motor, Eg5. Biophys. J. 98, 2619–2627 [DOI] [PMC free article] [PubMed] [Google Scholar]
- 8. Cochran J. C., Gatial J. E., 3rd, Kapoor T. M., Gilbert S. P. (2005) Monastrol inhibition of the mitotic kinesin Eg5. J. Biol. Chem. 280, 12658–12667 [DOI] [PMC free article] [PubMed] [Google Scholar]
- 9. Lad L., Luo L., Carson J. D., Wood K. W., Hartman J. J., Copeland R. A., Sakowicz R. (2008) Mechanism of inhibition of human KSP by Ispinesib. Biochemistry 47, 3576–3585 [DOI] [PubMed] [Google Scholar]
- 10. Kaan H. Y., Major J., Tkocz K., Kozielski F., Rosenfeld S. S. (2013) Snapshots of Ispinesib-induced conformational changes in the mitotic kinesin Eg5. J. Biol. Chem. 288, 18588–18598 [DOI] [PMC free article] [PubMed] [Google Scholar]
- 11. Sarli V., Giannis A. (2008) Targeting the kinesin spindle protein. Basic principles and clinical implications. Clin. Cancer Res. 14, 7583–7587 [DOI] [PubMed] [Google Scholar]
- 12. Parke C. L., Wojcik E. J., Kim S., Worthylake D. K. (2010) ATP hydrolysis in Eg5 kinesin involves a catalytic two-water mechanism. J. Biol. Chem. 285, 5859–5867 [DOI] [PMC free article] [PubMed] [Google Scholar]
- 13. Turner J., Anderson R., Guo J., Beraud C., Fletterick R., Sakowicz R. (2001) Crystal structure of the mitotic spindle kinesin Eg5 reveals a novel conformation of the neck-linker. J. Biol. Chem. 276, 25496–25502 [DOI] [PubMed] [Google Scholar]
- 14. Goulet A., Behnke-Parks W. M., Sindelar C. V., Major J., Rosenfeld S. S., Moores C. A. (2012) The structural basis of force generation by the mitotic motor kinesin-5. J. Biol. Chem. 287, 44654–44666 [DOI] [PMC free article] [PubMed] [Google Scholar]
- 15. Cochran J. C., Sindelar C. V., Mulko N. K., Collins K. A., Kong S. E., Hawley R. S., Kull F. J. (2009) ATPase cycle of the nonmotile kinesin NOD allows microtubule end tracking and drives chromosome movement. Cell 136, 110–122 [DOI] [PMC free article] [PubMed] [Google Scholar]
- 16. Muretta J. M., Kyrychenko A., Ladokhin A. S., Kast D. J., Gillispie G. D., Thomas D. D. (2010) High-performance time-resolved fluorescence by direct waveform recording. Rev. Sci. Instrum. 81, 103101–103108 [DOI] [PMC free article] [PubMed] [Google Scholar]
- 17. Nesmelov Y. E., Agafonov R. V., Negrashov I. V., Blakely S. E., Titus M. A., Thomas D. D. (2011) Structural kinetics of myosin by transient time-resolved FRET. Proc. Natl. Acad. Sci. U.S.A. 108, 1891–1896 [DOI] [PMC free article] [PubMed] [Google Scholar]
- 18. Lakowicz J. R. (2006) Principles of Fluorescent Spectroscopy, 3rd Ed., p. 134, Springer, New York [Google Scholar]
- 19. Beechem J. M. (1992) Global analysis of biochemical and biophysical data. Methods Enzymol. 210, 37–54 [DOI] [PubMed] [Google Scholar]
- 20. Cochran J. C., Sontag C. A., Maliga Z., Kapoor T. M., Correia J. J., Gilbert S. P. (2004) Mechanistic analysis of the mitotic kinesin Eg5. J. Biol. Chem. 279, 38861–38870 [DOI] [PMC free article] [PubMed] [Google Scholar]
- 21. Kinosita K., Jr., Ikegami A., Kawato S. (1982) On the wobbling-in-cone analysis of fluorescence anisotropy decay. Biophys. J. 37, 461–464 [DOI] [PMC free article] [PubMed] [Google Scholar]
- 22. Cochran J. C., Gilbert S. P. (2005) ATPase mechanism of Eg5 in the absence of microtubules. Insight into microtubule activation and allosteric inhibition by monastrol. Biochemistry 44, 16633–16648 [DOI] [PMC free article] [PubMed] [Google Scholar]
- 23. Maliga Z., Mitchison T. J. (2006) Small-molecule and mutational analysis of allosteric Eg5 inhibition by monastrol. BMC Chem. Biol. 6, 2. [DOI] [PMC free article] [PubMed] [Google Scholar]
- 24. Kosower N. S., Kosower E. M. (1987) Thiol labeling with bromobimanes. Methods Enzymol. 143, 76–84 [DOI] [PubMed] [Google Scholar]
- 25. Sindelar C. V., Downing K. H. (2010) An atomic-level mechanism for activation of the kinesin molecular motors. Proc. Natl. Acad. Sci. U.S.A. 107, 4111–4116 [DOI] [PMC free article] [PubMed] [Google Scholar]
- 26. Muretta J. M., Petersen K. J., Thomas D. D. (2013) Direct real-time detection of the actin- activated power stroke within the myosin catalytic domain. Proc. Natl. Acad. Sci. U.S.A. 110, 7211–7216 [DOI] [PMC free article] [PubMed] [Google Scholar]
- 27. Pettersen E. F., Goddard T. D., Huang C. C., Couch G. S., Greenblatt D. M., Meng E. C., Ferrin T. E. (2004) UCSF Chimera. A visualization system for exploratory research and analysis. J. Comput. Chem. 25, 1605–1612 [DOI] [PubMed] [Google Scholar]