

Abstract
Objective
To evaluate the correlation between chronological and biological age by comparing the normograms of AFC, AMH, and FSH.
Design
Retrospective study
Setting
Data were taken from patients who visited the Infertility Clinic at Dr. Cipto Mangunkusumo General Hospital Jakarta, Indonesia, between January 2008 and December 2010.
Patient(s)
Infertile women who visited the Infertility Clinic.
Intervention(s)
None.
Main Outcome Measure(s)
Normogram of AFC (n = 366), AMH (n = 1616) and FSH (n = 415).
Result(s)
The correlations among AFC, AMH, FSH, and age are statistically significant. Normograms of AFC and AMH with 3rd, 10th, 25th, 50th, 75th, 90th, and 97th percentiles showed a decrease in age where FSH increased. A cut-off value of AFC, AMH, and FSH for poor responders was plotted at the 50th percentile of each normogram. Serum AMH and AFC started to decline in women between 34 and 35 years old. We found a relatively lower slope increase of FSH in older patients compared to that of AFC and AMH. FSH was observed to be a later predictor of biological age than AMH and AFC.
Conclusion(s)
AMH predicted biological age earlier than FSH or AFC. Normograms can provide a reference guide for physicians to counsel infertile women. However, future validation with longitudinal data is still needed.
Keywords: Normogram, Anti-Mullerian hormone, Antral follicle count, FSH
Introduction
As women age, their ability to produce oocytes of good quality and quantity is going to decrease. This decreased ability has been related to chronological or biological age, which represents the ovarian reserve and its response to ovarian stimulation [1]. In the last three decades, the mean age of women delivering their first child has increased by up to 5 years [2] as a result of delayed marriage, delayed contraception, and an increased availability of assisted reproductive technology (ART) [3]. Previous studies have shown that at approximately 30 years, female fertility is reduced and that it decreases more slowly between the ages of 30 and 35 years, finally followed by rapid decrease [4]. The combination of delaying pregnancy and the age-related decrease in fertility has caused an increase in the proportion of women over 35 years old who undergo ART procedures [5].
Unfortunately, advancing age negatively influences the outcome of ART; thus, optimization of and counseling regarding the procedure’s outcome chances are highly important [6]. Chronological age is the age determined by passage of time since birth; however, biological age is determined by physiology rather than chronology. Although the chronological age is a very important predictive factor for fertility and ovarian response, it was found that reproductive aging varied among individuals [1]. Chronological and biological aging may differ significantly, since both genetics and the environment contribute to biological age [1]. Reproductive functions are more influenced by biological than chronological age; the ovarian reserve seems to be a good marker for the biological age of the ovary.
Many studies evaluating ovarian aging attempt to assess the ovarian reserve and its response to stimulation [7, 8]. Biological markers such as the serum level of Anti-Mullerian Hormone (AMH), inhibin B, estradiol, and FSH have been assessed, and many studies have compared their effectiveness with clinical implications to predict the ovarian reserve [9–12]. Antral Follicle Count (AFC), measured by transvaginal ultrasound, and AMH were found to have good predictive values in determining the ovarian reserve [7, 8, 13] and are superior to FSH in earlier predicting the ovarian reserve.
Knowing the ovarian biological age of a woman and the subsequent diminishing pattern is highly important in the field of ART, representing the basic principle of choosing the procedure suitable for each woman. Several studies have aimed to describe the relationship between the chronological age and ovarian biological age by a value predicting the ovarian reserve, such as AFC [14] and AMH serum levels [15, 16]. The objective of this study is to evaluate the correlation between chronological age and ovarian biological age using a normogram of AFC, AMH, and FSH.
Materials and methods
This is a retrospective study in which all data on AFC, FSH and AMH were taken from the medical records of patients who underwent IVF at Yasmin IVF Clinic at Dr. Cipto Mangunkusumo General Hospital from January 2008 to December 2010. The study population included Indonesian women aged 18–50 years old who went through AMH and FSH level tests, as well as women aged 18–50 years old who underwent AFC examination as part of in vitro fertilization procedures. Patients with a history of chemotherapy or radiation were excluded. The same physician using an Aloka type SSD-3500 on day 2 or 3 following menstruation performed a transvaginal ultrasound. Serum FSH was measured using an Immulite 1000 FSH (Siemens Medical Solutions, UK) on day 2 or 3 following menstruation. AMH levels were measured on any other day during the menstrual cycle using an AMH Gen II ELISA (Beckman/Coulter, USA).
All data were analyzed using SPSS 11 (SPSS Inc, Chicago, IL) to determine the correlations among AFC, AMH, FSH, and the patients’ ages with the Pearson correlation test and linear regression analysis. A graph based on the percentile age for each variable using LMS (The Institute of Child Health, London, UK) was then developed. This method has commonly been used to produce percentile data in studies with large populations and have gone through quality control [17]. Seven empirical percentiles, including the 3rd, 10th, 25th, 50th, 75th, 90th, 97th percentiles, and normogram tables were then developed.
Result and discussion
The subject number, age and data distribution of each variable are shown in Fig. 1. Before the correlations between AFC, AMH and FSH with age are tested, the normality of data distribution is confirmed through Kolmogorov-Smirnov normality test, shown in Table 1. The correlations between AFC, AMH, and FSH and age are statistically significant.
Fig. 1.
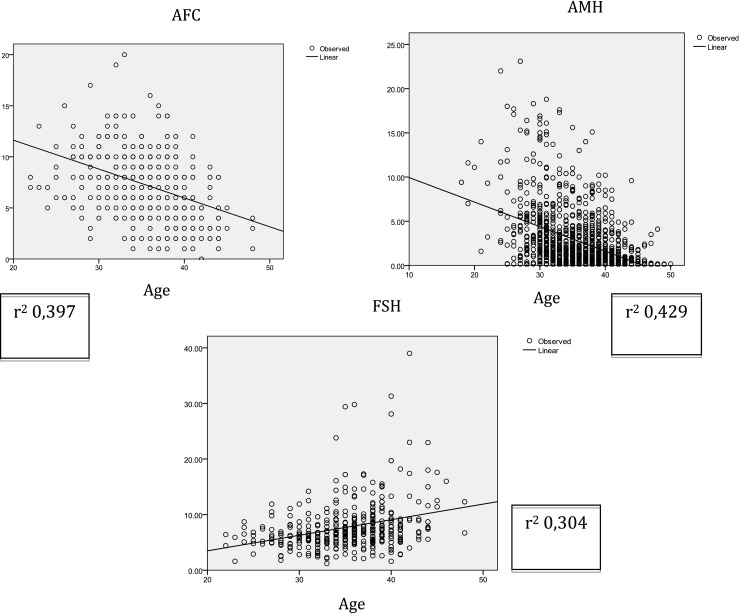
Linear regression correlation curves between AFC, AMH, and FSH and age
Table 1.
Normality tests for AFC, AMH and FSH with age
| Age | AFC | ||
| N | 399 | 399 | |
| Normal parametera,,b | Mean | 35.18 | 7.44 |
| Std. Deviation | 4.765 | 3.447 | |
| Extreme variance | Absolute | .064 | .084 |
| Positive | .043 | .084 | |
| Negative | −.064 | −.071 | |
| Kolmogorov-Smirnov Z | 1.271 | 1.681 | |
| Asymp. Sig. (2-tailed) | .079 | .007 | |
| a. Data distribution test result: Normal. | |||
| b. Calculated from data | |||
| Age | AMH | ||
| N | 1616 | 1616 | |
| Normal parametera,,b | Mean | 36.06 | 2.6996 |
| Std. Deviation | 5.274 | 3.39615 | |
| Extreme variance | Absolute | .066 | .220 |
| Positive | .052 | .182 | |
| Negative | −.066 | −.220 | |
| Kolmogorov-Smirnov Z | 2.657 | 8.850 | |
| Asymp. Sig. (2-tailed) | .000 | .000 | |
| a. Data distribution test result: Normal. | |||
| b. Calculated from data | |||
| Age | FSH | ||
| N | 415 | 415 | |
| Normal parametera,,b | Mean | 35.2675 | 7.7573 |
| Std. Deviation | 4.77951 | 4.40821 | |
| Extreme variance | Absolute | .073 | .168 |
| Positive | .041 | .168 | |
| Negative | −.073 | −.112 | |
| Kolmogorov-Smirnov Z | 1.478 | 3.431 | |
| Asymp. Sig. (2-tailed) | .025 | .000 | |
| a. Data distribution test result: Normal. | |||
| b. Calculated from data | |||
The antral follicle count and serum AMH decreased with increasing age, whereas serum FSH actually increased with advancing age. These results are consistent with previous studies that showed AMH to have a similar sloping pattern compared to advancing age [18]. On the other hand [13], FSH had a negative correlation with age, compared to AFC and AMH. The relatively lower slopes of increasing FSH in older age have made FSH a late predictor of ovarian reserves.
Figure 2a shows a linear biphasic correlation between AFC and age. The graph shows a relatively flat AFC loss at younger ages, followed by a faster decrease in the number of follicles after a certain age, which is called a “switching age”. It was found that the decreasing pattern is quite similar for all percentiles, with 33 years old considered the switching age. These findings are slightly different from the results of a study with 1.866 samples by Almog et al. [14]. Their study found a similar linear biphasic correlation; however, each percentile had a different switching age, as in the lower percentile groups the acceleration of AFC loss started at a younger age. Faddy et al. [19] found a bi-exponential decrease of AFC at the 4th decade of a woman’s life, representing an accelerated follicle loss. These differences show that the mechanism of follicle loss has not yet been well described. Many genetic and environmental factors that influence follicle loss have also not yet been identified. Wiweko et al. [20] studied the female Indonesian population and found that 8 antral follicles is the cut-off value for determining a poor responder.
Fig. 2.

Correlation between the 3rd, 10th, 25th, 50th, 75th, 90th, and 97th percentiles of AFC (a), serum AMH (b) and serum FSH (c) related to age
Figure 2b illustrates the linear correlation of serum AMH levels with age. It was generally found that serum AMH levels decreased in a linear fashion, although there was a slight different result in the 90th and 97th percentiles, where an increase in serum AMH among 22- to 24-year-old women was noted on both percentiles [9, 13, 15, 16]. This difference might be caused by a few of the subjects of this particular age being PCOS patients and thus might not represent the general population. Our previous study showed that serum AMH has a cut-off value of 1.4 ng/ml for predicting poor responders. A study by Nelson et al. (2011) with 9.601 infertile women showed that serum AMH will decrease with age [16] and found that serum AMH in all percentiles were lower compared to our study. This difference might be caused by several factors, including different populations with different genetic and environmental backgrounds, which could lead to a different ovarian biological age compared to chronological age [1]. Seiffer et al. (2011) also studied serum AMH related to women’s ages with a total sample of 17.120 women who came to an infertility center in the United States [15]. The mean of age was similar to that in the current study, although the median was lower than our value. Both of the studies above did not correlate serum AMH, AFC and FSH as markers of ovarian reserves.
The correlation between serum FSH and age (Fig. 2c) showed that serum FSH levels increase with age. The linear curve for each FSH percentile showed a minimal increase, supporting the hypothesis that a decreased fertility evaluated by FSH would appear later than the other two markers. Many studies that compared serum FSH levels with other parameters, such as AMH, inhibin B and antral follicle counts, reported results similar to our results [7, 8, 12]. Our previous study showed that the cut-off value for FSH to predict poor responders was 7, 06 mIU/mL [20].
Based on all of the three graphs shown above, there were biphasic curve changes of AFC, whereas serum AMH and FSH changed in a linear pattern. It was predicted that a decrease in female fertility occurs in a biphasic fashion, but now it is believed that the decreasing fertility could follow a linear pattern [1]. In another study, Rosen et al. found the only markers that follow the pattern of oocyte loss observed histologically were AFC and AMH [21]. However there are no study mentioned about switching age of declining fertility which is actually very important for counseling of patients before treatment.
For this kind of purposes we define biological aging as the ovarian follicular capacity in producing oocytes. Knowing that poor ovarian response is an early sign of ovarian aging, we used cut-off values for AFC, AMH and FSH for poor responder developed from our previous study to correlate with our normogram [20]. We plotted each cut-off value of AFC, AMH and FSH within the 50th percentile of the normogram in order to determine the switching age of declining fertility. This result is shown in Table 2.
Table 2.
Cut-off value for AFC, AMH and FSH determined biological age
| Percentile | AFC (yr) | AMH (yr) | FSH (yr) |
|---|---|---|---|
| 3 | NA | NA | NA |
| 10 | NA | 19 | 22 |
| 25 | NA | 23 | 34 |
| 50 | 34 | 35 | 43 |
| 75 | 40 | 41 | 48 |
| 90 | 43 | 46 | NA |
| 97 | 46 | NA | NA |
NA (not applicable): cannot be evaluated
Table 2 shows that for each percentile, AMH predicts ovarian aging earlier than FSH. This result is consistent with a study by Gleicher et al. that reported women with normal AMH and FSH produced high number of oocytes, whereas women with normal FSH but decreasing AMH produced a significantly lower number of oocytes [22]. This also indicates that AMH serum levels are more important predictors of ovarian aging than FSH levels. This is similar with previous studies by Barad et al. that shows that AMH levels are better predictors of response to ovarian stimulation and clinical pregnancy than baseline FSH levels [23].
The limitation of our study is that we did not calculate the correlation of ovarian aging and the rate of successful IVF or IUI treatment and live birth. Therefore, we don’t have any evidence that having a high percentile of AFC or AMH is predictive of higher likelihood to have a successful IVF or IUI treatment, nor can the probability of having a natural conception be based on the percentile. Based on these facts, clinicians cannot infer live birth rates from the normograms as presented in this study.
In conclusion, the current study reveals that AFC and serum AMH decrease with age, whereas FSH levels increase. The AFC curve changed in a biphasic fashion, while AMH and FSH changed linearly. The change in serum AMH occurs earlier than in AFC or serum FSH; therefore, serum AMH is an earlier predictor for biological age. The normogram produced in this study could be used for counseling women to identify their biological age. The clinical significance of this study is that the clinicians could estimate the possibility of better response to ovarian stimulation among different patients.
Acknowledgments
The authors would like to thank Eliza Mansyur, Tita Yuningsih, Dr. M. Dwi Priangga, Dr. Nadia Shafira, Dr. Valencia Yuwono, and all of the clinicians and staff of the Division of Reproductive Endocrinology and Infertility, Department of Obstetrics and Gynecology, Faculty of Medicine Universitas Indonesia.
Commercial product mentioned in title
None
Financial support Supported by
None
Footnotes
Capsule
AMH was found to be an earlier predictor for biological age than FSH. Normograms could provide a reference guide for physicians to counsel infertile women.
References
- 1.Alviggi C, Humaidan P, Howles CM, Tredway D, Hillier SG. Biological versus chronological ovarian age: implications for assisted reproductive technology. J Reprod Biol Endocrinol. 2009;7:101–13. doi: 10.1186/1477-7827-7-101. [DOI] [PMC free article] [PubMed] [Google Scholar]
- 2.te Velde ER, Pearson PL. The variability of female reproductive ageing. Hum Reprod Update. 2002;8:141–54. doi: 10.1093/humupd/8.2.141. [DOI] [PubMed] [Google Scholar]
- 3.Steptoe PC, Edwards RG. Birth after the reimplantation of a human embryo. Lancet. 1978;2:366. doi: 10.1016/S0140-6736(78)92957-4. [DOI] [PubMed] [Google Scholar]
- 4.ESHRE Capri Workshop Group Fertility and ageing. Hum Reprod Update. 2005;11:261–76. doi: 10.1093/humupd/dmi006. [DOI] [PubMed] [Google Scholar]
- 5.A long term analysis of the HFEA Register data 1991–2006. Available from: URL: http://www.hfea.gov.uk/en/1540.html
- 6.Howles CM, Kim CH, Elder K. Treatment strategies in assisted reproduction for women of advanced maternal age. Int Surg. 2006;91:S37–54. [PubMed] [Google Scholar]
- 7.Broekmans FJ, Soules MR, Fauser BC. Ovarian aging: mechanism and clinical consequences. Endocr Rev. 2009;30(5):465–93. doi: 10.1210/er.2009-0006. [DOI] [PubMed] [Google Scholar]
- 8.De Carvalho BR, de Sa Rosa e Silva A, Silva JC, dos Reis RM, Ferriani RA, de Sa MF. Ovarian reserve evaluation, state of the art. J Assisst Reprod Genet. 2008;25:311–22. doi: 10.1007/s10815-008-9241-2. [DOI] [PMC free article] [PubMed] [Google Scholar]
- 9.Visser JA, de Jong FH, Laven JSE, Themmen APN. Anti Mullerian Hormone: a new marker for ovarian function. Soc Reprod Fertil. 2006;131:1–9. doi: 10.1530/rep.1.00529. [DOI] [PubMed] [Google Scholar]
- 10.La Marca, Broekmans FJ, Volpe A, Fauser BC, Macklon NS. Anti Mullerian Hormone; what do we still need to know ? Human Reprod. 2009;24(9):2264–75. doi: 10.1093/humrep/dep210. [DOI] [PubMed] [Google Scholar]
- 11.Sowers MR, Eyvazzadeh AD, McConnell D, Yosef M, Jannausch ML, et al. Anti Mullerian Hormone and Inhibin B in the definition of ovarian aging and the menopause transition. J Clin Endocrinol Metab. 2008;93(9):3478–83. doi: 10.1210/jc.2008-0567. [DOI] [PMC free article] [PubMed] [Google Scholar]
- 12.Soto N, Iniguez G, Lopez P, Larenas G, Mujica V, Rey RA, et al. Anti Mullerian Hormone and inhibin B levels as markers of premature ovarian aging and transition to menopause in type I diabetes mellitus. Human Reprod. 2009;24(11):2838–44. doi: 10.1093/humrep/dep276. [DOI] [PubMed] [Google Scholar]
- 13.Knauff EAH, Eijkmans MJC, Lambalk CB, Kate-Booij MJ, Hoek A, et al. Anti Mullerian Hormone, Inhibin B, and Antral Follicle Count in young woman with ovarian failure. J Clin Endocrinol Metab. 2009;94(3):786–92. doi: 10.1210/jc.2008-1818. [DOI] [PubMed] [Google Scholar]
- 14.Almog B, Shehata MB, Shalom-Paz E, Tan SL, Tulandi T. Age related normogram for antral follicle count: McGill reference guide. Fertil Steril. 2011;95(2):663–6. doi: 10.1016/j.fertnstert.2010.08.047. [DOI] [PubMed] [Google Scholar]
- 15.Seifer DB, Baker VL, Leader B. Age specific Anti Mullerian Hormone values for 17.120 women presenting to fertility centers within the United States. Fertil Steril. 2011;95(2):747–50. doi: 10.1016/j.fertnstert.2010.10.011. [DOI] [PubMed] [Google Scholar]
- 16.Nelson SM, Messow MC, Wallace M, Fleming R, McConnachie A. Nomogram for the decline in serum anti mullerian hormone: a population study of 9.601 infertility patients. Fertil Steril. 2011;95(2):736–41. doi: 10.1016/j.fertnstert.2010.08.022. [DOI] [PubMed] [Google Scholar]
- 17.Cole TJ, Green PJ. Smoothing reference centile curves: the LMS method and penalized likelihood. Stat Med. 1992;11:1305–19. doi: 10.1002/sim.4780111005. [DOI] [PubMed] [Google Scholar]
- 18.Fanchin R, Taieb J, Lozano DH, Ducot B, Frydman R, Bouyer J. High reproducibility of serum anti mullerian hormone measurements suggests a multi-staged follicular secretion and strengthens its role in the assessment of ovarian follicular status. Hum Reprod. 2005;20(4):923–7. doi: 10.1093/humrep/deh688. [DOI] [PubMed] [Google Scholar]
- 19.Faddy MJ, Gosden RGM, Gourgeon A, Richardson SJ, Nelson JF. Accelerated disappearance of ovarian follicles inmid-life: implications for forecasting menopause. Hum Reprod. 1992;7:1342–6. doi: 10.1093/oxfordjournals.humrep.a137570. [DOI] [PubMed] [Google Scholar]
- 20.Wiweko B, Hestiantoro A, Sumapraja K, Natadisastra M, Febia E, et al. Anti Mullerian hormone serum level indicates ovarian response in controlled ovarian hyperstimulation of IVF cycles. Indones J Obstet Gynecol. 2010;34(3):114–8. [Google Scholar]
- 21.Rosen MP, Johnstone E, McCulloch CE, Schuh-Huerta SM, Sternfeld B, Reijo-Pera RA, et al. A characterization of the relationship of ovarian reserve markers with age. Fertil Steril. 2012;97(1):238–43. doi: 10.1016/j.fertnstert.2011.10.031. [DOI] [PMC free article] [PubMed] [Google Scholar]
- 22.Gleicher N, Weghofer A, Barad DH. Discordance between follicle stimulating hormone (FSH) an anti mullerian hormone (AMH) in female infertility. Reprod Biol Endocrinol. 2010;8(64):1–7. doi: 10.1186/1477-7827-8-64. [DOI] [PMC free article] [PubMed] [Google Scholar]
- 23.Barad DH, Weghofer A, Gleicher N. Comparing anti-Mullerian hormone (AMH) and follicle-stimulating hormone (FSH) as predictors of ovarian function. Fertil Steril. 2010;91(4):1553–5. doi: 10.1016/j.fertnstert.2008.09.069. [DOI] [PubMed] [Google Scholar]