

Abstract
Background: Non-alcoholic fatty liver disease (NAFLD), including non-alcoholic steatohepatitis (NASH), appears to be increasingly common worldwide. Its histopathology and the effects of nutrition on liver function have not been fully determined. Aim: To elucidate the cellular mechanisms of NAFLD induced by a methionine-choline-deficient (MCD) diet in mice. Particular focus was placed on the role of phagocytic cells. Methods: Male C57BL/6 mice were fed an MCD diet for 30 weeks. A recovery model was also established wherein a normal control diet was provided for 2 weeks after a period of 8, 16, or 30 weeks. Results: Mice fed the MCD diet for ≥2 weeks exhibited severe steatohepatitis with elevated serum aspartate aminotransferase (AST) and alanine aminotransferase (ALT) levels. Steatohepatitis was accompanied by the infiltration of CD68-positive macrophages (Kupffer cells). The severity of steatohepatitis increased in the first 16 weeks but was seen to lessen by week 30. Fibrosis began to develop at 10 weeks and continued thereafter. Steatohepatitis and elevated serum hepatic enzyme concentrations returned to normal levels after switching the diet back to the control within the first 16 weeks, but fibrosis and CD68-positive macrophages remained. Conclusions: The histopathological changes and irreversible fibrosis seen in this model were caused by prolonged feeding of an MCD diet. These results were accompanied by changes in the activity of CD68-positive cells with temporary elevation of CCL-2, MMP-13, and MMP-9 levels, all of which may trigger early steatohepatitis and late fibrosis through phagocytosis-associated MMP induction.
Keywords: CD68 antigen, Kupffer cells, liver fibrosis, matrix metalloproteinase (MMP), mouse, non-alcoholic fatty liver disease (NAFLD)
Introduction
Non-alcoholic fatty liver disease (NAFLD) is a recently defined form of metabolic liver damage that is found in patients who regularly consume alcohol, but in lower quantities than those at risk of liver injury due to excessive alcohol intake [1]. Pathological changes in the liver are characterized predominantly by macrovesicular steatosis, a symptom commonly associated with alcoholic liver diseases. In Western countries 20-40% of adults may have NAFLD. Fatty liver disease used to be considered benign, but 30-40% of NAFLD patients also develop non-alcoholic steatohepatitis (NASH) and approximately 5-8% develop cirrhosis after 5 years [2]. Generally, NAFLD is associated with a 15-20% risk of progression to cirrhosis, which may further develop into hepatocellular carcinoma [1].
The major risk factor leading to NAFLD is overnutrition. Conversion to a healthy diet is important in the treatment of early stage NAFLD. Therefore, it is necessary to diagnose NAFLD as soon as possible. Hepatic fibrosis is an early characteristic of the progression of NAFLD to cirrhosis. It was previously considered irreversible, but recent studies suggest that improvement can occur through early treatment and diet modification [3].
When hepatic diseases progress to cirrhosis, multiple non-parenchymal cells are activated and begin to interact. Previous reports have shown that Kupffer cell activation contributes to the pathogenesis of NAFLD [4-6]. Administration of a methionine-choline-deficient (MCD) diet to mice induces a rapid, persistent, and severe state of steatohepatitis [3,7]. However, the cellular and molecular mechanisms of the ensuing liver damage are unknown. Similarly, it is unclear whether the pathological changes associated with NAFLD are at all reversible.
In the present study, an NAFLD model comprising C57BL/6 mice that were fed an MCD diet was employed. The long-term effect of this diet was investigated, focusing particularly on liver function, histopathology, and the role of Kupffer cells. During the course of the MCD diet, a recovery model was also established by switching mice to a normal control diet, to determine whether the effects could be reversed by a change in eating habits. It was found that CD68-positive Kupffer cells may play key roles in the irreversible changes of NAFLD at relatively late disease stages.
Materials and methods
Animals and experimental design
Nine-week-old pathogen-free male C57BL/6 mice were purchased from SLC Japan (Shizuoka, Japan). The mice were maintained in air-filtered clean rooms and fed either a control diet or an MCD diet purchased from the Oriental Yeast Co., Ltd. (Tokyo, Japan). The procedures employed for the handling and care of the animals were approved by the Animal Experiment Committee, Tokyo Women’s Medical University, and conformed to the national guidelines for animal usage in research. Mice were fed the MCD diet (group M) for 2, 4, 8, 16, or 30 weeks (n=5 mice per subgroup). A diet recovery model (group R) was established by switching the group M mice to the control diet for 2 weeks after administration of the MCD diet for 8, 16, or 30 weeks (n=5 mice per subgroup). During the experiment, body weight was measured three times weekly.
General tissue preparation
Mice were anesthetized by intramuscular injection of ketamine (87 mg/kg) and xylazine (13 mg/kg). The thorax was opened and the aorta was perfused from the left ventricle with 4% paraformaldehyde (PFA) in phosphate-buffered saline (PBS, pH 7.4) for 10 min at 120 mmHg. Blood and fixative were drained by incising the right atrium. After perfusion, the liver was removed, weighed, and cut into small pieces. Prior to cryosectioning, tissue samples were postfixed in 4% PFA for 2 h, rinsed in PBS for 1 h, and finally immersed in PBS containing a graded series of sucrose concentrations (≤30%). Some were embedded in Tissue Tek O.C.T. compound (Sakura Finetek, Torrance, CA) and snap-frozen in liquid nitrogen. The remaining samples were post-fixed in 4% PFA overnight. The following day they were rinsed under running tap water for 1 h, dehydrated in a series of ethanol solutions (70, 80, 90, 95, and 100%) for 45 min per solution and cleared twice in xylene for 45 min. Finally, all tissue samples were embedded in paraffin for sectioning.
Biochemical analyses of blood samples
After anesthetizing the animals, but prior to sacrificing, blood was collected from the left ventricle and allowed to coagulate overnight at 4°C. Serum samples were collected and centrifuged at 6000 rpm for 10 min to remove blood cells. Serum levels of aspartate aminotransferase (AST) and alanine aminotransferase (ALT) were then measured using a SPOTCHEM SP-4420 biochemistry analyzer (Arkray, Inc., Kyoto, Japan).
Histology
For ordinary hematoxylin and eosin (H&E) staining and Azan staining, 3-μm paraffin sections were made and de-paraffinized in xylene with three changes of 10 min each. Sections were then dehydrated in a descending series of ethanol/PBS concentrations for 5 min per solution, and rinsed in PBS for an additional 10 min. For other histological analyses, 14-μm cryosections were prepared. Some cryosections were stained with Oil Red O to evaluate hepatic fat deposits [8].
Immunohistochemistry
To minimize non-specific background staining, 14-μm-thick cryosections were rehydrated in PBS and treated for 20 min at room temperature (RT) with a 1% blocking solution (Block Ace; Dainippon Sumitomo Seiyaku, Tokyo, Japan). The samples were first incubated overnight at 4°C with either anti-CD68 (Macrosialin; rat monoclonal antibody, 1:100 dilution; AbD Serotec, Oxford, UK) or anti-proliferating cell nuclear antigen (PCNA; rabbit polyclonal antibody, 1:100 dilution; Abcam PLC., Cambridge UK). The ideal concentrations of these primary antibodies were determined in advance. The antibodies were diluted in PBS containing 1% bovine serum albumin (BSA; Jackson Immuno-Research Laboratories Inc., West Grove, PA, USA). After several washes in PBS, sections were incubated for 1 h at RT with biotin-SP-conjugated goat anti-rat immunoglobulin G (IgG) or goat anti-rabbit IgG (dilution, 1:200; Jackson ImmunoResearch Laboratories Inc.). The sections were rinsed in PBS several times and then incubated for 1 h at RT in streptavidin-conjugated horseradish peroxidase (HRP; dilution, 1:200; Jackson ImmunoResearch Laboratories, Inc.). The HRP reaction was then developed at RT for 5-10 min in a solution containing 10 mg 3,3’-diaminobenzidine tetrahydrochloride (Dojindo Laboratories, Kumamoto, Japan) and 10 μl of 30% H2O2 in 50 ml PBS. Sections were then rinsed with distilled water to stop the reaction. Next they were fixed for 10 min at RT with 1% glutaraldehyde in PBS, rinsed once more with distilled water, and counterstained with 1% hematoxylin. All stained sections were observed under an Olympus BX-51 light microscope (Olympus, Tokyo, Japan) and the resulting images were processed using Photoshop software (Adobe, Mountain View, CA, USA).
Ultrastructural analyses of semi-thin sections
After perfusion with 4% PFA in PBS, livers were removed and cut into small blocks. These blocks were post-fixed in 2.5% glutaraldehyde for a minimum of 2 h at RT, treated with 1% OsO4, dehydrated in an ascending series of ethanol/propylene oxide concentrations, and then embedded in epoxy resin. Sections 500 μm in thickness were then prepared and stained with toluidine blue.
Immunohistological staining and preparation of semi-thin sections for CD68-positive cells
Cryosections of 14-μm thickness were immunohistochemically stained as described above. After HRP staining, the sections were fixed in 2.5% glutaraldehyde at RT for 10 min, followed by 1% osmium tetroxide for 1 h, and then dehydrated in an ascending series of ethanol concentrations. These sections were next embedded in a gelatin capsule containing epoxy resin and incubated for 48 h at 64°C. Following this incubation step, the embedded sections were then further separated into additional 1-μm-thick samples, stained with toluidine blue, and observed under an Olympus BX-51 light microscope.
Evaluation of the proliferative capacity of liver cells and enumeration of CD68-positive cells
PCNA- and CD68-positive cells were counted in 10 randomly selected fields while viewing each slide at ×200 magnification. The average cell number in each group was calculated.
Histopathological evaluation of hepatic fat deposition and fibrosis
Using a BZ-Analyzer (Keyence, Osaka, Japan), hepatic lesions with fat deposits were stained with Oil Red O and analyzed at a magnification of ×200 in 10 randomly selected fields. The ratio of stained areas to unstained areas per field was estimated in each group and normalized to control liver sections. Hepatic pathology was evaluated according to the NAFLD activity score (NAS; Table 1A) and the NAFLD fibrosis score (Table 1B) [9,10].
Table 1.
Estimation of NAFLD
| A. NAFLD Activity Score (NAS)* | ||
|
| ||
| Pathological appearance | Assessment | Score (NAS) |
|
| ||
| Hepatocyte ballooning | None | 0 |
| Few balloon cells | 1 | |
| Many | 2 | |
| Lobular inflammation: Overall assessment of all inflammatory foci | No foci | 0 |
| <2 foci per 200× field | 1 | |
| 2-4 foci per 200× field | 2 | |
| >4 foci per 200× field | 3 | |
| Steatosis: Low- to medium-power evaluation of parenchymal involvement by steatosis | <5% | 0 |
| 5%-33% | 1 | |
| >33%-66% | 2 | |
| >66% | 3 | |
|
| ||
| Pathological diagnosis | Total score (NAS) | |
|
| ||
| Probable or definite NASH | >5 | |
| Uncertain | 3-4 | |
| Not NASH | <2 | |
|
| ||
| B. NAFLD Fibrosis Score* | ||
|
| ||
| Score | Description | |
|
| ||
| Score 0 | None | |
| Score 1 | Perisinusoidal or periportal | |
| Score 1A | Mild, zone 3, perisinusoidal | |
| Score 1B | Moderate, zone 3, perisinusoidal | |
| Score 1C | Portal/periportal | |
| Score 2 | Perisinusoidal and portal/periportal | |
| Score 3 | Bridging fibrosis | |
| Score 4 | Cirrhosis | |
According to the Nonalcoholic Steatohepatitis Clinical Research Network (Kleiner et al. 2005).
RNA isolation and real-time polymerase chain reaction (PCR)
Total RNA from a 50-mg sample of liver tissue was isolated using Direct-zol RNA MiniPrep (Zymo Research Co., CA., USA) with a TRI-Reagent kit (Zymo Research Co.), and measured using a Biowave II spectrophotometer (Biochrom Ltd., Cambridge, UK). Reverse transcription was performed using the SuperScript® VILOTM cDNA Synthesis Kit (Invitrogen Inc., CA, USA). Total RNA (1 μg) from each sample was used to synthesize cDNA. Gene expression was measured through real-time PCR using the TaqMan® Fast Universal PCR Master Mix (Applied Biosystems, Carlsbad, CA, USA). The specific primer and probe mixtures used were: chemokine CC motif ligand 2 (CCL2; Applied Biosystems, ID Mm00441242-m1), matrix metalloproteinase-9 (MMP-9; Applied Biosystems, ID Mm00442991-m1), and MMP-13 (Applied Biosystems, ID Mm00439491-m1). The endogenous control was beta-actin (Applied Biosystems, ID Mm01298616-m1). Each real-time PCR reaction used a 40-ng aliquot of cDNA from each sample. Real-time PCR was performed using the Step One Plus™ Real Time PCR System for an initial 20 s at 95°C, followed by 40 cycles of denaturation at 95°C for 3 s, and finally annealing and extension at 60°C for 30 s. The delta-delta comparative threshold (ΔΔCT) method was used to quantify fold changes between the samples [11].
Statistical analyses
All data were expressed as means±standard deviations (SD). Statistical analyses were performed using Student’s t-test, wherein P<0.05 was considered significant and P<0.01 was considered highly significant.
Results
Changes in body and liver weight
Compared with mice fed the control diet for identical durations, mice fed the MCD diet (group M) lost >40% of body weight and >60% of liver weight after 30 weeks (Figure 1A). Body weight in those receiving the MCD diet recovered to pre-treatment values 2 weeks after switching to the control diet. In addition, 2 weeks after switching to the control diet in all subgroups, both body and liver weights in group R significantly recovered when compared to those in group M. This indicates that both body and liver weights were nearly restored after 2 weeks of being fed the control diet (Figure 1B and 1C).
Figure 1.
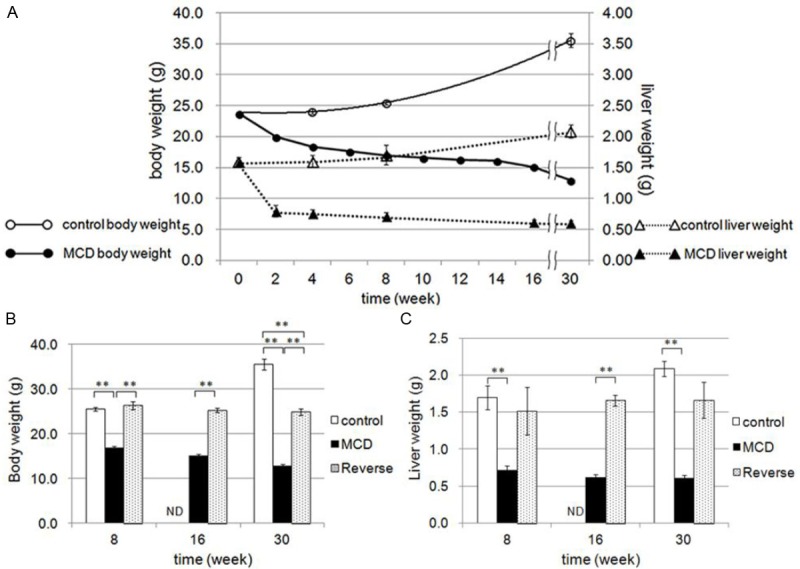
Changes in body weight and liver weight. A: Direct comparison of changes in body weight (circles) and liver weight (triangles) between the control diet (open marks) and MCD diet (closed marks) group mice. Effects of diet reverse at 8, 16, and 30 weeks on body weight (B) and liver weight (C). Control diet (control group: open columns), MCD diet (group M: black column), and reversed diet (group R: gray columns). **P<0.01, ND (not determined).
Functional changes in the liver induced by the MCD diet and diet switching
In group M, serum AST and ALT levels increased progressively from weeks 2 to 16, but decreased significantly by 30 weeks. In contrast, both enzyme levels returned to their normal levels in group R (Figure 2A and 2B).
Figure 2.
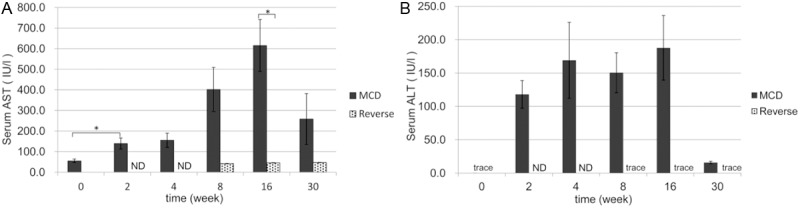
Serum levels of liver-derived enzymes. Serum levels of AST (A) and ALT (B) were measured. Note that the levels of both enzymes in group M (black columns) increased from 2 to 16 weeks, but markedly decreased at 30 weeks. In group R (gray columns) the levels of both enzymes decreased to almost normal. *P<0.05, ND (not determined).
Hepatic histological changes induced by the MCD diet and diet switching
To evaluate structural changes, liver sections were stained with H&E (Figure 3) or Oil Red O (Figure 4A-I). Severe degeneration associated with fatty deposits was observed, accompanied by inflammatory cell infiltration in all liver samples from group M (Figure 3B-F). Steatohepatitis and inflammatory cell infiltration in group M started as early as 2 weeks and became prominent by 16 weeks (Figure 3B-E). Oil Red O staining of the livers in group M revealed fat deposition in hepatocytes after 2 weeks, increasing in concentration until 16 weeks (Figure 4B-E), but decreasing by week 30 (Figure 4F). In group R, the areas of fat deposition decreased significantly (Figure 4G-I) after 2 weeks of switching to a control diet. The increased fat accumulation during the initial 2 to 16 weeks period in group M, and the relative decrease in fat levels in group R, were both highly significant (Figure 4J).
Figure 3.
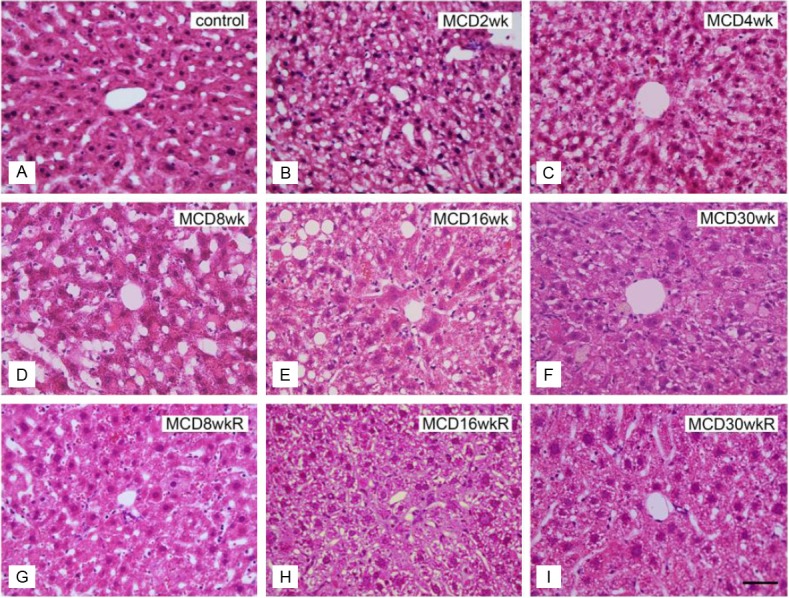
H&E staining of liver sections in groups M and R. A: Normal control liver section. B-F: Liver sections of the MCD diet group (group M) fed for 2 weeks (B), 4 weeks (C), 8 weeks (D), 16 weeks (E), and 30 weeks (F). G-I: Liver sections of the reversed diet group (group R) at 8 weeks (G), 16 weeks (H), and 30 weeks (I). Bar=5 μm in all panels.
Figure 4.
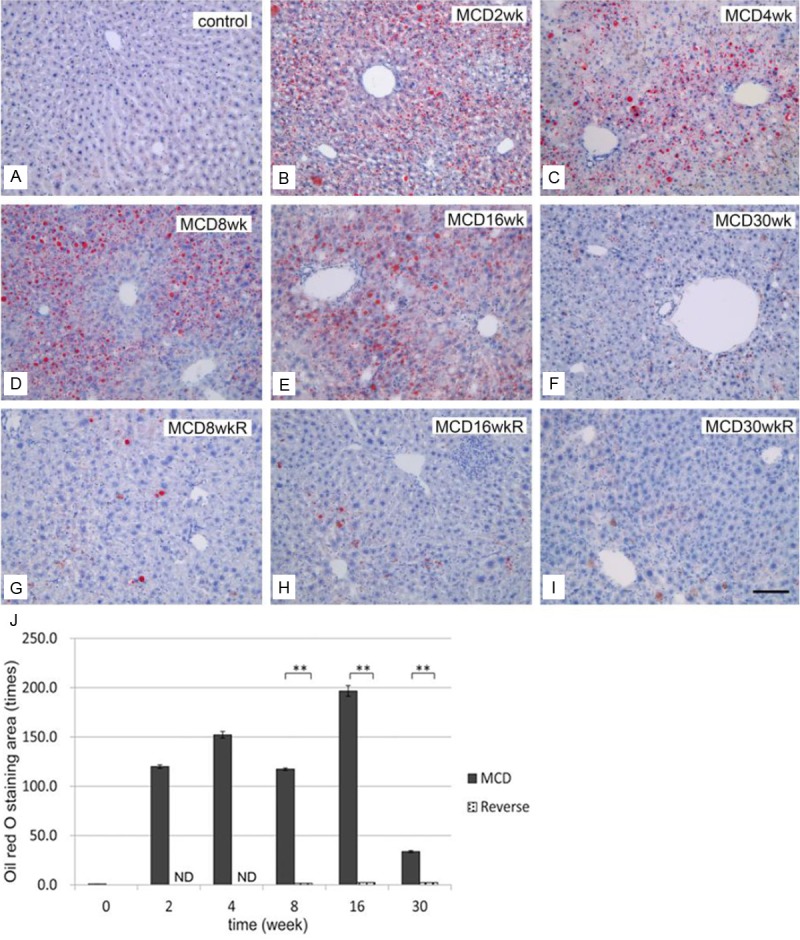
Development of hepatic steatosis by the MCD diet and effect of diet reverse. Oil Red O staining of the liver in controls (A), group M (B: 2 weeks, C: 4 weeks, D: 8 weeks, E: 16 weeks, and F: 30 weeks), and group R (G: 8 weeks, H: 16 weeks, and I: 30 weeks). Note that fat deposits developed from 2 to 16 weeks, but deposit levels were reduced at 30 weeks in group M. In group R (G-I), the fat deposition areas decreased remarkably. Bar=10 μm in all panels. J: Quantification of fat deposition in the liver. Areas of lipid deposition in liver sections were identified by Oil Red O staining and expressed as multiple numbers; the control level was set to 1, as described in the Materials and Methods. Note that the Oil Red O-stained areas increased significantly from 2 weeks in group M, but decreased almost completely in group R. **P<0.01, ND (not determined).
Proliferative capacity of liver cells by PCNA immunostaining
In group M the number of PCNA-positive hepatocytes increased progressively from 2 to 30 weeks. In contrast, the number of PCNA-positive hepatocytes was significantly lower at all stages in group R (Figure 5).
Figure 5.
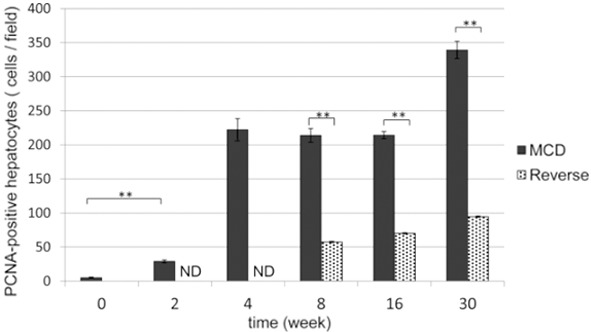
Quantification of PCNA-positive cells in the liver. The average number of PCNA-positive cells was counted in group M (black columns) and group R (gray columns) liver sections. The number of PCNA-positive cells increased significantly from 2 weeks in group M. In group R, they decreased significantly after changing the diet back to control. **P<0.01, ND (not determined).
Histological evaluation of NAS and NAFLD fibrosis score
Mice fed the control diet for 30 weeks showed statistically non-significant levels of fibrosis throughout the course of this study (Figure 6A). In group M the degree of NAS was scored at 7 as early as 2 weeks after initiation of the MCD diet (Figure 7A). The NAS score increased to 8 during weeks 10-16, before decreasing to 6 at 30 weeks, similar to the findings of fat deposition presented in Figure 4F and 4J. In contrast, NAS scores improved to 5 in group R, significantly lower than the group M scores (Figure 7A). In group M, the NAFLD fibrosis score was classified as stage 1 at 10 weeks of receiving the MCD diet (Figure 7B), and was localized mainly in periportal areas. After 16 weeks, the fibrosis level progressed to stage 3 in the portal and bridging areas and remained there after 30 weeks (Figures 6E, 6F and 7B). In contrast, NAFLD fibrosis score reached only stage 2 after 16 weeks in group R (Figure 6H). However, at 30 weeks and after, stage 3 fibrosis was observed in the bridging areas of group R (Figure 6I), with no significant difference when compared to group M scores (Figure 7B). This indicates that the levels of fibrosis at 30 weeks were irreversible.
Figure 6.
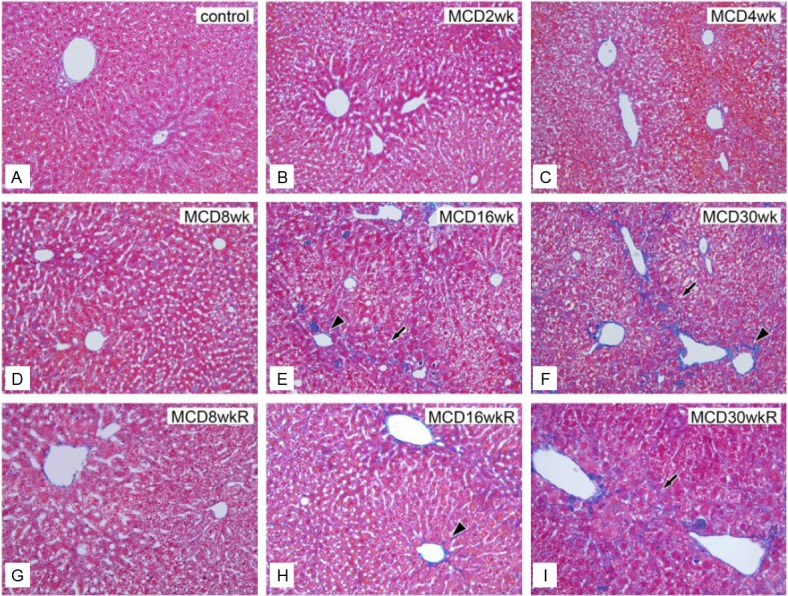
Histological evaluation of hepatic fibrosis by Azan staining. A: Control liver section. Sections of MCD-diet-fed livers from group M after 2 weeks (B), 4 weeks (C), 8 weeks (D), 16 weeks (E), and 30 weeks (F). Liver sections of the reversed diet group R at 8 weeks (G), 16 weeks (H), and 30 weeks (I). Note that fibrosis typically progressed to stage 3 in portal areas and bridging areas after 16 weeks in groups M and R. Bar=10 μm in all panels.
Figure 7.
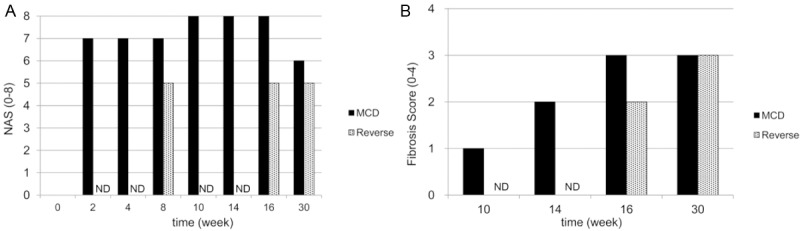
Evaluation of NAS and hepatic fibrosis. A: NAFLD Activity Score (NAS). B: Ten-week fibrosis scores in groups M and R. NAFLD estimation by NAS and fibrosis scores is shown in Table 1. ND (not determined).
Immunohistochemical identification of CD68-positive cells
To investigate the roles of macrophage populations in the pathological changes associated with NAFLD, both immunohistochemical and functional analyses of macrophages were performed.
A significant increase in the number of CD68-positive cells in group M was observed as early as 2 weeks (Figure 8). Furthermore, a small but substantial number of swollen CD68-positive cells were observed in the liver at 16 weeks (Figure 8E and 8F). In group R, the numbers of CD68-positive cells were significantly less than those in group M (Figure 8G-J), but swollen CD68-positive cells remained evident after 16 and 30 weeks (Figure 8H and 8I).
Figure 8.

Immunohistochemical identification of CD68-positive cells in liver sections. A: Normal control liver section. Liver sections in group M at 2 weeks (B), 4 weeks (C), 8 weeks (D), 16 weeks (E), and 30 weeks (F). Liver sections in group R at 8 weeks (G), 16 weeks (H), and 30 weeks (I). CD68-positive cells became swollen at 16 weeks in groups M and R. Bar=10 μm in all panels. J: Quantification of CD68-positive cells in the liver. The number of CD68-positive cells per view field in liver sections was compared between groups M (black columns) and R (gray columns). The number of CD68-positive cells increased significantly in group M from 2 weeks and continued thereafter. **P<0.01, ND (not determined).
Liver ultrastructure in semi-thin sections
After 2 weeks large fat deposits were observed in the hepatocytes recovered from group M (Figure 9B and 9C). After 16 weeks, the sinusoids became indistinct and swollen cells appeared among the hepatocytes (Figure 9D and 9E). Swollen cells were also observed after 16 weeks in group R. CD68 immunostaining in semi-thin sections revealed that the swollen cells were CD68-positive and contained dead cell fragments (Figure 9F). Some became abnormally large due to cell aggregation.
Figure 9.
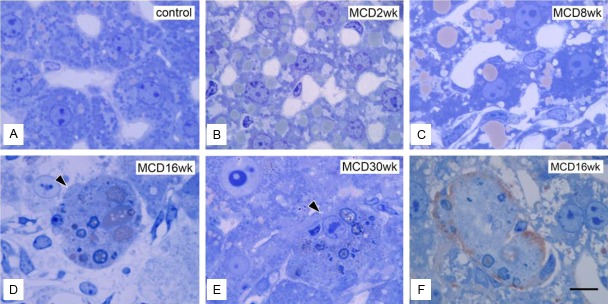
Ultrastructures at the semi-thin section level. A: Normal control liver section. Liver sections in group M at 2 weeks (B), 8 weeks (C), 16 weeks (D), and 30 weeks (E). Swollen cells appeared among hepatocytes from 16 weeks in group M (D and E). F: Immunohistochemical identification of swollen cells with a CD68 marker in semi-thin sections. A liver section in group M at 16 weeks. A typical swollen CD68-positive cell is seen. Bar=1 μm applies to all panels.
Inflammatory activity of hepatic macrophages assessed by real-time PCR
To clarify the functional roles of the CD68-positive cells, the mRNA expression of CCL-2, MMP-13, and MMP-9 were determined as typical functional markers of hepatic macrophages (Figure 10). CCL-2 mRNA and MMP-13 mRNA expression was highest after 8 weeks but decreased significantly thereafter (Figure 10A and 10B). In contrast, MMP-9 mRNA expression was seen to increase at 16 weeks, but returned to almost normal levels by 30 weeks (Figure 10C). In group R, CCL-2 and MMP-13 mRNA expression decreased significantly after 8 weeks, but increased slightly after 16 weeks (Figure 10A and 10B). In contrast, MMP-9 mRNA expression decreased until week 16, but then showed a prominent increase at 30 weeks (Figure 10C).
Figure 10.
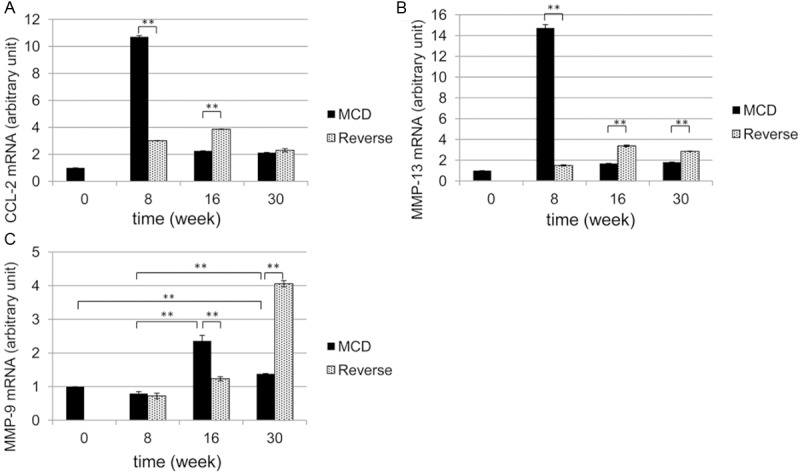
mRNA levels of CCL-2, MMP-13, and MMP-9 by real-time PCR. The mRNA levels of CCL-2 (A), MMP-13 (B), and MMP-9 (C) were determined and evaluated as arbitrary units, whereas those of normal control livers were set to 1. MCD-diet-fed group M (black columns). Reversed-diet-fed group R (gray columns). **P<0.01.
Discussion
The aim of this study was to determine the roles played by macrophages in causing liver damage in NAFLD. This analysis was performed using one of the most common dietary NAFLD animal models-mice fed an MCD diet [7,12]. It is believed that dietary choline deficiency promotes steatohepatitis [13]. Mice fed a diet deficient in both choline and methionine develops hepatic inflammation and fibrosis in addition to simple steatohepatitis. Although our NAFLD model lacks obesity, the major characteristic of human NASH, the observed association between Kupffer cell activation and liver pathology, such as steatohepatitis and fibrosis, mirrors the etiology of NASH in humans [14]. In the present study, the focus was on the general histopathological changes in response to a prolonged MCD diet. The possibility of a reversal effect was also addressed by instituting a relatively brief, 2-week switch to a control diet.
Several major histopathological findings were identified. First, the typical signs of NAFLD started to appear after 2 weeks of feeding the mice the MCD diet. Serum AST and ALT levels increased along with fat deposition from weeks 2 to 16, but these changes were largely reversed (to near pre-treatment baseline) by week 30. Second, hepatic fibrosis was first observed after 10 weeks and lasted for the duration of the experiment. This fibrosis appeared to be irreversible at 16 weeks, even after switching to the control diet. Serum AST and ALT levels did not appear to be significantly associated with the severity of hepatic cirrhosis. This is consistent with reports of studies on humans [15]. At 30 weeks, fibrosis was more prominent than steatohepatitis in mice being fed the MCD diet. Third, the number of PCNA-positive hepatocytes increased significantly after 2 weeks in group M, whereas liver weight showed a marked decrease. Conversely, the number of PCNA-positive hepatocytes was significantly lower in all R subgroups, and the liver weights were almost identical to those of the control group mice. Therefore, the number of PCNA-positive hepatocytes, rather than their active proliferation, may be a more accurate marker of hepatocyte injury [16]. Finally, the number of CD68-positive macrophages in the liver increased as early as 2 weeks, in accordance with the onset of changes in cellular liver composition. Furthermore, swollen and fused phagocytes became prominent after 16 weeks. Therefore, active steatohepatitis progressed at earlier stages (<16 weeks), and then decreased, whereas irreversible fibrosis became prominent at late stages (≥16 weeks). These histopathological changes are summarized chronologically in Figure 11.
Figure 11.
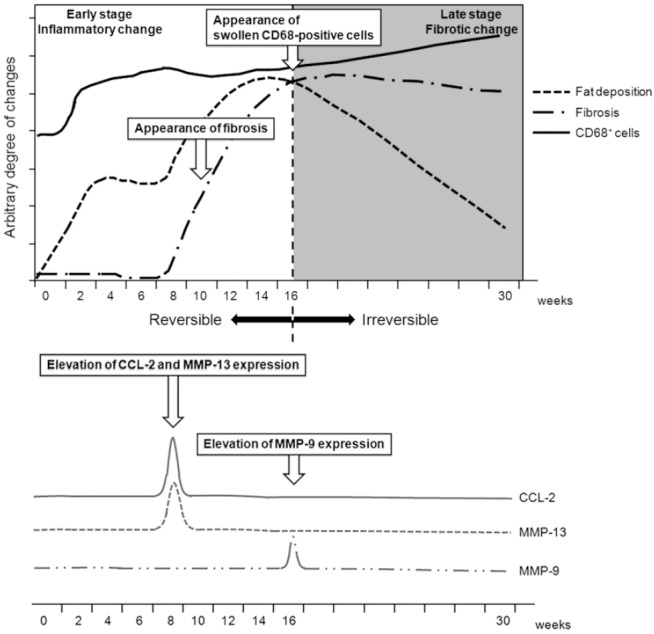
Summary of the histopathological changes in MCD-diet-induced NAFLD.
Regarding the cellular mechanisms responsible for MCD diet-induced NAFLD, our results suggest that CD68-positive Kupffer cells play a key role in the progression and eventual irreversibility of liver damage in this mouse model (Figure 11). Activated Kupffer cells may cause injury to hepatocytes and other cells by releasing a variety of biologically active mediators, including cytokines and chemokines [17]. The CD68 protein is located in lysosomes and can be detected in all Kupffer cells regardless of their location in the liver [18]. Consequently, Kupffer cell concentrations have been reported to correlate with pathological severity in human patients with NAFLD [19]. In the murine NAFLD model, CD68-positive cells appeared after 2 weeks in group M and reached peak numbers at week 8, whereas they decreased in number in group R. Thus, an early change to a normal diet may promote the recovery of liver inflammation. However, after 16 weeks on the MCD diet, CD68-positive cells eventually became swollen or began to fuse, as reported by Lefkowitch et al., indicating an increase in their phagocytic activity. This phenomenon also correlates with the irreversible fibrosis observed after 16 weeks on the MCD diet (Figure 11). The appearance of swollen CD68-positive cells after 16 weeks may be one of the typical signs of the “Kupffer cell ruining phenomenon” caused by excessive phagocytosis in the late stages of steatohepatitis [4].
In addition, real-time PCR analyses revealed that the expression of several proteins in CD68-positive cells may mediate the pathological responses seen in animals fed the MCD diet. CCL-2, or monocyte chemoattractant protein-1, is the main ligand of CC chemokine receptor 2 [20] and primarily controls the infiltration of blood monocytes into the liver [21]. Reports indicate that within the liver, Kupffer cells are the predominant producers of MMP-9, which is associated with their activation [22]. MMP-13 is also produced by Kupffer cells to hydrolyze the extracellular matrix [22] and aid in eliminating fibrosis [22,23].
In this model, both CCL-2 and MMP-13 mRNA expression peaked at 8 weeks but decreased significantly thereafter. In contrast, MMP-9 mRNA expression increased significantly after 16 weeks in animals being fed the MCD diet. Therefore, it is suggested that as steatohepatitis progressed during the early stage of the MCD diet (until 8 weeks), CCL-2 expression resulted in an increase of CD68-positive cells. These cells would have been activated to inhibit fibrosis by producing MMP-13. As feeding of the MCD diet became prolonged, Kupffer cells seemed to decrease MMP-13 expression, leading to a characteristic fibrogenic liver at late stages (≥16 weeks). The appearance of swollen CD68-positive cells may also be the ultimate sign of Kupffer cell activation. Thus, as the severity of NASH in C57BL/6 mice increases, so does the stress placed on the macrophage populations that maintain healthy liver function [6]. Hepatocytes and other non-parenchymal cells may also be candidate producers of MMPs, including MMP-13 [24]. Further studies using other functional markers are needed to test these possibilities.
In conclusion, an MCD diet administered to CD57BL/6 mice for <16 weeks resulted in severe but reversible steatohepatitis, whereas an MDC diet lasting ≥16 weeks induced irreversible liver fibrosis, even after restoration of choline and methionine to the diet. Kupffer cells may play a key role in both the early stages of steatohepatitis and the late irreversible fibrosis resulting from phagocytosis-associated MMP induction. Controlling these phagocytic activities during the various stages of NAFLD may be crucial in effectual treatments for steatohepatitis and hepatic fibrosis.
Acknowledgements
Thanks are given to Dr. S. Kitahara, Dr. S. Kikuta-Miyamoto, Ms. Y. Yamazaki, Ms. K. Nakada, Ms. H. Sagawa, and Ms. K. Motomaru (Department of Anatomy and Developmental Biology, Graduate School of Medicine, TWMU) for their support and technical assistance. This work was supported in part by the Global COE program in TWMU, the Multidisciplinary Education and Research Center for Regenerative Medicine (MERCREM), and the Ministry of Education, Culture, Sports Science, and Technology (MEXT), Japan.
References
- 1.Sanyal AJ. NASH: A global health problem. Hepatol Res. 2011;41:670–674. doi: 10.1111/j.1872-034X.2011.00824.x. [DOI] [PubMed] [Google Scholar]
- 2.Krawczyk M, Bonfrate L, Portincasa P. Nonalcoholic fatty liver disease. Best Pract Res Clin Gastroenterol. 2010;24:695–708. doi: 10.1016/j.bpg.2010.08.005. [DOI] [PubMed] [Google Scholar]
- 3.Mu YP, Ogawa T, Kawada N. Reversibility of fibrosis, inflammation, and endoplasmic reticulum stress in the liver of rats fed a methionine-choline-deficient diet. Lab Invest. 2010;90:245–256. doi: 10.1038/labinvest.2009.123. [DOI] [PubMed] [Google Scholar]
- 4.Lefkowitch JH, Haythe JH, Regent N. Kupffer cell aggregation and perivenular distribution in steatohepatitis. Mod Pathol. 2002;15:699–704. doi: 10.1097/01.MP.0000019579.30842.96. [DOI] [PubMed] [Google Scholar]
- 5.Baffy G. Kupffer cells in non-alcoholic fatty liver disease: the emerging view. J Hepatol. 2009;51:212–223. doi: 10.1016/j.jhep.2009.03.008. [DOI] [PMC free article] [PubMed] [Google Scholar]
- 6.Maina V, Sutti S, Locatelli I, Vidali M, Mombello C, Bozzola C, Albano E. Bias in macrophage activation pattern influences non-alcoholic steatohepatitis (NASH) in mice. Clin Sci (Lond) 2012;122:545–553. doi: 10.1042/CS20110366. [DOI] [PubMed] [Google Scholar]
- 7.Oz HS, Chen TS, Neuman M. Methionine deficiency and hepatic injury in a dietary steatohepatitis model. Dig Dis Sci. 2008;53:767–776. doi: 10.1007/s10620-007-9900-7. [DOI] [PMC free article] [PubMed] [Google Scholar]
- 8.Kawashima T. Medical Technology. Tokyo: ISHIYAKU Publishers, Inc.; 1999. Oil red O stain; pp. 45–46. [Google Scholar]
- 9.Kleiner DE, Brunt EM, Van Natta M, Behling C, Contos MJ, Cummings OW, Ferrell LD, Liu YC, Torbenson MS, Unalp-Arida A, Yeh M, McCullough AJ, Sanyal AJ Nonalcoholic Steatohepatitis Clinical Research Network. Design and validation of a histological scoring system for nonalcoholic fatty liver disease. Hepatology. 2005;41:1313–1321. doi: 10.1002/hep.20701. [DOI] [PubMed] [Google Scholar]
- 10.Brunt EM, Kleiner DE, Wilson LA, Belt P, Neuschwander-Tetri BA NASH Clinical Research Network (CRN) Nonalcoholic fatty liver disease (NAFLD) activity score and the histopathologic diagnosis in NAFLD: distinct clinicopathologic meanings. Hepatology. 2011;53:810–820. doi: 10.1002/hep.24127. [DOI] [PMC free article] [PubMed] [Google Scholar]
- 11.Livak KJ, Schmittgen TD. Analysis of relative gene expression data using real-time quantitative PCR and the 2(-Delta Delta C(T)) Method. Methods. 2001;25:402–408. doi: 10.1006/meth.2001.1262. [DOI] [PubMed] [Google Scholar]
- 12.McCuskey RS, Ito Y, Robertson GR, McCuskey MK, Perry M, Farrell GC. Hepatic microvascular dysfunction during evolution of dietary steatohepatitis in mice. Hepatology. 2004;40:386–393. doi: 10.1002/hep.20302. [DOI] [PubMed] [Google Scholar]
- 13.Anstee QM, Goldin RD. Mouse models in non-alcoholic fatty liver disease and steatohepatitis research. Int J Exp Pathol. 2006;87:1–16. doi: 10.1111/j.0959-9673.2006.00465.x. [DOI] [PMC free article] [PubMed] [Google Scholar]
- 14.Tsujimoto T, Kawaratani H, Kitazawa T, Hirai T, Ohishi H, Kitade M, Yoshiji H, Uemura M, Fukui H. Decreased phagocytic activity of Kupffer cells in a rat nonalcoholic steatohepatitis model. World J Gastroenterol. 2008;14:6036–6043. doi: 10.3748/wjg.14.6036. [DOI] [PMC free article] [PubMed] [Google Scholar]
- 15.Khosravi S, Alavian SM, Zare A, Daryani NE, Fereshtehnejad SM, Keramati MR, Abdollahzade S, Taba Taba Vakili S. Non-alcoholic fatty liver disease and correlation of serum alanin aminotransferase level with histopathologic findings. Hepat Mon. 2011;11:452–458. [PMC free article] [PubMed] [Google Scholar]
- 16.Karlmark KR, Weiskirchen R, Zimmermann HW, Gassler N, Ginhoux F, Weber C, Merad M, Luedde T, Trautwein C, Tacke F. Hepatic recruitment of the inflammatory Gr1+ monocyte subset upon liver injury promotes hepatic fibrosis. Hepatology. 2009;50:261–274. doi: 10.1002/hep.22950. [DOI] [PubMed] [Google Scholar]
- 17.Diehl AM. Nonalcoholic steatosis and steatohepatitis IV. Nonalcoholic fatty liver disease abnormalities in macrophage function and cytokines. Am J Physiol Gastrointest Liver Physiol. 2002;282:G1–5. doi: 10.1152/ajpgi.00384.2001. [DOI] [PubMed] [Google Scholar]
- 18.Armbrust TS, Chitnis PR, Guikema JA. Organization of photosystem I polypeptides examined by chemical cross-linking. Plant Physiol. 1996;111:1307–1312. doi: 10.1104/pp.111.4.1307. [DOI] [PMC free article] [PubMed] [Google Scholar]
- 19.Park JW, Jeong G, Kim SJ, Kim MK, Park SM. Predictors reflecting the pathological severity of non-alcoholic fatty liver disease: comprehensive study of clinical and immunohistochemical findings in younger Asian patients. J Gastroenterol Hepatol. 2007;22:491–497. doi: 10.1111/j.1440-1746.2006.04758.x. [DOI] [PubMed] [Google Scholar]
- 20.Zhao J, Zhou G, Li M, Li W, Lü J, Xiong L, Liang L, Zhao Y, Xu D, Yu J. A novel non-alcoholic steatohepatitis animal model featured with insulin resistance, hepatic inflammation and fibrosis. Scand J Gastroenterol. 2010;45:1360–1371. doi: 10.3109/00365521.2010.497938. [DOI] [PubMed] [Google Scholar]
- 21.Baeck C, Wehr A, Karlmark KR, Heymann F, Vucur M, Gassler N, Huss S, Klussmann S, Eulberg D, Luedde T, Trautwein C, Tacke F. Pharmacological inhibition of the chemokine CCL2 (MCP-1) diminishes liver macrophage infiltration and steatohepatitis in chronic hepatic injury. Gut. 2012;61:416–426. doi: 10.1136/gutjnl-2011-300304. [DOI] [PubMed] [Google Scholar]
- 22.Sakaida I, Hironaka K, Terai S, Okita K. Gadolinium chloride reverses dimethylnitrosamine (DMN)-induced rat liver fibrosis with increased matrix metalloproteinases (MMPs) of Kupffer cells. Life Sci. 2003;72:943–959. doi: 10.1016/s0024-3205(02)02342-1. [DOI] [PubMed] [Google Scholar]
- 23.Hironaka K, Sakaida I, Matsumura Y, Kaino S, Miyamoto K, Okita K. Enhanced interstitial collagenase (matrix metalloproteinase-13) production of Kupffer cell by gadolinium chloride prevents pig serum-induced rat liver fibrosis. Biochem Biophys Res Commun. 2000;267:290–295. doi: 10.1006/bbrc.1999.1910. [DOI] [PubMed] [Google Scholar]
- 24.Uchinami H, Seki E, Brenner DA, D’Armiento J. Loss of MMP 13 attenuates murine hepatic injury and fibrosis during cholestasis. Hepatology. 2006;44:420–429. doi: 10.1002/hep.21268. [DOI] [PubMed] [Google Scholar]