

Abstract
Classic Hodgkin lymphoma (cHL), a germinal-center related B cell neoplasm in almost all cases, is characterized by scarcity of the neoplastic Hodgkin/Reed-Sternberg (H/RS) cells. Epstein-Barr virus (EBV) has been shown to affect cell cycle and regulation of apoptosis. In total, 95 cases of cHL were studied. Five-micrometer sections were prepared and stained with hematoxylin and eosin and immunohistochemical streptavidin-biotin methods for EBV-LMP-1, COX-2, p53, p16, ki-67 and cleaved caspase-3. In-situ hybridization for EBV encoded RNA was used to confirm the detection of EBV in H/RS. There were 49 nodular sclerosis, 32 mixed cellularity, 8 lymphocyte-rich, and 6 lymphocyte-depleted subtypes in this series of cases. EBV, COX-2, p16INK4A and p53 were detected in 55% (52/95), 64% (61/95), 62% (59/95), and 65% (62/95) of the cases respectively. EBV was detected in 62% (38/61), 70% (41/59), and 69% (43/62) of COX2, p16 and p53 positive cases respectively. On the other hand, EBV-non-infected cases of cHL are associated with 59% (20/34), 69% (25/36), and 73% (24/33) of COX2, p16 and p53 negative cases respectively. In conclusion, EBV infection is associated with the expression of COX-2, p16INK4A and p53. EBV might be the dominant factor in determining the expression of these three proteins.
Keywords: Hodgkin lymphoma, Epstein Barr virus, COX-2, P16, P53
Introduction
Classic Hodgkin lymphoma (cHL), a germinal-center related B cell neoplasm in nearly all cases [1], is characterized by the scarcity of the neoplastic Hodgkin/Reed-Sternberg (H/RS) cell (1%-10%) with a background of extensive inflammatory infiltrate [2]. Most H/RS cells are in G1, S, or G2 phases of the cell cycle [3] and have defective cell cycle and apoptosis regulation with alterations of the p53 and Rb tumor suppressor pathways. Constitutive activation of the nuclear factor (NF)-kappa B pathway is believed to be involved in the proliferation and survival of these cells [4].
Epstein-Barr virus (EBV) is present in H/RS cells in 30-96% of cHL cases [5] where it has been shown to affect the cell cycle and regulation of apoptosis [6]. EBV is believed to play a causative role in other B cell malignancies in immunosuppressed individuals [2]. Although, EBNA3C is not typically expressed in HRS cells featuring a type-2 latent EBV infection, EBV may encode proteins that promote cell cycle entry by inactivating the retinoblastoma protein (pRb) [7]. pRb is a tumor suppressor protein that in its hypophosphorylated state, functions as a negative regulator of the cell cycle by forming complexes with transcription factor, E2F1. E2F1 in its active state induces transcription of target genes required for S-phase transition. When pRb is phosphorylated by the cyclin D/CDKs complexes, it becomes inactivated and releases E2F1, thus permitting entry into the G1-S phases [8]. Phosphorylation of pRb [8] can be prevented by binding of the p16INK4A protein to cyclin dependent kinase (CDK) 4 and CDK6, competing with cyclin D1, and prevents phosphorylation of pRb [8]. The p16INK4A gene, located at 9p21 locus, is a G1-specific cell cycle regulatory gene [8].
Cyclooxygenase (Cox) catalyzes the conversion of arachidonic acid to prostaglandins and thromboxanes [9] and exists in two isoforms, Cox-1 and Cox-2. Cox-2 is usually not detectable but is inducible by bacterial endotoxin, cytokine, growth factors, and tumor promoters [10]. Cox2 regulates cell proliferation, cell adhesion, inhibition of apoptosis, immune surveillance, and angiogenesis through synthesis of prostaglandin E2 [11]. NF-κB, nuclear factor for interleukin-6 (NF-IL-6) and CRE binding (CREB) are the main transcription factors responsible for the regulation of Cox-2 expression [12-15]. EBV LMP-1 and Epstein-Barr nuclear antigen (EBNA) 3c have been shown to upregulate NF-κB that binds to cis-acting elements in the Cox-2 promoter leading to the transcriptional activation of Cox-2 [16,17].
Although Cox-2 has been reported to be involved in carcinogenesis and tumor progression in colonic adenocarcinoma and in several other malignancies [18-25], there are few studies reporting the association between HL and expression of Cox-2. Up-regulation of prostaglandin synthesis occurs in HL tissues [26]. Hsu et al [27] reported the expression of prostaglandin H synthase in HRS cells of mixed cellularity (MC) HL and nodular sclerosis (NS) HL. Cox-2 expression was detected by Hazar et al [28] in seven of 10 cases of cHL. Chang et al. [29] reported a reduced risk of cHL in a group taking low dose aspirin, a known inhibitor of prostaglandins.
The p53 protein acts in the cell cycle to interrupt it at the G1 phase [30]. This suppression allows DNA repair in injured cells. Wild-type p53 accumulates in response to DNA damage, and this, in turn, promotes growth arrest and/or apoptosis [31]. Mutation of p53 resulting in increased levels of p53 protein expression is classically associated with p53 tumor activity [32].
In the present study we investigate the correlation of EBV infection with the expression of COX-2, p16INK4A, and p53 in H/RS cells in classic Hodgkin lymphoma and its effect on H/RS cell proliferation and apoptosis.
Materials and methods
Review of cases
Archival paraffin blocks of 95 cases of previously diagnosed cHL were obtained from surgical pathology files of Tawam Hospital in Al-Ain city. Tawam Hospital is the national oncology center of the UAE. All hematoxylin and eosin (H&E) and immunohistochemical stained sections were reviewed to confirm the diagnosis and to classify the cases into histologic subtypes according to the WHO classification [33].
Research ethical approval
This research project is approved by Al Ain Medical District Human Research Ethical Committee-Protocol No. 05-45.
Immunohistochemistry
Immunohistochemical (IHC) staining was performed by standard techniques using the following primary antibodies: EBV-latent membrane protein-1 (LMP-1) (mouse monoclonal, clone CS.1-4, DAKO, Glostrup, Denmark, 1:100), COX-2 (mouse monoclonal, clone CX-294, DAKO, Glostrup, Denmark, 1:50), p16INK4A (rabbit polyclonal, Santa Cruz biotechnology, USA, 1:50), p53 (mouse monoclonal, clone DO-7, DAKO, Glostrup, Denmark, 1:50) and ki-67 (mouse monoclonal, clone MIB-1, DAKO, Glostrup, Denmark, 1:50).
Sections from tonsillar tissue were used as positive controls for ki-67. For p53, and COX-2, sections from a known colonic carcinoma were used as a positive control. For p16INK4A, sections from a known cervical carcinoma were used as a positive control. For LMP-1, known positive control sections of Hodgkin lymphoma were used. For negative controls, primary antibody was replaced with normal goat serum and the whole procedure was carried out as in the standard procedure.
Staining method for apoptosis
Signal stain cleaved casapase-3 IHC detection kit (Cell Signaling Technology, Boston, USA) was used to detect the activation of caspase using standard avidin-biotin immunoperoxidase method to detect intracellular casapase-3 protein. Staining was performed by standard technique using rabbit anti-human polyclonal antibody. A known positive control sections for apoptosis from breast carcinoma were used. For negative control, primary antibody was replaced with normal rabbit serum and the whole procedure was carried out as in the standard procedure.
In situ hybridization
In situ hybridization (ISH) was performed by standard techniques using a specific oligonucleotide probe (Novocastra-LEBV-K, UK) which hybridizes to EBV encoded RNA (EBER) transcripts concentrated in the nuclei of latently infected cells. With each batch of cases studied, positive and negative control slides were also run. The positive control slide was a known case of EBV positive HL to which a specific EBER oligonucleotide probe was added. The negative control slide was another section of the same case of known EBV positive HL to which a random probe consisting of fluorescein labeled oligonucleotide cocktail was added. In addition, for each case studied, two sections were used; the EBER oligonucleotide probe was added to one section, and the random probe was added to the other. Using this random probe as a negative background control alongside the EBV probe contributes to the validation of staining obtained by the EBV probe. If this negative control slide showed significant background staining in a particular case, the slide having the EBER probe was considered non-interpretable and the test was repeated.
Interpretation of results
Two pathologists first reviewed the slides independently. When there was disagreement, a third pathologist reviewed the slides and a consensus was reached. Using the H&E and immunohistochemical stains, cases were classified into HL histologic subtypes. For EBV detection, slides stained by IHC and ISH were reviewed independently to prevent any bias. For IHC, cases were labeled as positive for EBV-LMP-1 expression if the neoplastic cells were reactive in a membrane, cytoplasmic and/or Golgi staining pattern in H/RS cells. For ISH, cells with a blue precipitate in the nucleus of H/RS cells were identified as positive for the presence of EBER when the negative control slide showed a clean background. EBV expression was considered positive if H/RS cells were positive by both methods. For COX-2 IHC, cases were labeled positive if H/RS cells were reactive in a cytoplasmic staining pattern in more than 10% of H/RS cells. For p16INK4A IHC, cases were labeled positive if H/RS cells were reactive in a nuclear and cytoplasmic staining pattern in more than 10% of H/RS cells. For p53 IHC, cases were labeled positive if H/RS cells were reactive in a nuclear staining pattern in more than 10% of H/RS cells.
Apoptotic index
The apoptotic index (AI) based on cleaved caspase-3 labeling was determined by counting the number of H/RS cells in 10 randomly selected fields without sclerosis or fibrosis. For cleaved caspase-3 labeling, H/RS cells were considered apoptotic when there was a cytoplasmic staining pattern. The labeling index for H/RS cells was expressed as the percentage of labeled H/RS cell against the total number of H/RS cells enumerated.
Ki-67 index
The Ki-67 index based on anti-Ki-67 protein labeling was determined by randomly counting the number of H/RS cells in ten randomly selected fields without sclerosis or fibrosis. For Ki-67 labeling, H/RS cells were considered positive when they showed a nuclear staining pattern. The Ki-67 index for H/RS cells was expressed as the percentage of labeled H/RS cell against the total number of H/RS cells enumerated.
Statistical analysis
Data were analyzed using Statistical Package for Social Sciences (SPSS) (version 20) statistical program (SPSS, Chicago, IL). Standard cross-tabulation, the Chi-square and Mantel-Haenszel test were used to explore associations. Student t test was used to compare ki-67 and apoptotic indices in relation to the expression of EBV, COX-2, p16INK4A, and p53.
Results
There were 49 nodular sclerosis (NS), 32 mixed cellularity (MC), 8 lymphocyte-rich (LR), and 6 lymphocyte depletion (LD) subtypes in this series of cases (Table 1).
Table 1.
Expression of EBV, COX-2, p16INK4A and p53 in cHL
| Histologic type | Number | LMP-1/EBER | Cox-2 | p16 | p53 |
|---|---|---|---|---|---|
| Nodular sclerosis | 49 | 24 (49%) | 33 (67%) | 32 (65%) | 31 (63%) |
| Mixed Cellularity | 32 | 20 (62%) | 20 (62%) | 21 (65%) | 23 (72%) |
| Lymphocytic-rich | 8 | 5 (62%) | 4 (50%) | 4 (50%) | 5 (62%) |
| Lymphocytic depletion | 6 | 3 (50%) | 4 (66%) | 2 (33%) | 3 (50%) |
| Total | 95 | 52 (55%) | 61 (64%) | 59 (62%) | 62 (65%) |
Expression of EBV in H/RS cell in cHL
EBV-positive cases show brown cytoplasmic staining of LMP-1 and bluish nuclear staining for EBER in H/RS cells (Figure 1A and 1B). EBV was detected in 55% (52/95) of the cases (Table 1, Figure 1A and 1B). The median percentage of EBV-positive H/RS cells is 36%. 49% of NS, 62% of MC, 62% of LR and 50% of LD were positive for EBV (Table 1, Figure 2).
Figure 1.
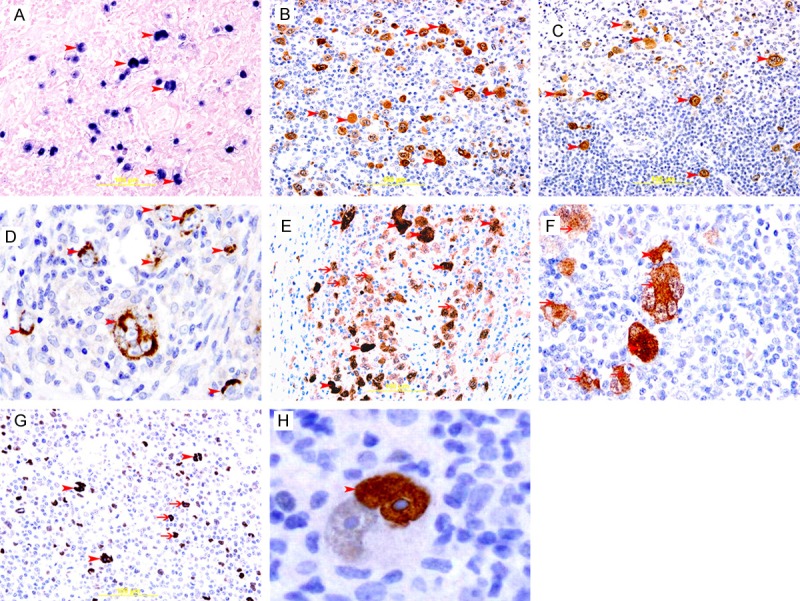
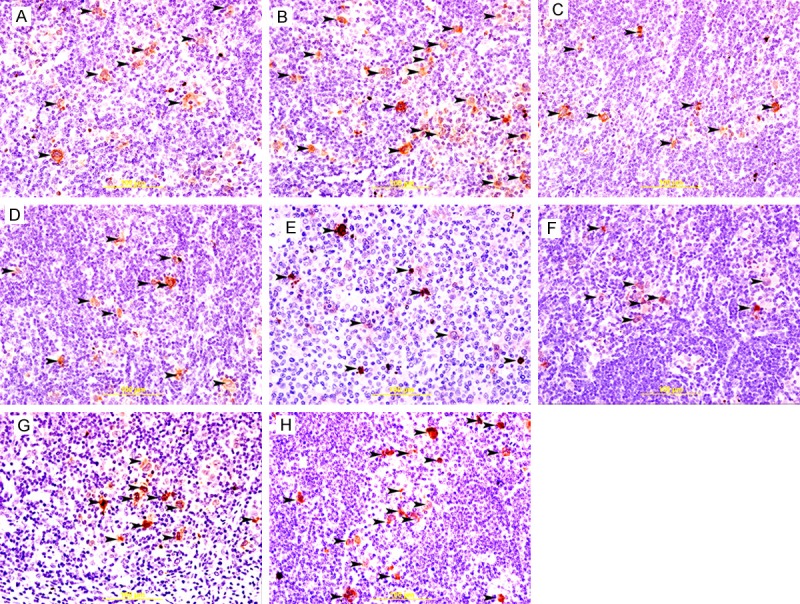
Expression of EBV, COX2, p16 and p53 in cHL. A: Representative section of cHL showing blue nuclear staining of H/RS cells (arrow head) for EBER, In situ hybridization method. B: Representative section of cHL showing brown membranous and cytoplasmic staining of H/RS cell (arrow head) for LMP-1, Immunoperoxidase streptavidin-biotin method. C&D: Representative section of cHL showing brown cytoplasmic staining of H/RS cell (arrow head) for COX2, Immunoperoxidase streptavidin-biotin method. E&F: Representative section of cHL showing brown nuclear (arrow head) and cytoplasmic (thin arrow) staining of H/RS cell for p16, Immunoperoxidase streptavidin-biotin method. G: Representative section of cHL showing brown nuclear staining of binucleated RS cells (arrow head) and mononucleated H/RS cells (thin arrows ) for p53, Immunoperoxidase streptavidin-biotin method. H: A binucleated RS cell showing strong nuclear staining (arrow head) for p53 in one nucleus, please note, big prominent nucleolus is not stained for p53.
Figure 2.
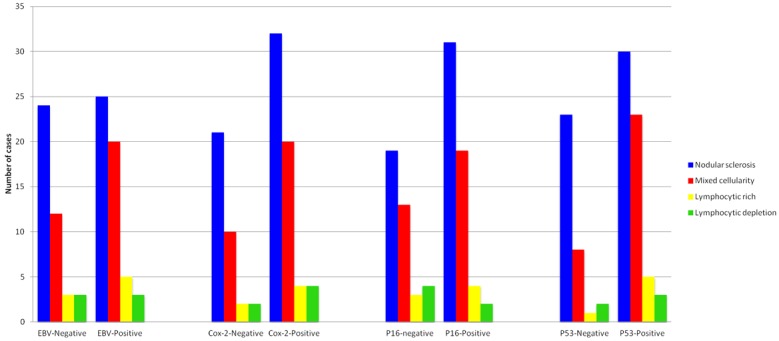
Bar graph showing expression of EBV, COX-2, p16 and p53 in histologic subtypes of classic Hodgkin lymphoma.
Expression of COX2 in H/RS cell in cHL
There was brown cytoplasmic staining of COX-2 in H/RS cells in COX2-positive cases. COX-2 was detected in 64% (61/95) of the cases (Table 1, Figure 1C and 1D). The median percentage of COX2-positive H/RS cells is 48%. 67% of NS, 62% of MC, 50% of LR and 66% of LD were positive for COX2 (Table 1, Figure 2).
A statistically significant relationship was observed between the presence of EBV and expression of COX-2 (p=0.047) (Table 2).
Table 2.
Cross tabulation of EBV expression and COX-2 expression in H/RS cells in HL
| Expression | COX-2 | Total | ||
|---|---|---|---|---|
|
| ||||
| Negative | Positive | |||
| EBV | Negative | 20 | 23 | 43 |
| Positive | 14 | 38 | 52 | |
| Total | 34 | 61 | 95 | |
Expression of p16INK4A in H/RS cell in cHL
There was brown nuclear and cytoplasmic staining of p16 in H/RS cells in p16-positive cases. Expression of p16INK4A was detected in 62% (59/95) of the cases (Table 1, Figure 1E and 1F). The median percentage of p16-positive HRS cells is 38%. 65% of NS, 65% of MC, 50% of LR and 33% of LD were positive for p16INK4A (Table 1, Figure 2).
A statistically significant relationship was observed between the presence of EBV and expression of p16 (p<0.0001) (Table 3).
Table 3.
Cross tabulation of EBV expression and p16 expression in H/RS cells in HL
| Expression | P16 | Total | ||
|---|---|---|---|---|
|
| ||||
| Negative | Positive | |||
| EBV | Negative | 25 | 18 | 43 |
| Positive | 11 | 41 | 52 | |
| Total | 36 | 59 | 95 | |
Expression of p53 in H/RS cell in cHL
There was brown nuclear staining of p53 in H/RS cells in p53-positive cases. The expression of p53 was detected in 65% (62/95) of the cases (Table 1, Figure 1G and 1H). The median percentage of p53-positive HRS cells is 47%. 63% of NS, 72% of MC, 62% of LR and 50% of LD were positive for p53 (Table 1, Figure 2).
A statistically significant relationship was observed between the presence of EBV and expression of p53 (p<0.001) (Table 4).
Table 4.
Cross tabulation of EBV expression and p53 expression in H/RS cells in HL
| Expression | P53 | Total | ||
|---|---|---|---|---|
|
| ||||
| Negative | Positive | |||
| EBV | Negative | 24 | 19 | 43 |
| Positive | 9 | 43 | 52 | |
| Total | 33 | 62 | 95 | |
Correlation of EBV with COX2, p16 and p53 in H/RS cell in cHL
EBV was detected in 62% (38/61), 70% (41/59), and 69% (43/62) of COX2, p16 and p53 positive cases respectively (Tables 2, 3 and 4). On the other hand, EBV-non-infected cases of cHL are associated with 59% (20/34), 69% (25/36), and 73% (24/33) of COX2, p16 and p53 negative cases respectively (Tables 2, 3 and 4). Hence, EBV expression was strongly associated with the expression of COX-2, p16INK4A and p53. Cox-2, p16, and p53 were also strongly, and statistically significant mutually associated. However, this association became statistically not significant when adjusting for EBV infection (by Mantel-Haenszel test). This suggests that EBV is the dominant factor in determining the expression of these three factors.
Cell proliferation and apoptosis
Ki-67 positivity ranged from 29% to 95% of the H/RS cells, with variable staining intensity from case to case. The mean Ki-67 index in EBV+ve cHL was 77% but only 64% in EBV-ve cHL (Figure 3A) and (Figure 4A and 4B). There was a significant association between the expressions of EBV and the Ki-67 index (p: 0.001) (Table 5). The mean Ki-67 index in COX-2+ve cHL was 71% but only 69% in COX-2-ve cHL (Figure 3C) and (Figure 4C and 4D). There was no significant association between the expression of COX-2 and the Ki-67 index (p: 0.66) (Table 5). The mean Ki-67 index in p16+ve cHL was 72% and 70% in p16-ve cHL (Figure 3E) and (Figure 4E and 4F). There was no significant association between the expressions of p16 and the ki-67 index (p value: 0.46) (Table 5). The mean Ki-67 index in p53+ve cHL was 77% and 65% in p53-ve cHL (Figure 3G) and (Figure 4G and 4H). There was a significant association demonstrable between the expression of p53 and the ki-67 index (p value: 0.003) (Table 5).
Figure 3.
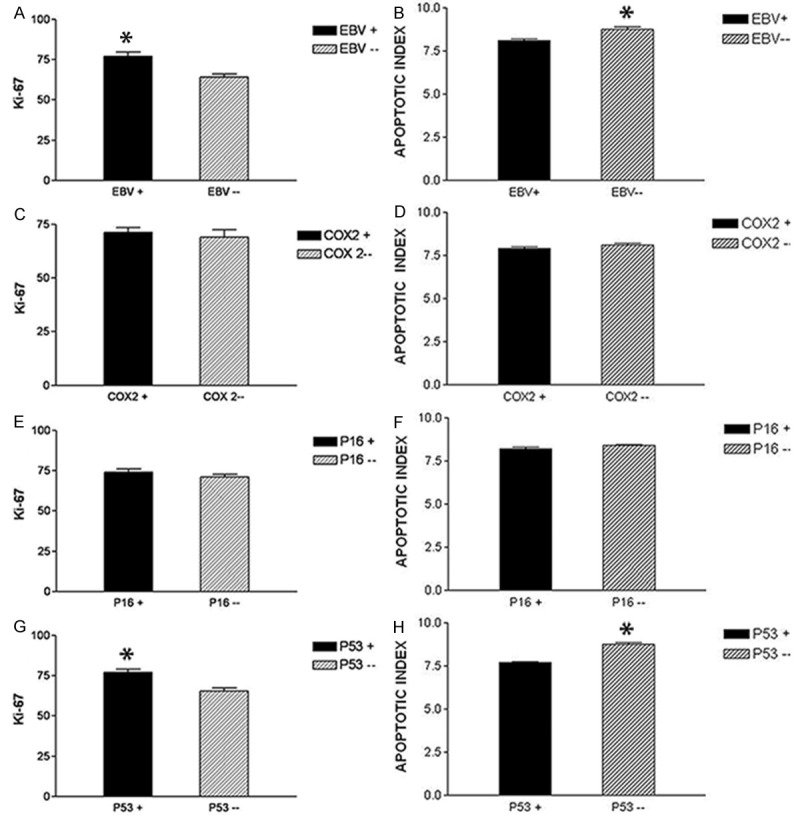
Bar graph showing Ki-67 proliferative index and apoptotic index in relation to EBV, COX2, p16 and p53 expression in H/RS cells in cHL. A: Ki-67 index in EBV+ve and EBV-ve HL, showing significant increase in ki-67 index in EBV+ve HL, B: AI in EBV+ve and EBV-ve HL, show significant increase in AI in EBV-ve HL, C: Ki-67 index in COX-2+ve and COX-2-ve HL, showing no significant difference in the ki-67 index. D: AI in COX-2+ve and COX-2-ve HL, showing no significant difference in AI. E: Ki-67 index in p16+ve and p16-ve HL, showing no significant difference in the ki-67 index. F: AI in p16+ve and p16-ve HL, showing no significant difference in the AI. G: Ki-67 index in p53+ve and p53-ve HL, is showing significant increase in ki-67 index in p53+ve HL. H: AI in p53+ve and p53-ve HL, is showing significant increase in AI in p53-ve HL.
Figure 4.
Ki-67 immunohistochemical staining in cHL. A&B: Showing nuclear immunoreactivity of H/RS cells (thick arrows) to ki-67 in EBV+ve and EBV-ve HL respectively. Some adjacent lymphocytes show immunoreactivity to ki-67 too (arrow head). There is significant increase in ki-67 positive H/RS cells (thick arrows) in EBV+ve HL. Streptavidin-biotin immunoperoxidase method. C&D: Showing nuclear immunoreactivity of H/RS cells (thick arrows) to ki-67 in COX2+ve and COX2-ve HL respectively. Some adjacent lymphocytes show immunoreactivity to ki-67 too (arrow head). There is no significant difference in ki-67 positive H/RS cells (thick arrows) between COX2+ve and COX2-ve HL. Streptavidin-biotin immunoperoxidase method. E&F: Showing nuclear immunoreactivity of H/RS cells (thick arrows) to ki-67 in p16+ve and p16-ve HL respectively. Some adjacent lymphocytes show immunoreactivity to ki-67 too (arrow head). There is no significant difference in ki-67 positive H/RS cells (thick arrows) between p16+ve and p16-ve HL. Streptavidin-biotin immunoperoxidase method. G&H: Showing nuclear immunoreactivity of H/RS cells (thick arrows) to ki-67 in p53+ve and p53-ve HL respectively. Some adjacent lymphocytes show immunoreactivity to ki-67 too (arrow head). There is significant increase in ki-67 positive H/RS cells (thick arrows) in p53+ve HL. Streptavidin-biotin immunoperoxidase method.
Table 5.
Ki-67 index and apoptotic index in relation to the expression of EBV, COX-2, p16 and p53 in H/RS cells
| Procedure | EBV | COX-2 | P16 | P53 | ||||||||
|---|---|---|---|---|---|---|---|---|---|---|---|---|
|
| ||||||||||||
| + % | - % | p value | + % | - % | p value | + % | - % | p value | + % | - % | p value | |
| Ki-67 index | 77 | 64 | 0.001 | 71 | 69 | 0.66 | 72 | 70 | 0.46 | 77 | 65 | 0.003 |
| Apoptotic index | 8.1 | 8.76 | 0.0002 | 7.9 | 8.1 | 0.27 | 8.19 | 8.38 | 0.12 | 7.69 | 8.77 | 0.0001 |
There was good correlation between apoptotic morphology and cleaved caspase-3 staining (Figure 5). The AI of the H/RS cells in the cases ranged from 5.8 to 10.6%, with a mean of 8.1% in EBV+ve cHL, while in EBV-ve cHL, the mean AI was 8.76% (Figure 3B) and (Figure 5A and 5B). Although the analysis of the EBV expression in combination with the AI showed a statistical significant correlation (p: 0.0002) (Table 5), this difference is likely of little biological meaning (8.1% vs. 8.76% AI).
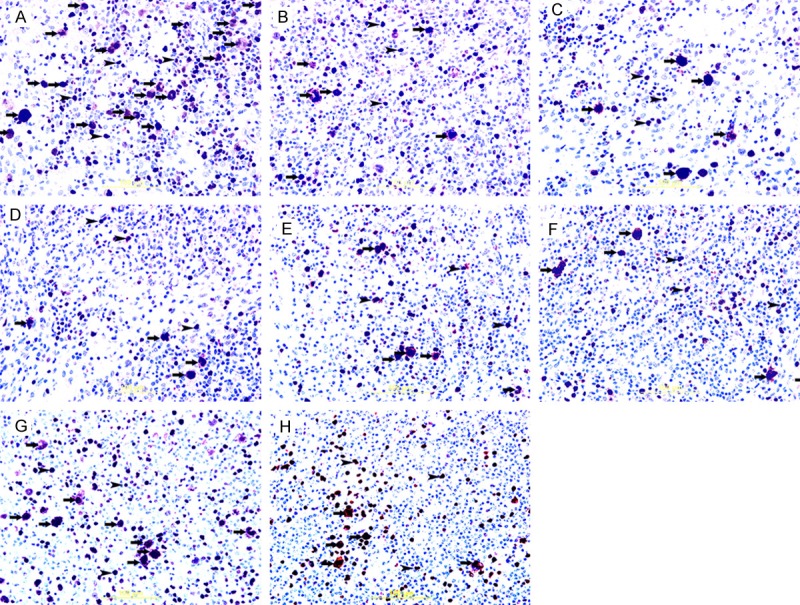
Figure 5.
Cleaved caspase 3 staining in cHL. A&B: Showing cytoplasmic immunoreactivity of H/RS cells (arrow head) to cleaved-caspase in EBV+ve and EBV-ve HL respectively. There is significant increase in cleaved-caspase-positive H/RS cells (arrow head) in EBV-ve HL. Streptavidin-biotin immunoperoxidase method. C&D: Showing cytoplasmic immunoreactivity of H/RS cells (arrow head) to cleaved-caspase in COX2+ve and COX2-ve HL respectively. There is no significant difference in cleaved-caspase-positive H/RS cells (arrow head) between COX2+ve and COX2-ve HL. Streptavidin-biotin immunoperoxidase method. E&F: Showing cytoplasmic immunoreactivity of H/RS cells (arrow head) to cleaved-caspase in p16+ve and p16-ve HL respectively. There is no significant difference in cleaved-caspase-positive H/RS cells (arrow head) between p16+ve and p16-ve HL. Streptavidin-biotin immunoperoxidase method. G&H: Showing cytoplasmic immunoreactivity of H/RS cells (arrow head) to cleaved-caspase in p53+ve and p53-ve HL respectively. There is significant increase in cleaved-caspase-positive H/RS cells (arrow head) in p53-ve HL. Streptavidin-biotin immunoperoxidase method.
The mean AI of the H/RS cells in COX-2+ve cHL was 7.9%, while in COX-2-ve cHL, the mean AI was 8.1% (Figure 3D) and (Figure 5C and 5D). Analysis of the COX-2 expression in combination with the AI did not show any statistically significant correlation (p value: 0.27) (Table 5).
The mean AI of the H/RS cells in p16+ve cHL was 8.19%, while in p16-ve cHL, the mean AI was 8.38% (Figure 3F) and (Figure 5E and 5F). Analysis of the p16 expression in combination with the AI did not show any statistically significant correlation (p value: 0.12) (Table 5).
The mean AI of the H/RS cells in p53+ve cHL was 7.69%, while in p53-ve cHL, the mean AI was 8.77% (Figure 3H) and (Figure 5G and 5H). Although the analysis of the p53 expression in combination with the AI shows a statistically significant correlation (p: 0.0001) (Table 5), this difference is likely of little biological meaning (7.69% vs. 8.77% AI).
Discussion
In recent years, there have been accumulating evidences that H/RS cells, the neoplastic-cell population in cHL, are characterized by a profound disturbance of the cell cycle and apoptosis regulation [6]. The constitutive activation of the nuclear factor (NF)-kappa B pathway is considered to be involved in the proliferation and survival of H/RS cells [4,13]. Moreover, substantial evidence that H/RS cells have defective cell cycle and apoptosis regulation has been provided by studies showing that these cells are characterized, in a large proportion of cases, by alterations of the p53 and Rb tumor suppressor pathways [34]. The positive ki-67 staining in the present study indicates that H/RS cells are undergoing active proliferation and have left the G0 phase of the cell cycle [34]. We have also shown that the mean Ki-67 index in EBV+ve cHL is significantly higher than the mean Ki-67 index in EBV-ve cHL (p=0.001). This suggests that EBV infection is important in stimulating cell proliferation in H/RS cells [35].
The present study clearly shows that expression of COX-2 in EBV-positive cHL cases is significantly higher than in EBV-negative HL cases, with the results of the Mantel-Haenszel test, suggesting that EBV is the dominant factor in determining the expression of COX-2 in cHL. This finding is supported by Kaul et al and Ohsawa et al studies [16,36]. Although the mean ki-67 index in COX-2+ve cases is higher than that in COX-2-ve cases, the results do not reach statistical significance (p=value: 0.66).
In the present study, the expression of p53 is detected in H/RS cells in 65% (62/95) of the cases. Other studies also have shown high frequency of cHL cases expressing p53 in H/RS cells [37-40].
The high rate of expression of p53 protein in H/RS cells compared with the absence of such expression in the surrounding non-neoplastic cells, suggests that the accumulated p53 in the nuclei of H/RS cells is most likely inactive, leading to loss of cell cycle control, and might be a possible step in the development of this neoplasm.
We show a significant association between p53 expression and EBV expression in H/RS cells (p<0.003). Our results show that EBV might be the dominant factor in determining the expression of p53.
There are controversial reports on the relationship between EBV and the expression of p53. Studies on this relationship in nasopharyngeal carcinoma have shown a positive correlation between EBV expression and p53 expression in neoplastic cells [41-43], while studies on this relationship in cHL are controversial. Two reports, like ours, have shown positive correlation between the expression of EBV and p53 [39,40], while two other studies have shown no correlation [37,38], and only one study [44] has shown inverse relationship between EBV and p53 expression in H/RS cells.
These differences might be related to the variability in the number of analyzed cHL cases, variable cases selection criteria, differences in used primary antibodies, variable thresholds of expression of p53 and differences in the proportion of EBV-infected cases. In addition, in Gracia et al study [44] they have used tissue microarray, and as we know that the size of sections in tissue microarray is very small (1 mm in diameter) compared with larger sections (10-30 mm) in our study, and since H/RS cells constitute 1-10% of the total number of cells in any section, there is a strong possibility of sampling variability that might contribute to this difference. Moreover, it is well noticed in many studies on p53 in cHL that the percentage of positive cases is high and usually above 50% [37-40], while in Gracia et al study [44] only 15% of cases were positive for p53. This low frequency, which is reported in this study, is unusual in cHL, and might be the reason behind their result. We also show a statistically significant (p=0.003) higher mean ki-67 index in p53+ve cases compared to p53-ve cases, indicating that p53 control of the cell cycle is affected and the high expression of p53 in our cases represents a nuclear accumulation of an inactive p53. This is supported by a statistically significant lower apoptotic index in p53+ve cases compared to p53-ve cases, indicating that p53+ve H/RS cells have less cleaved caspase-3 activity and suggesting that the p53 role in apoptosis is affected (p value: 0.0001). Here it is important to note that Bcl-2 and Bcl-xL, which are recognized inhibitors of apoptosis, have been reported to be highly expressed H/RS cells [45], although we have not attempted to examine this in this study.
The accumulation of p53 protein in the nuclei of H/RS cells can occur due to mutations in P53 gene [44-49], binding to other proteins; such as ARF [50], viral proteins [51] or MDM2 gene-related proteins [52,53], and in conditions associated with DNA damage [54]. Although, Mutation of P53 gene causes loss of function, changes of conformation, prolongs the half-life of p53 and resulting in nuclear accumulation, it is an uncommon event in cHL [55,56]. Elenitoba-Johnson et al have shown p53 expression in H/RS cells to be not correlated with gene mutations [57].
The most noticeable cellular binding partner of p53 (that could lead to p53 accumulation) is the MDM2 gene product, which regulates p53 activity in an auto-regulatory feedback loop [58]. In many neoplasms, MDM2 overexpression, which is mostly as a result of gene amplification, was found to inactivate and stabilize p53 at the same time [59,60]. The role of EBV in p53 expression is still not completely solved. Liu et al found that LMP-1 repressed p53 from mediating DNA repair and inactivated p53 transcriptional activity [61]; while, Li et al found that LMP-1 can activate p53 transcriptional activity and increased its stability through multi-sites phosphorylation of p53 protein resulting in the accumulation of p53 protein in the nucleus [62,63]. We believe that EBV might play a crucial role in p53 accumulation and inactivation in H/RS cells either by direct or indirect mechanisms, which needs more investigations. The expression of p16INK4A is detected in 62% (59/95) of the cases in our study. Other studies have also reported high frequency of cHL cases expressing p16INK4A in H/RS cells [38,40,44,64]. A significant difference in the expression of p16INK4A between EBV-positive and EBV-negative cHL cases is observed in the present study, with the results of the Mantel-Haenszel test, suggesting that EBV might be a dominant factor in determining the expression of p16INK4A.
There are controversial reports on the relationship between EBV and p16INK4A expression in H/RS cells in cHL. Zao et al [40] have shown a positive correlation between EBV and p16INK4A expression, while Kim et al [38] has shown an inverse correlation between EBV and p16INK4A expression, and Guenova et al [64] have shown no correlation between EBV and p16 expression. The variability in the relationship between EBV and p16INK4A expression is possibly related to the differences in the number of assessed cases, variable frequencies of EBV in examined cases, variable frequencies of p16INK4A in the evaluated cases, differences in cases selection criteria, differences in used primary antibody, and variability in the identification criteria of positive H/RS cells. We think that the high frequency rates of cases expressing p16INK4A and EBV might favor a positive correlation over a negative one especially, if we know that EBV might encode antigens that promote cell cycle entry by inactivating the pRb [7] and the inactivation of pRb can lead to overexpression of p16 [65,66].
In conclusion, we have found that EBV expression is associated with the expression of COX-2, p16INK4A and p53 in cHL and might be the dominant factor in determining the expression of those proteins.
Disclosure of conflict of interest
None.
References
- 1.Marafioti T, Hummel M, Foss HD, Laumen H, Korbjuhn P, Anagnostopoulos I, Lammert H, Demel G, Theil J, Wirth T, Stein H. Hodgkin and Reed-Sternberg cells represent an expansion of a single clone originating from a germinal center B-cell with functional immunoglobulin gene rearrangements but defective immunoglobulin transcription. Blood. 2000;95:1443–1450. [PubMed] [Google Scholar]
- 2.Harris NL. Hodgkin’s disease: classification and differential diagnosis. Mod Pathol. 1999;12:159–76. [PubMed] [Google Scholar]
- 3.Gerdes J, Van Baarlen J, Pileri S, Schwarting R, Van Unnik JA, Stein H. Tumor cell growth fraction in Hodgkin’s disease. Am J Pathol. 1987;128:390–3. [PMC free article] [PubMed] [Google Scholar]
- 4.Schwarzer R, Jundt F. Notch and NF-κB signaling pathways in the biology of classical Hodgkin lymphoma. Curr Mol Med. 2011;11:236–245. doi: 10.2174/156652411795243423. [DOI] [PubMed] [Google Scholar]
- 5.Al-Salam S, John A, Daoud S, Chong SM, Castella A. Expression of Epstein-Barr virus in Hodgkin lymphoma in a population of United Arab Emirates nationals. Leuk Lymphoma. 2008;49:1769–1777. doi: 10.1080/10428190802270894. [DOI] [PubMed] [Google Scholar]
- 6.Altmann M, Hammerschmidt W. Epstein-Barr virus provides a new paradigm: a requirement for the immediate inhibition of apoptosis. PLoS Biol. 2005;3:e404. doi: 10.1371/journal.pbio.0030404. [DOI] [PMC free article] [PubMed] [Google Scholar]
- 7.Knight JS, Sharma N, Robertson ES. Epstein-Barr virus latent antigen 3C can mediate the degradation of the retinoblastoma protein through an SCF cellular ubiquitin ligase. Proc Natl Acad Sci U S A. 2005;102:18562–18566. doi: 10.1073/pnas.0503886102. [DOI] [PMC free article] [PubMed] [Google Scholar]
- 8.Adams PD. Regulation of the retinoblastoma tumour suppressor protein by cyclin/CDKs. Biochim Biophys Acta. 2001;1471:M123–33. doi: 10.1016/s0304-419x(01)00019-1. [DOI] [PubMed] [Google Scholar]
- 9.Smith WL, Dewitt DL, Garavito RM. Cyclooxygenases: structural, cellular, and molecular biology. Ann Rev Biochem. 2000;69:145–182. doi: 10.1146/annurev.biochem.69.1.145. [DOI] [PubMed] [Google Scholar]
- 10.Vane JR, Bakhle YS, Botting RM. Cyclooxygenase 1 and 2. Ann Rev Pharmcol Toxicol. 1998;38:97–120. doi: 10.1146/annurev.pharmtox.38.1.97. [DOI] [PubMed] [Google Scholar]
- 11.Tilley SL, Coffman TM, Koller BH. Mixed messages: modulation of inflammation and immune responses by prostaglandins and thromboxanes. J Clin Invest. 2001;108:15–23. doi: 10.1172/JCI13416. [DOI] [PMC free article] [PubMed] [Google Scholar]
- 12.Wang S, Liu Z, Wang L, Zhang X. NF-kappaB signaling pathway, inflammation and colorectal cancer. Cell Mol Immunol. 2009;6:327–234. doi: 10.1038/cmi.2009.43. [DOI] [PMC free article] [PubMed] [Google Scholar]
- 13.Izban KF, Ergin M, Huang Q, Qin JZ, Martinez RL, Schnitzer B, Ni H, Nickoloff BJ, Alkan S. Characterization of NF-kappaB expression in Hodgkin’s disease: inhibition of constitutively expressed NF-kappa B results in spontaneous caspase-independent apoptosis in Hodgkin and Reed-Sternberg cells. Mod Pathol. 2001;14:297–310. doi: 10.1038/modpathol.3880306. [DOI] [PubMed] [Google Scholar]
- 14.Chen J, Zhao M, Rao R, Inoue H, Hao CM. C/EBP {beta} and its binding element are required for NF {kappa} B-induced COX2 expression following hypertonic stress. J Biol Chem. 2005;280:16354–16359. doi: 10.1074/jbc.M411134200. [DOI] [PubMed] [Google Scholar]
- 15.Chen J, Huang WC, Chen CC. Transcriptional regulation of cyclooxygenase-2 in response to proteasome inhibitors involves reactive oxygen species-mediated signaling pathway and recruitment of CCAAT/enhancer-binding protein delta and CREB-binding protein. Mol Biol Cell. 2005;16:5579–5591. doi: 10.1091/mbc.E05-08-0778. [DOI] [PMC free article] [PubMed] [Google Scholar]
- 16.Kaul R, Verma SC, Murakami M, Lan K, Choudhuri T, Robertson ES. Epstein-Barr virus protein can upregulate cyclo-oxygenase-2 expression through association with the suppressor of metastasis Nm23-H1. J Virol. 2006;80:1321–31. doi: 10.1128/JVI.80.3.1321-1331.2006. [DOI] [PMC free article] [PubMed] [Google Scholar]
- 17.Chuang HC, Lay JD, Hsieh WC, Su IJ. Pathogenesis and mechanism of disease progression from hemophagocytic lymphohistiocytosis to Epstein-Barr virus-associated T-cell lymphoma: nuclear factor-kappa B pathway as a potential therapeutic target. Cancer Sci. 2007;98:1281–1287. doi: 10.1111/j.1349-7006.2007.00549.x. [DOI] [PMC free article] [PubMed] [Google Scholar]
- 18.Eberhart CE, Coffey RJ, Radhika A, Giardiello FM, Ferrenbach S, DuBois RN. Up-regulation of cyclooxygenase 2 gene expression in human colorectal adenomas and adenocarcinomas. Gastroenterology. 1994;107:1183–1188. doi: 10.1016/0016-5085(94)90246-1. [DOI] [PubMed] [Google Scholar]
- 19.Joo YE, Kim HS, Min SW, Lee WS, Park CH, Park CS, Choi SK, Rew JS, Kim SJ. Expression of cyclooxygenase-2 protein in colorectal carcinomas. Int J Gastrointest Cancer. 2002;31:147–154. doi: 10.1385/IJGC:31:1-3:147. [DOI] [PubMed] [Google Scholar]
- 20.Jacoby RF, Seibert K, Cole CE, Kelloff G, Lubet RA. The cyclooxygenase-2 inhibitor celecoxib is a potent preventive and therapeutic agent in min mouse model of adenomatous polyposis. Cancer Res. 2000;60:5040–5044. [PubMed] [Google Scholar]
- 21.Giovannucci E, Egan KM, Hunter DJ, Stampfer MJ, Colditz GA, Willett WC, Speizer FE. Aspirin and the risk of colorectal cancer in women. N Engl J Med. 1995;333:609–614. doi: 10.1056/NEJM199509073331001. [DOI] [PubMed] [Google Scholar]
- 22.Schuller HM, Plummer HK 3rd, Bochsler PN, Dudric P, Bell JL, Harris RE. Co-expression of b-adrenergic receptors and cyclooxygenase-2 in pulmonary adenocarcinoma. Int J Oncol. 2001;19:445–449. [PubMed] [Google Scholar]
- 23.Half E, Tang XM, Gwyn K, Sahin A, Wathen K, Sinicrope FA. Cyclooxygenase-2 expression in human breast cancers and adjacent ductal carcinoma in situ. Cancer Res. 2002;62:1676–1681. [PubMed] [Google Scholar]
- 24.Shamma A, Yamamoto H, Doki Y, Okami J, Kondo M, Fujiwara Y, Yano M, Inoue M, Matsuura N, Shiozaki H, Monden M. Up-regulation of cyclooxygenase-2 in squamous carcinogenesis of the esophagus. Clin Cancer Res. 2000;6:1229–1238. [PubMed] [Google Scholar]
- 25.Lee JS, Choi YD, Lee JH, Nam JH, Choi C, Lee MC, Park CS, Juhng SW, Kim HS, Min KW. Expression of cyclooxygenase-2 in adenocarcinoma of the uterine cervix and its relation to angiogenesis and tumor growth. Gynecol Oncol. 2004;95:523–529. doi: 10.1016/j.ygyno.2004.08.036. [DOI] [PubMed] [Google Scholar]
- 26.Hsu SM, Xie SS, Hsu PL. Cultured Reed-Sternberg cells HDLM-1 and KM-H2 can be induced to become histiocyte like cells. H-RS cells are not derived from lymphocytes. Am J Pathol. 1990;137:353–367. [PMC free article] [PubMed] [Google Scholar]
- 27.Hsu SM, Hsu PL, Lo SS, Wu K. Expression of prostaglandin H synthase (cyclooxygenase) in Hodgkin’s mononuclear and Reed-Sternberg cells. Functional resemblance between H-RS cells and histiocytes or interdigitating cells. Am J Pathol. 1988;133:5–12. [PMC free article] [PubMed] [Google Scholar]
- 28.Hazar B, Ergin M, Seyrek E, Erdoğan S, Tuncer I, Hakverdi S. Cyclooxygenase-2 (Cox-2) expression in lymphomas. Leuk Lymphoma. 2004;45:1395–1399. doi: 10.1080/10428190310001654032. [DOI] [PubMed] [Google Scholar]
- 29.Chang ET, Zheng T, Weir EG, Borowitz M, Mann RB, Spiegelman D, Mueller NE. Aspirin and the risk of Hodgkin’s lymphoma in a population-based case-control study. J Natl Cancer Inst. 2004;96:305–315. doi: 10.1093/jnci/djh038. [DOI] [PubMed] [Google Scholar]
- 30.Levine AJ, Momand J, Finlay CA. The p53 tumour suppressor gene. Nature. 1991;351:453–6. doi: 10.1038/351453a0. [DOI] [PubMed] [Google Scholar]
- 31.Bellamy COC. p53 and apoptosis. Br Med Bull. 1996;53:522–538. doi: 10.1093/oxfordjournals.bmb.a011628. [DOI] [PubMed] [Google Scholar]
- 32.Trümper LH, Brady G, Bagg A, Gray D, Loke SL, Griesser H, Wagman R, Braziel R, Gascoyne RD, Vicini S. Single-cell analysis of Hodgkin and Reed-Sternberg cells: molecular heterogeneity of gene expression and p53 mutations. Blood. 1993;81:3097–115. [PubMed] [Google Scholar]
- 33.Swerdlow SH, Campo E, Harris NL, Harris NL, Jaffe ES, Pileri SA, Stein H, Thiele J, Vardiman JW. World Health Organization classification of tumors of haematopoietic and lymphoid tissues. lyon: IARC; 2008. [Google Scholar]
- 34.Bai M, Papoudou-Bai A, Kitsoulis P, Horianopoulos N, Kamina S, Agnantis NJ, Kanavaros P. Cell cycle and apoptosis deregulation in classical Hodgkin lymphomas. In Vivo. 2005;19:439–53. [PubMed] [Google Scholar]
- 35.Naresh KN, Johnson J, Srinivas V, Soman CS, Saikia T, Advani SH, Badwe RA, Dinshaw KA, Muckaden M, Magrath I, Bhatia K. Epstein-Barr virus association in classical Hodgkin’s disease provides survival advantage to patients and correlates with higher expression of proliferation markers in Reed-Sternberg cells. Ann Oncol. 2000;11:91–96. doi: 10.1023/a:1008337100424. [DOI] [PubMed] [Google Scholar]
- 36.Ohsawa M, Fukushima H, Ikura Y, Inoue T, Shirai N, Sugama Y, Suekane T, Kitabayashi C, Nakamae H, Hino M, Ueda M. Expression of cyclooxygenase-2 in Hodgkin’s lymphoma: Its role in cell proliferation and angiogenesis. Leuk Lymphoma. 2006;47:1863–1871. doi: 10.1080/10428190600685442. [DOI] [PubMed] [Google Scholar]
- 37.Kanavaros P, Stefanaki K, Vlachonikolis J, Eliopoulos G, Kakolyris S, Rontogianni D, Gorgoulis V, Georgoulias V. Expression of p53, p21/waf1, bcl-2, bax, Rb and Ki67 proteins in Hodgkin’s lymphomas. Histol Histopathol. 2000;15:445–53. doi: 10.14670/HH-15.445. [DOI] [PubMed] [Google Scholar]
- 38.Kim LH, Peh SC, Poppema S. Expression of retinoblastoma protein and P16 proteins in classic Hodgkin lymphoma: relationship with expression of p53 and presence of Epstein-Barr virus in the regulation of cell growth and death. Hum Pathol. 2006;37:92–100. doi: 10.1016/j.humpath.2005.09.028. [DOI] [PubMed] [Google Scholar]
- 39.Qi ZL, Zhao T, Zhou XH, Zhang JH, Han XQ, Zhu MG. Expressions of latent membrane protein 1, p53 and bcl-2 proteins and their significance in Hodgkin’s lymphoma. Di Yi Jun Yi Da Xue Xue Bao. 2003;23:225–7. [PubMed] [Google Scholar]
- 40.Zhao P, Lu Y, Liu L, Zhong M. Aberrant cytoplasmic expression of cyclin B1 protein and its correlation with EBV-LMP1, P53 and P16 (INK4A) in classical Hodgkin lymphoma in China. Pathol Oncol Res. 2011;17:369–73. doi: 10.1007/s12253-010-9335-x. [DOI] [PubMed] [Google Scholar]
- 41.Liu QY, Han AJ, You SY, Dong Y, Yang QX, Wu JH, Li MF. Correlation of Epstein-Barr virus-encoded latent membrane protein 1 (LMP1) to fascin and phosphorylated Stat3 in nasopharyngeal carcinoma. Ai Zheng. 2008;27:1070–6. [PubMed] [Google Scholar]
- 42.Shao JY, Ernberg I, Biberfeld P, Heiden T, Zeng YX, Hu LF. Epstein-Barr virus LMP1 status in relation to apoptosis, p53 expression and leucocyte infiltration in nasopharyngeal carcinoma. Anticancer Res. 2004;24:2309–18. [PubMed] [Google Scholar]
- 43.Niemhom S, Kitazawa S, Murao S, Kunachak S, Maeda S. Co-expression of p53 and bcl-2 may correlate to the presence of epstein-barr virus genome and the expression of proliferating cell nuclear antigen in nasopharyngeal carcinoma. Cancer Lett. 2000;160:199–208. doi: 10.1016/s0304-3835(00)00582-6. [DOI] [PubMed] [Google Scholar]
- 44.García JF, Camacho FI, Morente M, Fraga M, Montalbán C, Alvaro T, Bellas C, Castaño A, Díez A, Flores T, Martin C, Martinez MA, Mazorra F, Menárguez J, Mestre MJ, Mollejo M, Sáez AI, Sánchez L, Piris MA Spanish Hodgkin Lymphoma Study Group. Hodgkin and Reed-Sternberg cells harbor alterations in the major tumor suppressor pathways and cell-cycle checkpoints: analyses using tissue microarrays. Blood. 2003;10:681–689. doi: 10.1182/blood-2002-04-1128. [DOI] [PubMed] [Google Scholar]
- 45.Kim LH, Veera S, Peh SC, Poppema S. Expression of Bcl-2 familymembers and presence of EBV in cell growth and death in classical Hodgkin’s lymphoma. Histopathology. 2004;44:257–267. doi: 10.1111/j.0309-0167.2004.01829.x. [DOI] [PubMed] [Google Scholar]
- 46.Blagosklonny MV. Loss of function and p53 protein stabilization. Oncogene. 1997;15:1889–1893. doi: 10.1038/sj.onc.1201374. [DOI] [PubMed] [Google Scholar]
- 47.Feuerborn A, Möritz C, Von Bonin F, Dobbelstein M, Trümper L, Stürzenhofecker B, Kube D. Dysfunctional p53 deletion mutants in cell lines derived from Hodgkin’s lymphoma. Leuk Lymphoma. 2006;47:1932–40. doi: 10.1080/10428190600667721. [DOI] [PubMed] [Google Scholar]
- 48.Maki CG. P53 gene alterations identified in classical Hodgkin’s lymphoma cell lines. Leuk Lymphoma. 2006;47:1734–1735. doi: 10.1080/10428190600693156. [DOI] [PubMed] [Google Scholar]
- 49.Chen WG, Chen YY, Kamel OW, Koo CH, Weiss LM. p53 mutations in Hodgkin’s disease. Lab Invest. 1996;75:519–527. [PubMed] [Google Scholar]
- 50.Zhang Y, Xiong Y, Yarbrough WG. ARF promotes MDM2 degradation and stabilizes p53. ARF-INK4a locus deletion impairs both the Rb and p53 tumor suppression pathways. Cell. 1998;92:725–734. doi: 10.1016/s0092-8674(00)81401-4. [DOI] [PubMed] [Google Scholar]
- 51.Tiemann F, Deppert W. Stabilization of the tumor suppressor p53 during cellular transformation by simian virus 40: influence of viral and cellular factors and biological consequences. J Virol. 1994;68:2869–2878. doi: 10.1128/jvi.68.5.2869-2878.1994. [DOI] [PMC free article] [PubMed] [Google Scholar]
- 52.Momand J, Zambetti GP, Olson DC, George D, Levine AJ. The mdm2 Oncogene Product forms a complex with the p53 protein and inhibits p53-mediated transactivation. Cell. 1992;69:1237–1245. doi: 10.1016/0092-8674(92)90644-r. [DOI] [PubMed] [Google Scholar]
- 53.Küpper M, Joos S, von Bonin F, Daus H, Pfreundschuh M, Lichter P, Trümper L. MDM2 gene amplification and lack of p53 point mutations in Hodgkin and Reed-Sternberg cells: results from single-cell polymerase chain reaction and molecular cytogenetic studies. Br J Haematol. 2001;112:768–775. doi: 10.1046/j.1365-2141.2001.02566.x. [DOI] [PubMed] [Google Scholar]
- 54.Bates S, Vousden KH. p53 in signaling checkpoint arrest or apoptosis. Curr Opin Genet Dev. 1996;6:12–18. doi: 10.1016/s0959-437x(96)90004-0. [DOI] [PubMed] [Google Scholar]
- 55.Maggio EM, Stekelenburg E, Van den Berg A, Poppema S. TP53 gene mutations in Hodgkin lymphoma are infrequent and not associated with absence of Epstein-Barr virus. Int J Cancer. 2001;94:60–66. doi: 10.1002/ijc.1438. [DOI] [PubMed] [Google Scholar]
- 56.Montesinos-Rongen M, Roers A, Küppers R, Rajewsky K, Hansmann ML. Mutation of the p53 gene is not a typical feature of Hodgkin and Reed-Sternberg cells in Hodgkin’s disease. Blood. 1999;94:1755–1760. [PubMed] [Google Scholar]
- 57.Elenitoba-Johnson KS, Medeiros LJ, Khorsand J, King TC. P53 expression in Reed-Sternberg cells does not correlate with gene mutations in Hodgkin’s disease. Am J Clin Pathol. 1996;106:728–738. doi: 10.1093/ajcp/106.6.728. [DOI] [PubMed] [Google Scholar]
- 58.Wu X, Bayle HJ, Olson D, Levine AJ. The p53-mdm-2 autoregulatory feedback loop. Genes Dev. 1993;7:1126–1132. doi: 10.1101/gad.7.7a.1126. [DOI] [PubMed] [Google Scholar]
- 59.Oliner JD, Kinzler KW, Meltzer PS, George DL, Vogelstein B. Amplification of a gene encoding a p53-associated protein in human sarcomas. Nature. 1992;358:80–83. doi: 10.1038/358080a0. [DOI] [PubMed] [Google Scholar]
- 60.Keleti J, Quezado MM, Abaza MM, Raffeld M, Tsokos M. The mdm2 oncoprotein is overexpressed in Rhabdomyo-sarcoma cell lines and stabilizes wild-type p53 protein. Am J Pathol. 1996;149:143–150. [PMC free article] [PubMed] [Google Scholar]
- 61.Liu MT, Chang YT, Chen SC, Chuang YC, Chen YR, Lin CS, Chen JY. Epstein-Barr virus latent membrane protein 1 represses p53-mediated DNA repair and transcriptional activity. Oncogene. 2005;24:2635–2646. doi: 10.1038/sj.onc.1208319. [DOI] [PubMed] [Google Scholar]
- 62.Li L, Guo L, Tao Y, Zhou S, Wang Z, Luo W, Hu D, Li Z, Xiao L, Tang M, Yi W, Tsao SW, Cao Y. Latent membrane protein 1 of Epstein-Barr virus regulates p53 phosphorylation through MAP kinases. Cancer Lett. 2007;255:219–231. doi: 10.1016/j.canlet.2007.04.014. [DOI] [PubMed] [Google Scholar]
- 63.Li L, Zhou S, Chen X, Guo L, Li Z, Hu D, Luo X, Ma X, Tang M, Yi W, Tsao SW, Cao Y. The activation of p53 mediated by Epstein-Barr virus latent membrane protein 1 in SV40 large T-antigen transformed cells. FEBS Lett. 2008;582:755–762. doi: 10.1016/j.febslet.2008.01.031. [DOI] [PubMed] [Google Scholar]
- 64.Guenova M, Rassidakis GZ, Gorgoulis VG, Angelopoulou MK, Siakantaris MR, Kanavaros P, Pangalis GA, Kittas C. P16INK4A is regularly expressed in Hodgkin’s disease: comparison with retinoblastoma, p53 and MDM2 protein status, and the presence of Epstein-Barr virus. Mod Pathol. 1999;12:1062–1071. [PubMed] [Google Scholar]
- 65.Shapiro GI, Edwards CD, Kobzik L, Godleski J, Richards W, Sugarbaker DJ, Rollins BJ. Cancer Reciprocal Rb inactivation and p16INK4 expression in primary lung cancers and cell lines. Cancer Res. 1995;55:505–509. [PubMed] [Google Scholar]
- 66.Sakaguchi M, Fujii Y, Hirabayashi H, Yoon HE, Komoto Y, Oue T, Kusafuka T, Okada A, Matsuda H. Inversely correlated expression of p16 and Rb protein in non-small cell lung cancers: an immunohistochemical study. Int J Cancer. 1996;65:442–445. doi: 10.1002/(SICI)1097-0215(19960208)65:4<442::AID-IJC8>3.0.CO;2-X. [DOI] [PubMed] [Google Scholar]