Abstract
Background:
Cancer is a major health problem in the developing countries. Variations of its incidence rate among geographical areas are due to various contributing factors. This study was performed to assess the spatial patterns of cancer incidence in the Fars Province, based on cancer registry data and to determine geographical clusters.
Methods:
In this cross sectional study, the new cases of cancer were recorded from 2001 to 2009. Crude incidence rate was estimated based on age groups and sex in the counties of the Fars Province. Age-standardized incidence rates (ASR) per 100,000 was calculated in each year. Spatial autocorrelation analysis was performed in measuring the geographic patterns and clusters using geographic information system (GIS). Also, comparisons were made between ASRs in each county.
Results:
A total of 28,411 new cases were diagnosed with cancer during 2001-2009 in the Fars Province, 55.5% of which were men. The average age was 61.6 ± 0.5 years. The highest ASR was observed in Shiraz, which is the largest county in Fars. The Moran's Index of cancer was significantly clustered in 2004, 2005, and 2006 in total, men, and women. The type of spatial clustering was high-high cluster, that to indicate from north-west to south-east of Fars Province.
Conclusions:
Analysis of the spatial distribution of cancer shows significant differences from year to year and between different areas. However, a clear spatial autocorrelation is observed, which can be of great interest and importance to researchers for future epidemiological studies, and to policymakers for applying preventive measures.
Keywords: Cancer, Iran, spatial analysis
INTRODUCTION
Today, cancer is one of the most important health problems in the world, causing concerns for healthcare systems. Cancers cause high morbidity and mortality.[1,2] New cases of cancer are ever-increasing worldwide, and more than half of the cases are from low and middle income countries.[3,4] Increased exposure to a variety of risk factors and social inequalities are expected to increase the absolute number of cancer cases and their consequences so that an increase of 35% of new cases is predicted in 2020.[3,4,5]
In developing countries, lack of equal access to healthcare services and community status, adoption of western lifestyle, and increased old age have led that the burden of cancer has changed during recent decades, and Iran is not an exemption from these conditions.[6,7]
Annually, almost 50,000 new cases occur in the Iranian population.[8] Cancer, is the third most common cause of death in Iran after cardiovascular diseases and car accidents.[9,10,11,12] It is estimated that annually 35,000 deaths are due to cancer. Sadjadi et al., report that Iran is the second country based on mortality rate due to cancer in Eastern Mediterranean region of world health organization (WHO).[6]
In order to control and reduce morbidity and mortality of cancer and also to carry epidemiological studies, geographical distribution of cancer should be determined as a first step.[12] Researchers have demonstrated that a strong link exists between health status and areas where people live in.[1,8] The characteristics of an area such as, industrial environment, climate, socioeconomic status, lifestyle, and racial groups have a strong effect on cancer incidence and health outcomes.[1,2,3,8,9]
Geographic information system (GIS) is a computer-based system and a potentially powerful assessment tool to represent health data in a visual format by linking statistical and thematic data on maps. It can play a prominent role in helping public health authorities and policy makers for decision-making and planning in epidemiological studies.[13,14,15,16] A review of published literature shows that many studies have been conducted on cancer assessment by using GIS in countries.[1,2,17,18]
In Iran, most of existing literature in this context is on epidemiological studies that have not used spatiotemporal techniques.[9,11,12,19] Only a few studies have documented evaluation of geographical variation of cancer incidence by applying GIS.[8,20,21]
This article aims to map the cancer incidence in the counties of Fars Province, and also to explore the spatial pattern trends or changes of disease during the years 2001-2009.
METHODS
This study was carried out in Fars Province, which is located in southern Iran and has an area of about 122,400 km2 which is at 27° 31’ to 31° 42’ longitude north and 50° 37, to 55° 38’ latitude east.[22] The total population of Fars is about 4.6 million and male to female ratio is 1.03.[23] The administrative divisions in 2010 included 24 counties. The capital city is Shiraz, one of the metropolises in Iran [Figure 1].
Figure 1.
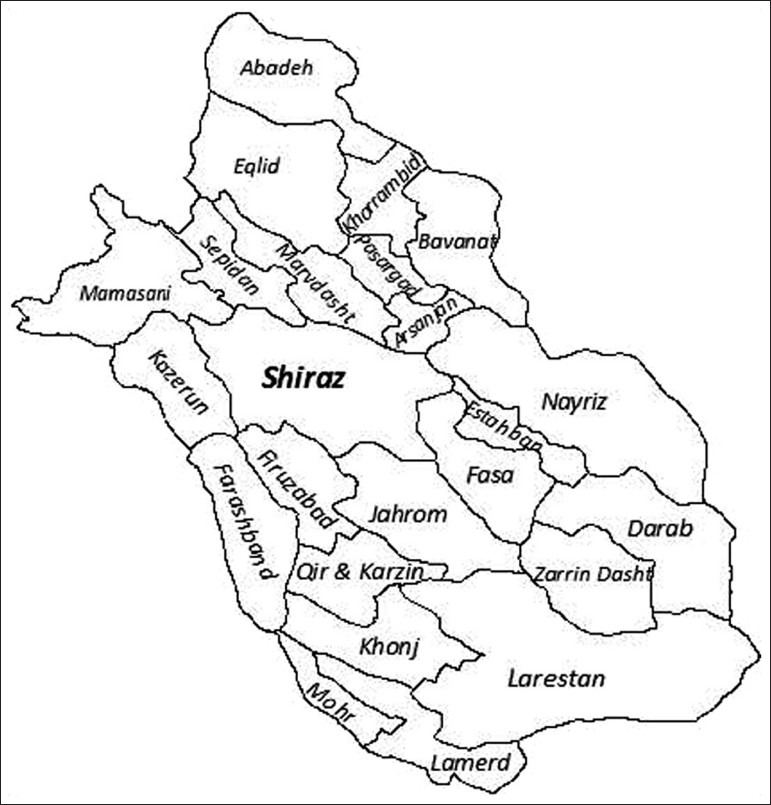
Map of counties of Fars province
In this cross sectional study, we used map data, population distribution derived from census and patient data. The new cases were patients diagnosed with cancer whom are registered between 2001 and 2009 among the study population in the Cancer Registry Center of Shiraz University of Medical Sciences. This center use multiple sources (hospital, diagnostic facilities, and death certification); the data were collected from throughout the Province and then to be set up in Deputy of Health at Shiraz University of Medical Sciences (Cancer Registry office). Also, these were checked by the Ministry of Health, and then to be sent to this center in Shiraz.
The reports were based on pathology laboratories. Data sheet included 33,398 patient names, sex, age at the time of diagnosis, place of residence, and cancer diagnosis that was based on the international classification of disease for oncology (ICD-O).[24] The documents were checked and any duplicates cases with the same information, cases from the other provinces, unclear diagnosis, and uncertain address were excluded. The final data were summarized in another sheet and included 28,411 new cases and consisted of sex, place of residence, types of cancers, and an eight age-group classification.[25]
Crude incidence ratio was calculated for each sex and age groups in counties in each year. Then, to compare different counties, age-standardized rate (ASR) was calculated using standard world population.[26]
The calculated ASRs were transferred to the GIS software (Arc GIS 9.3), and mapping tools of GIS were then used for visualizing ASR for each year.[27]
We also used exploratory spatial data analysis (ESDA) to determine distribution pattern of cancer for each year of data.[28] One of the most frequently used methods is Moran's Index, which evaluates local clustering or spatial autocorrelation by computing the contribution of each location to the Moran's I statistics for the whole study area.[28,29] Moran's I is a weighted correlation coefficient that takes values in the range (−1, 1). If value of Moran's I is a significant positive value, it indicates positive spatial autocorrelation, which means, a distribution pattern for counties having ASR similar to their neighboring counties. A significant negative value is negative spatial autocorrelation, meaning there is no similarity between neighbors.[28,30]
Moreover, we used the local indicators of spatial association (LISAs) measure in positive Moran's I, to identify meaningful spatial clusters (P = 0.05). LISA analysis was typically mapped to indicate counties with similar ASR (High, Low) among various areas.[28,31]
ASR calculation was performed in Microsoft Excel, spatial and temporal analyses were performed using Arc GIS 9.3™ and Geoda 1.0.1™.
RESULTS
A total of 28,411 new cases were diagnosed with cancer in 2001-2009 in Fars, 15,759 (55.5%) of which were men. The average age of cases was 61.6 ± 0.5 year, and it breaks down to 63.8 ± 0.6 for men and 58.8 ± 0.8 for women.
The averages ASR were 102.17 and 82.17 per 100,000 among men and women, respectively. The highest ASR among men was 148.82 per 100,000, observed in 2007, whereas for women, the highest value was 114.80 per 100,000 in 2009 [Figure 2].
Figure 2.
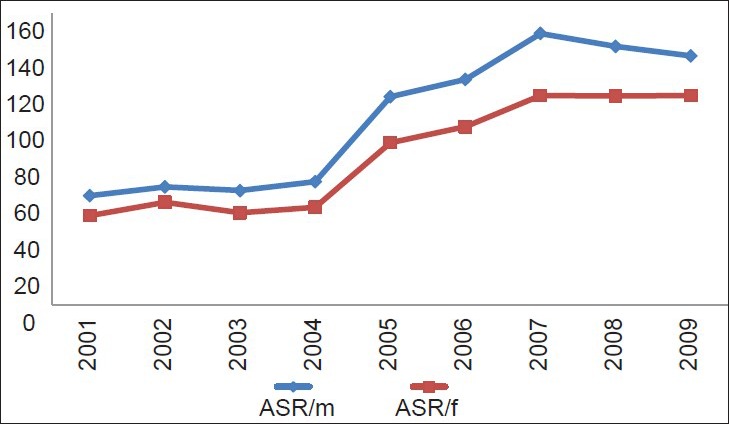
Age-standardized rate in men and women in Fars province, Iran, during 2001-2009
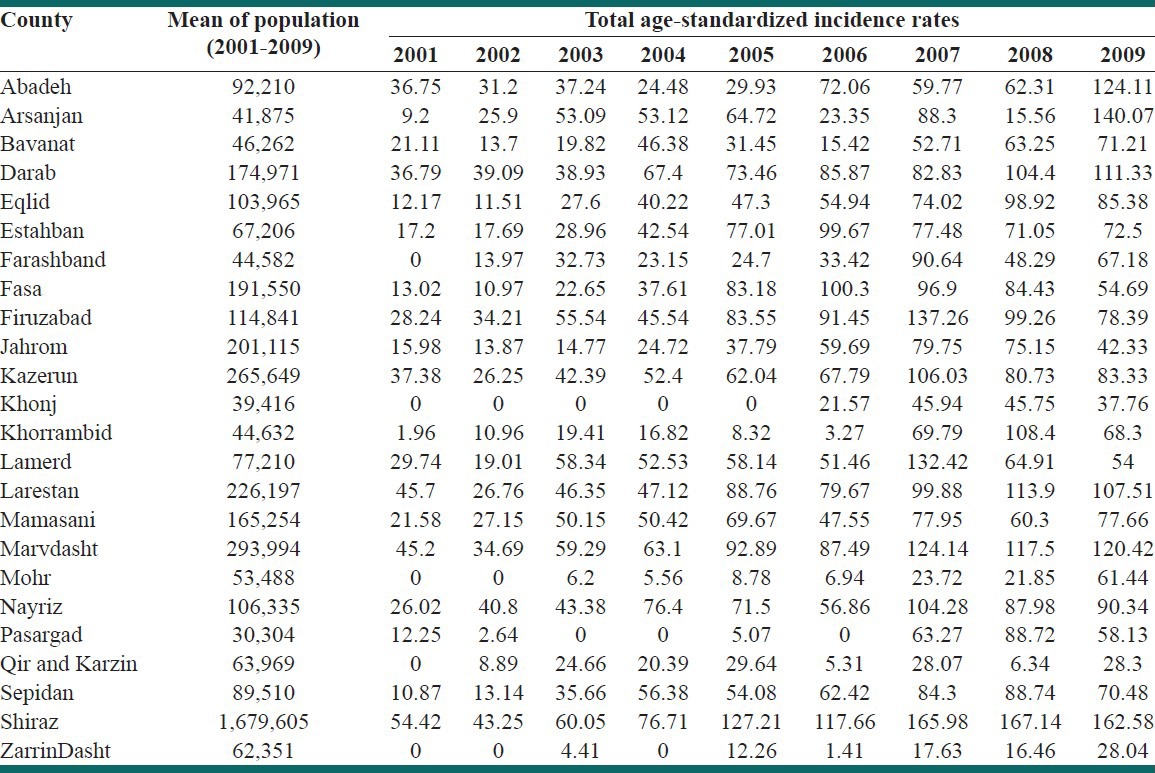
Table 1 shows ASR in counties of Fars province that the highest value is Shiraz among all years.
Table 1.
Age-standardized rate in counties of Fars province, Iran, during 2001-2009
To illustrate the geography of cancer, ASR distribution of the study region is plotted in Figure 3. Darker brown signifies a higher ASR value, and the men to women ratio for cancer is also symbolized in Figure 3. It is clear that in most of the counties, cancer incidence was more in men than women for various years, but the proportion of women has increased in 2009. It can also be observed that ASR showed a much dispersed distribution pattern in 2001 with three areas of high concentration, namely Shiraz, Marvdasht (northern Fars), and Larestan (southern Fars) in the following years (except 2002). The scattering was much less and the proportion of each cities increased, but consistently Shiraz, Marvdasht, and Larestan had a high density in each year. In 2002, ASR decreased throughout the Province.
Figure 3.
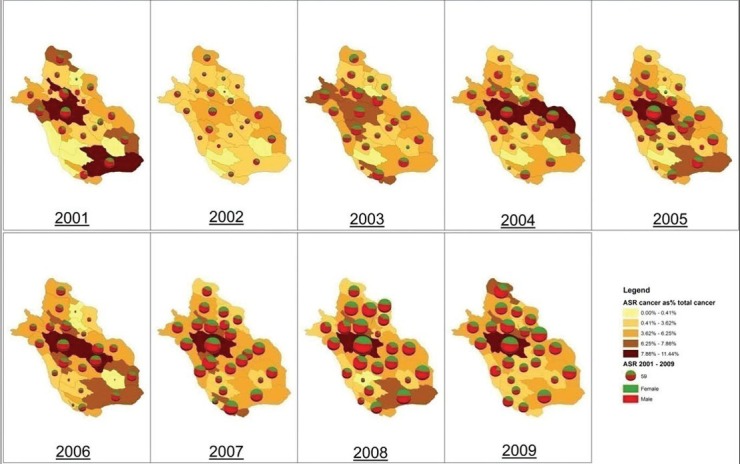
Spatial distribution of cancer in the counties of Fars, during 2001-2009
These findings are supported numerically using Moran's I, shown in Table 2, where it is seen that in 2001 Moran's I is negative, meaning that pattern of cancer incidence was dispersed. The spatial distribution tends to cluster in subsequent years, and Moran's I becomes significant positive for three consecutive years (2004, 2005, and 2006) as shown with the P value. However, Moran's I decreased again and the distribution changed to a clustered pattern in the end of the period.
Table 2.
Moran's index of ASR, 2001.2009 (P=0.05)
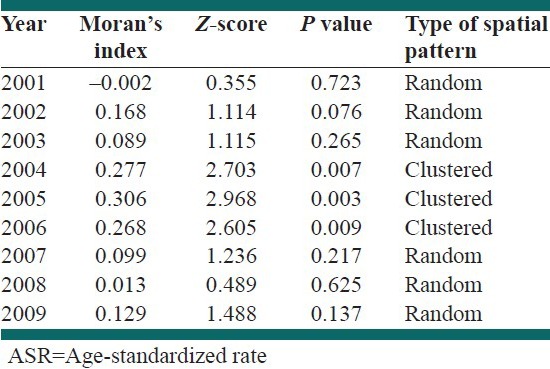
Geoda software was utilized to determine significant spatial clusters in certain years. The findings were showed high-high cluster on Shiraz, Sepidan, Mamasani, Nayriz, Arsanjan, Khorrambid, Bavanat, and ZarrinDasht that represent high ASRs are surrounded by those which also have high ASR.
Figure 4 shows spatial dependency of ASR in the men from 2001 to 2009. Cancer incidence was dispersed in the first year (Moran's I = −0.002 and −0.006) and in 2004, 2005, and 2006 had significant Moran's I and spatial clusters, while distribution pattern of cancer was diffuse in the next years. Counties with similar ASR were geographically closer to one another in the periods of cluster.
Figure 4.
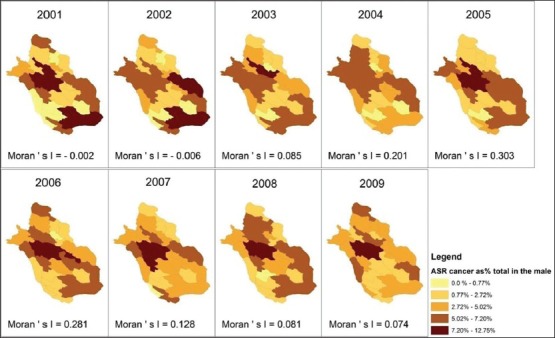
Spatial distribution of cancer in the male, during 2001-2009
Lower incidence of cancer was observed in the women for the period 2001-2003 in the smoothed maps [Figure 5]. The spatial dependency of cancer in women was clustered in 2004, 2005, and 2006 at the significance level of 0.05, so that most of the density was located in Shiraz, Larestan, and their neighboring areas. Similar distribution patterns were observed between counties in the later years.
Figure 5.
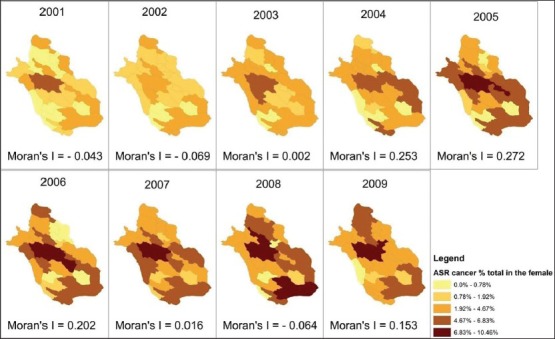
Spatial distribution of cancer in the female, during 2001-2009
DISCUSSION
The overall global burden of cancer is increasing, so that cancer incidence, diagnostic and treatment facilities, and cancer control programs exist differently in various geographic boundaries of the world. Differences in cancer incidence rate were shown in the Iranian population in the recent years.[6] Our study estimated average ASR of 102.17 and 82.17 per 100,000 persons in men and women, respectively, while in comparison with the findings of Masoompour et al., and Mehrabani et al., have increased incidence and age of illness onset.[11,12] Also, the finding is comparable with studies performed in Semnan and Kerman Provinces.[9,19] Sadjadi et al., showed that in Kerman Province, (neighboring Fars Province) ASR was 76 and 68 in men and women, respectively, while our findings showed higher rates.
In 2002 and also some of counties in other times, the obtained low cancer incidence rate was probably due to incomplete registered data (incomplete forms for residence cities of patients). Overall, cancer increase trend in the present study, maybe related to aging of the population. One of the most important contributing factors to increasing cancer occurrence in the world is due to increased life expectancy and aging of the population.[32] Cancer incidence was higher in the men than women, perhaps due to increase the specific cancers in men, or being exposed to identified risk factors such as smoking, using alcohol, occupational carcinogens and other agents.[4,33] The mean age of women who developed cancer was lower compared to men, which can be explained by increasing detection with screening tests (pap smear and breast examination), performed in the health care centers. However, women are more concerned about their health, and as a result they visit physicians relatively more, this might result in an earlier detection of cancer.[34]
ASR of Shiraz and Larestan were higher than neighboring cities during years, that maybe due to lifestyle, exposure to industrial pollution, migration of various races and people and influence of genetic and life traditions. Moreover, some patients may move to large cities in order to have better access to more equipped facilities for diagnostic and treatment measures, which can be considered a confounding agent. Also, lack of proper surveillance systems in some health care centers in the underprivileged and small cities can affect our findings. The level of knowledge and attitude of people about health promotion and preventive activities of chronic diseases like cancer may affect distribution of cancer.
In most of southern regions of Fars with low population density, cancer incidence trend was increasing, and it is expected that, ASR will rise even more in future. Therefore it should be a priority for health policy makers for development and implementation of comprehensive cancer control programs. Epidemiological studies should be considered for determining important roles of climate and geographical condition in cancer incidence. The study was conducted in Trabzon, Turkey (Yomralioglu et al.) showing that incidence of some cancers have been different in various geographical locations.[1]
While epidemiology of cancer incidence using GIS has been well studied in developed countries, it has not received adequate attention in developing countries.
A review of published studies, we did not find cancer study using GIS in Fars Province. The study was conducted to determine clustering of childhood cancer in Tehran, another was to assess pattern of spread of gastrointestinal cancer in the Caspian sea region. These were not comparable with our study.[8,20] The obtained Moran's I in 2004, 2005 and 2006 show that the distribution of cancer was more regular than other years and spatial clusters were found in Shiraz, Sepidan, Mamasani, Nayriz, Arsanjan, Khorrambid, Bavanat and ZarrinDasht. The clustered patterns suggest that contributing factors may be similar in the mentioned counties, which can be surveyed in future epidemiological studies.
GIS can be used effectively for assessment of cancer incidence, in the geographical location and to provide insights for placing control measures. Of course, researchers should consider although maps help to visually evaluate spatial pattern, they have limitations. Wainwright et al., collected cancer data in Maryland, USA, and analyzed effects of different variables such as population, income, unemployment indicator, and urban and rural areas.[35] This is not possible in our study due to lack of access to accurate information such as socioeconomic conditions. This again signifies the need for a better data collection system in developing countries.
CONCLUSIONS
The spatial analysis by GIS is a method that is feasible and helpful in generating hypothesis and identifying areas for intervention. It could be necessary and important for public health policymakers to promote strategies for cancer control and management for infrastructure. Therefore, knowledge of spatial distribution of cancer is expected to provide accurate and easily accessible information for implementation of preventive activities in community health.
Our study showed spatial analysis of cancer incidence and clustered pattern in the Fars province over a period of time. Further studies are needed on the efficiency of GIS, not only to determine etiological agents of cancer but also to help policy makers in management of health promotion.
ACKNOWLEDGMENTS
This article is the result of a research project (2,781). The Vice-Chancellor for research at Shiraz University of Medical Sciences funded this project. This research was performed by Mahbobeh Oroei in partial fulfillment of the requirements for certification as a specialist in community medicine at Shiraz University of Medical Sciences in Shiraz, Iran.
The authors thank Deputy of Health at Shiraz University of Medical Sciences, particularly Mohsen Moghadami and Mahin Farahmand for Collaboration of the Cancer Registry Center, and also the Research Counseling Center of Shiraz Medical School for editing of this article.
Footnotes
Source of Support: Shiraz University of Medical Sciences
Conflict of Interest: None declared.
REFERENCES
- 1.Yomralioglu T, Colak EH, Aydinoglu AC. Geo-relationship between cancer cases and the environment by GIS: A case study of Trabzon in Turkey. Int J Environ Res Public Health. 2009;6:3190–204. doi: 10.3390/ijerph6123190. [DOI] [PMC free article] [PubMed] [Google Scholar]
- 2.Walter SD, Marrett LD, Taylor SM, King D. An analysis of the geographic variation in cancer incidence and its determinants in Ontario. Can J Public Health. 1999;90:104–8. doi: 10.1007/BF03404111. [DOI] [PMC free article] [PubMed] [Google Scholar]
- 3.Merletti F, Galassi C, Spadea T. The socioeconomic determinants of cancer. Environ Health. 2011;10(Suppl 1):S7. doi: 10.1186/1476-069X-10-S1-S7. [DOI] [PMC free article] [PubMed] [Google Scholar]
- 4.Beaulieu N, Bloom D, Bloom R, Stein R. Breakaway: The global burden of cancer-challenges and opportunities. A report from the Economist Intelligence Unit. 2009. [Last accessed on 2013 Jan 27]. Available from: htttp://livestrongblog.org/global economicimpact.pdf .
- 5.WHO: Fight against cancer strategies that prevent, cure and care. 2007. [Last accessed on 2013 Jan 27]. Available from: http://whqlibdoc.who.int/publications/2007/9789241595438_eng.pdf .
- 6.Sadjadi A, Nouraie M, Mohagheghi MA, Mousavi-Jarrahi A, Malekezadeh R, Parkin DM. Cancer occurrence in Iran in 2002, an international perspective. Asian Pac J Cancer Prev. 2005;6:359–63. [PubMed] [Google Scholar]
- 7.Babaei M, Mousavi S, Malek M, Tosi G, Masoumeh Z, Danaei N, et al. Cancer occurrence in Semnan Province, Iran: Results of a population-based cancer registry. Asian Pac J Cancer Prev. 2005;6:159–64. [PubMed] [Google Scholar]
- 8.Mohebbi M, Mahmoodi M, Wolfe R, Nourijelyani K, Mohammad K, Zeraati H, et al. Geographical spread of gastrointestinal tract cancer incidence in the Caspian Sea region of Iran: Spatial analysis of cancer registry data. BMC Cancer. 2008;8:137. doi: 10.1186/1471-2407-8-137. [DOI] [PMC free article] [PubMed] [Google Scholar]
- 9.Cramb SM, Mengersen KL, Baade PD. Developing the atlas of cancer in Queensland: Methodological issues. Int J Health Geogr. 2011;10:9. doi: 10.1186/1476-072X-10-9. [DOI] [PMC free article] [PubMed] [Google Scholar]
- 10.Mousavi SM, Gouya MM, Ramazani R, Davanlou M, Hajsadeghi N, Seddighi Z. Cancer incidence and mortality in Iran. Ann Oncol. 2009;20:556–63. doi: 10.1093/annonc/mdn642. [DOI] [PubMed] [Google Scholar]
- 11.Masoompour SM, Yarmohammadi H, Rezaianzadeh A, Lankarani KB. Cancer incidence in southern Iran, 1998-2002: Results of population-based cancer registry. Cancer Epidemiol. 2011;35:e42–7. doi: 10.1016/j.canep.2011.05.018. [DOI] [PubMed] [Google Scholar]
- 12.Mehrabani D, Tabei S, Heydari ST, Shamsina S, Shokrpour N, Amini M, et al. Cancer occurrence in Fars Province, Southern Iran. Iran Red Crescent Med J. 2008;10:314–22. [Google Scholar]
- 13.Nykiforuk CI, Flaman LM. Geographic Information Systems (GIS) for Heal th Promotion and Public Health: A Review. [Last accessed on 2013 Jan 27];Health Promot Pract. 2011 12:63–73. doi: 10.1177/1524839909334624. Available from: http://hpp.sagepub.com/content/12/1/63.full.pdf+html . [DOI] [PubMed] [Google Scholar]
- 14.Graves BA. Integrative literature review: A review of literature related to geographical information systems, healthcare access, and health outcomes. Perspect Health Inf Manag. 2008;5:11. [PMC free article] [PubMed] [Google Scholar]
- 15.Mousavi-Jarrahi A, Zare M, Sadeghi A. Geographic information systems (GIS), an informative start for challenging process of etiologic investigation of diseases and public health policy making. Cancer Bull Cancer Inst Iran. 2010;2:37–44. [Google Scholar]
- 16.Najafabadi A, Pourhassan M. Integrating the geographic information system into cancer research. Indian J Cancer. 2011;48:105–9. doi: 10.4103/0019-509X.75834. [DOI] [PubMed] [Google Scholar]
- 17.Guajardo OA, Oyana TJ. A critical assessment of geographic clusters of breast and lung cancer incidences among residents living near the Tittabawassee and Saginaw Rivers, Michigan, USA. J Environ Public Health 2009. 2009 doi: 10.1155/2009/316249. 316249. [DOI] [PMC free article] [PubMed] [Google Scholar]
- 18.Han D, Rogerson PA, Nie J, Bonner MR, Vena JE, Vito D, et al. Geographic clustering of residence in early life and subsequent risk of breast cancer (United States) Cancer Causes Control. 2004;15:921–9. doi: 10.1007/s10552-004-1675-y. [DOI] [PubMed] [Google Scholar]
- 19.Sadjadi A, Zahedi M, Nouraie M, Alimohammadian M, Ghorbani A, Bahmanyar S, et al. The first population-based cancer survey in Kerman Province of Iran. Iran J Public Health. 2007;36:26–34. [Google Scholar]
- 20.Mosavi-Jarrahi A, Moini M, Mohagheghi MA, Alebouyeh M, Yazdizadeh B, Shahabian A, et al. Clustering of childhood cancer in the inner city of Tehran metropolitan area: A GIS-based analysis. Int J Hyg Environ Health. 2007;210:113–9. doi: 10.1016/j.ijheh.2006.08.005. [DOI] [PubMed] [Google Scholar]
- 21.Mohebbi M, Wolfe R, Jolley D, Forbes AB, Mahmoodi M, Burton RC. The spatial distribution of esophageal and gastric cancer in Caspian region of Iran: An ecological analysis of diet and socio-economic influences. Int J Health Geogr. 2011;10:13. doi: 10.1186/1476-072X-10-13. [DOI] [PMC free article] [PubMed] [Google Scholar]
- 22.Wikipedia. Fars province. [Last cited on 2012 Apr 6]. Available from: http://en.wikipedia. Org/wiki/Fars_Province .
- 23.Statistical Center of Iran. Selected findings of national population and housing census. 2011. [Last accessed on 2013 Jan 27]. Available from: http://www.amar.org.ir/Portals/1/Iran/data.pdf .
- 24.Fritz A, Percy C, Jack A, Shanmugaratnam K, Sobin L, Parkin DM, et al. 3th ed. Geneva: World Health Organization; 2000. International classification of diseases for oncology: ICD-O. [Google Scholar]
- 25.SEER cancer statistics review 1975-2003. [Last cited on 2012 Apr 6]. Available from: http://seer.cancer.gov/csr/1975_2003/results_merged/topic_age_dist.pdf .
- 26.Ahmad O, Boschi-Pinto C, Lopez A, Murray C, Lozano R, Inoue M. Age standardization of rates: A new WHO standard. GPE Discussion Paper Series: No 31. WHO. 2000. [Last accessed on 2013 Jan 27]. Available from: http://www.who.int/healthinfo/paper31.pdf .
- 27.Brewer CA. Basic mapping principles for visualizing cancer data using Geographic Information Systems (GIS) Am J Prev Med. 2006;30(Suppl 2):S25–36. doi: 10.1016/j.amepre.2005.09.007. [DOI] [PubMed] [Google Scholar]
- 28.Smith MJ, Goodchild MF, Longley PA. 2nd ed. Leicester: Matador; 2007. Geospatial Analysis. [Google Scholar]
- 29.Goovaerts P, Jacquez GM. Accounting for regional background and population size in the detection of spatial clusters and outliers using geostatistical filtering and spatial neutral models: The case of lung cancer in Long Island, New York. Int J Health Geogr. 2004;3:14. doi: 10.1186/1476-072X-3-14. [DOI] [PMC free article] [PubMed] [Google Scholar]
- 30.Avruskin GA, Jacquez GM, Meliker JR, Slotnick MJ, Kaufmann AM, Nriagu JO. Visualization and exploratory analysis of epidemiologic data using a novel space time information system. Int J Health Geogr. 2004;3:26. doi: 10.1186/1476-072X-3-26. [DOI] [PMC free article] [PubMed] [Google Scholar]
- 31.Khamis FG. Measuring the spatial correlation of unemployment in Iraq, 2007. MAS. 2011;6:17. [Google Scholar]
- 32.Ellison LF, Wilkins K. Canadian trends in cancer prevalence. Health Rep. 2012;23:7–16. [PubMed] [Google Scholar]
- 33.Babaei M, Mousavi S, Toussy J. Cancer occurrence in old age: Results of a population-based cancer registry in Semnan, Iran. Asian Pac J Cancer Prev. 2006;7:191–4. [PubMed] [Google Scholar]
- 34.Wallace RB, Kohatsu N, Last JM, Brownson R, Schecter A, Scutchfield FD, et al. 15th ed. USA: McGraw; 2008. Public Health and Preventive Medicine; p. 1367. [Google Scholar]
- 35.Wainwright B, Chen M. Analysis of cancer incidents in the State of Maryland [abstract] AAG Annual meeting. 2012. [Last cited on 2012 Apr 9]. Available from: http://meridian.aag.org/callforpapers/program/AbstractDetail.cfm?AbstractID=47902 .


