

Abstract
The objective of this study was to evaluate whether the global reference curves adapted on the basis of WHO data for India and the Hadlock reference curves fit the population in India and to validate the reference curves. The data were retrieved retrospectively from the records of women registration for antenatal care at a charitable maternity hospital in Mumbai, India. All pregnancies were dated on CRL obtained before 14 weeks. Births before 34th week were excluded. The expected frequencies of birth weights below the 1st, 5th, 10th, 50th, 90th, 95th and 99th centiles from three reference ranges were compared with observed frequencies. It was found that the WHO generic reference adapted to India significantly underpredicted the birth weights and that the Hadlock reference ranges significantly overpredicted the birth weights. The use of generic reference adapted to Sri Lanka showed a better fit to the observed data. We concluded that global reference curves adapted on the basis of WHO data for India and the Hadlock reference ranges do not fit all the population in India and the charts need validation. Reference charts modified on the basis of data for Sri Lankan population show a better fit to the observed data, and therefore are more appropriate for use in clinical practice in South India.
Keywords: Birth weights, reference range, validation
Introduction
Birth weight is dependent on several parameters, the chief being the gestational age at delivery. Of the non-pathological variables, maternal ethnicity, height, and weight, as well as parity are some variables previously shown to influence the birth weight.[1] Definition of small for gestational age baby depends on accurate criteria for expected mean weight and standard deviation. Country of birth is often used as a proxy for ethnicity where the population is ethnically relatively homogeneous.[2,3,4,5] Infants who are small for gestational age, generally defined as having birth weight below the 10th percentile at a particular gestational week, have a higher risk of various adverse outcomes in perinatal period.[6,7,8,9] Creation of a generic reference for fetal weight and birth weight that could be readily adapted to local populations was recently described.[10] The present paper is validation of the reference for birth weights adapted to the local population.
Materials and Methods
Information on maternal demographics [Table 1] was retrieved from pregnancies from women registration for antenatal care at a charitable maternity hospital in Mumbai, India. All pregnancies were dated on crown-rump length obtained before 14 weeks in keeping with accepted NICE guidelines.[11] We excluded all births below the 34th week.
Table 1.
Demographic details of women participating in the study

We used mean birth weight at 40 weeks and the coefficient of variation for India from the 2004-2008 WHO Global Survey on Maternal and Perinatal Health,[10] in order to construct the weight percentiles for the calculation of 5th, 10th, 50th, 90th, and 95th centiles.
Results and Discussion
The mean birth weight at 40 weeks of gestation was 2984 g.
The results of fitting the observed data to Hadlock et al.'s reference range[12] are shown in Figure 1. It is obvious that the centile curves do not fit the observed data distribution. The expected weight is far higher than the observed data.
Figure 1.

Dstribution of birth weights based on centiles from Hadlock et al.
Mikolajczyk et al. reported that the use of Hadlock reference ranges would lead to 60% of newborns in India being classified as small for gestational age. In our study, the use of Hadlock reference ranges led to 47.6% of newborns below the 10th centile and only 1.1% above the 90th centile.
We concluded that the Hadlock reference ranges did not fit our data and significantly overpredicted birth weights.
The data were fitted to WHO global reference range adapted for India, using the weight percentile calculator, and the results are shown in Figure 2.
Figure 2.

Distribution of birth weights using generic reference range adapted for India
The observed distribution of birth weight does not fit the reference range derived from the global reference range adapted to Indian population based on the WHO survey. It identifies approximately one-quarter of all babies to weight above the 90th centile, and therefore was significantly underpredicting birth weights.
The reason for this could be the following:
Mild differences in maternal characteristics as compared to the WHO study which, however, have been shown to play only a minor role in variation of birth weights[13,14]
In the WHO survey, women were included even if the pregnancies were not dated by an early ultrasound scan which may have resulted in inaccuracy of birth weight at 40 weeks. It is well known that women overestimate the gestational age in the absence of early ultrasound dating.[15]
Consequently, we searched for reference ranges of other countries in the WHO generic reference ranges which might fit our data. Sri Lankan population is closer to South Indian in terms of ethnicity and the median maternal weight and the height for Sri Lankan women is 154 cm and 60 kg, respectively. We therefore repeated the exercise with global reference adapted to Sri Lankan population. Table 2 and Figure 3 show the use of generic reference adapted to Sri Lanka for our data. We found that 48.1% were below the 50th centile and 15.9% were above the 90th centile and 12.2% were below the 10th centile. The observed distribution of birth weights fits these reference charts well. The mean birth weight and centiles are more symmetrically distributed.
Table 2.
Use of generic reference adapted to Sri Lanka

Figure 3.
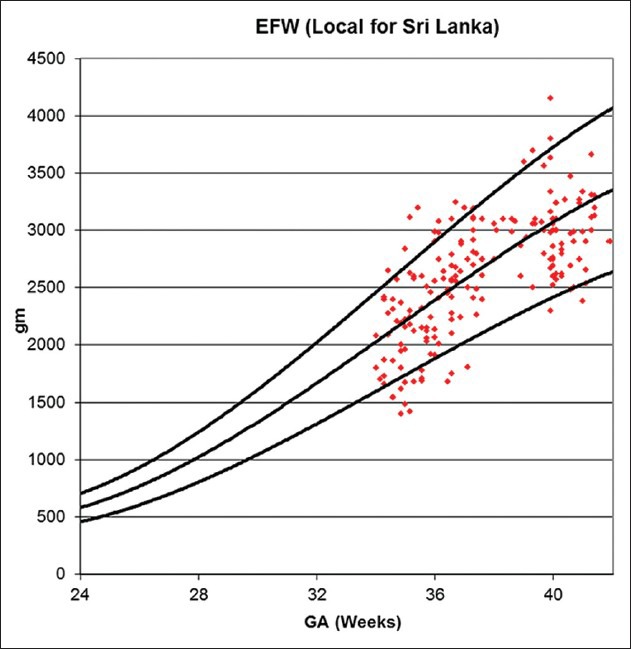
Distribution of birth weights using generic reference range adapted for Sri Lanka
We have shown that global reference curves adapted on the basis of WHO data for India do not fit all the population in India, and the charts need validation. We have also shown that the Hadlock reference curves do not fit all the population in India. Reference charts modified on the basis of data for Sri Lankan population fit our data much better, and therefore are more appropriate to use in clinical practice.
The strength of our study is that all the participants had secure dating in pregnancy by means of an ultrasound scan in the first half of the pregnancy. Weakness of our study includes a relatively modest numbers of participants, and these preliminary results on a small sample size need to be further validated with larger numbers of patients.
Footnotes
Source of Support: Nil
Conflict of Interest: None declared.
References
- 1.Gardosi J, Mongelli M, Wilcox M, Chang A. Chang. An adjustable fetal weight standard. Ultrasound Obstet Gynecol. 1995;6:168–74. doi: 10.1046/j.1469-0705.1995.06030168.x. [DOI] [PubMed] [Google Scholar]
- 2.Dominguez H, Schramm TK, Gislason GH, Norgaard ML, Raunsø J, Abildstrøm SZ, et al. National Background is Associated with Disparities in Initiation and Persistence to Statin Treatment in Subjects with Diabetes in Denmark. Front Pharmacol. 2010;1:142. doi: 10.3389/fphar.2010.00142. [DOI] [PMC free article] [PubMed] [Google Scholar]
- 3.Comstock RD, Castillo EM, Lindsay SP. Four-Year Review of the Use of Race and Ethnicity in Epidemiologic and Public Health Research. Am J Epidemiol. 2004;159:611–9. doi: 10.1093/aje/kwh084. [DOI] [PubMed] [Google Scholar]
- 4.Bhopal R. Oxford: Oxford University Press; 2007. Ethnicity, Race and Health in multicultural societies: Foundations for better epidemiology, public health and healthcare., Chapter: Collecting ethnicity and health data; p. 75. [Google Scholar]
- 5.Gill PS, Bhopal R, Wild S, Kai J. Limitations and potential of country of birth as proxy for ethnic group. BMJ. 2005;330:196. doi: 10.1136/bmj.330.7484.196-a. [DOI] [PMC free article] [PubMed] [Google Scholar]
- 6.Ott WJ. Small for gestational age fetus and neonatal outcome: Reevaluation of the relationship. Am J Perinatol. 1995;12:396–400. doi: 10.1055/s-2007-994506. [DOI] [PubMed] [Google Scholar]
- 7.Sung IK, Vohr B, Oh W. Growth and neurodevelopmental outcome of very low birth weight infants with intrauterine growth retardation: Comparison with control subjects matched by birth weight and gestational age. J Pediatr. 1993;123:618–24. doi: 10.1016/s0022-3476(05)80965-5. [DOI] [PubMed] [Google Scholar]
- 8.Doctor BA, O’Riordan MA, Kirchner HL, Shah D, Hack M. Perinatal correlates and neonatal outcomes of small for gestational age infants born at term gestation. Am J Obstet Gynecol. 2001;185:652–9. doi: 10.1067/mob.2001.116749. [DOI] [PubMed] [Google Scholar]
- 9.Smedler AC, Faxelius G, Bremme K, Lagerstrom M. Psychological development in children born with very low birth weight after severe intrauterine growth retardation: A 10-year follow-up study. Acta Paediatr. 1992;81:197–203. doi: 10.1111/j.1651-2227.1992.tb12203.x. [DOI] [PubMed] [Google Scholar]
- 10.Mikolajczyk RT, Zhang J, Betran AP, Souza JP, Mori R, Gulmezoglu AM, et al. A global reference for fetal-weight and birthweight percentiles. Lancet. 2011;377:1855–61. doi: 10.1016/S0140-6736(11)60364-4. [DOI] [PubMed] [Google Scholar]
- 11.Antenatal care Routine care for the healthy pregnant woman. Clinical Guideline 6. National Institute of Clinical Excellence. 2003. www.nice.org.uk .
- 12.Hadlock F, Harrist R, Martinez-Poyer J. In Utero Analysis ofFetal Growth: A Sonographic Weight Standard’. Radiology. 1991;181:129–33. doi: 10.1148/radiology.181.1.1887021. [DOI] [PubMed] [Google Scholar]
- 13.Hutcheon JA, Zhang X, Cnattingius S, Kramer MS, Platt RW. Customised birthweight percentiles: Does adjusting for maternal characteristics matter? BJOG. 2008;115:1397–404. doi: 10.1111/j.1471-0528.2008.01870.x. [DOI] [PubMed] [Google Scholar]
- 14.Hutcheon JA, Zhang X, Platt RW, Cnattingius S, Kramer MS. The case against customised birthweight standards. Paediatr Perinat Epidemiol. 2011;25:11–6. doi: 10.1111/j.1365-3016.2010.01155.x. [DOI] [PubMed] [Google Scholar]
- 15.Taipale P, Hiilsemaa V. Predicting Delivery Date by Ultrasound and Last Menstrual Period in Early Gestation. Obstet Gynecol. 2001;97:189–94. doi: 10.1016/s0029-7844(00)01131-5. [DOI] [PubMed] [Google Scholar]