

Abstract
Antipsychotic drugs require a treatment regimen of several weeks before clinical efficacy is achieved in patient populations. While the biochemical mechanisms underlying the delayed temporal profile remain unclear, molecular adaptations in specific neuroanatomical loci are likely involved. Haloperidol-induced changes in gene expression in various brain regions have been observed; however, alterations in distinct neuronal populations have remained elusive. The present study examined changes in gene expression profiles of ventral tegmental area (VTA) and substantia nigra (SN) tyrosine hydroxylase immunopositive neurons following 1, 10 or 21 days of haloperidol administration (0.5 mg/kg/day). Macroarrays were used to study the expression of receptors, signaling proteins, transcription factors and pre- and post-synaptic proteins. Data were analyzed using conventional statistical procedures as well as self-organizing maps (SOM) to elucidate conserved patterns of expression changes. Results show statistically significant haloperidol-induced and time-dependent alterations in 17 genes in the VTA and 25 genes in the SN, including glutamate and GABA receptor subunits, signaling proteins and transcription factors. SOMs revealed distinct patterns of gene expression changes in response to haloperidol. Understanding how gene expression is altered over a clinically relevant time course of haloperidol administration may provide insight into the development of antipsychotic efficacy as well as the underlying pathology of schizophrenia.
Keywords: glutamate receptors, haloperidol, laser capture microdissection, single cell gene expression, substantia nigra, ventral tegmental area
Antipsychotic medications are effective in the attenuation/alleviation of certain symptoms associated with schizophrenia, but their precise molecular mechanisms of action have remained elusive. For typical antipsychotics such as haloperidol, the effects are primarily associated with antagonism of the D2 dopamine (DA) receptors (Creese et al. 1976; Seeman et al. 1976). The antipsychotic effects of haloperidol appear to be related to alterations in the function of the mesocorticolimbic dopamine system, whereas extrapyramidal side-effects are thought to involve dysregulation of the nigrostriatal dopamine system (Baldessarini 1979a,b; Baldessarini and Tarsy 1980; Chiodo and Bunney 1983; Yamamoto et al. 1994; Grace et al. 1997). While the sites of action associated with the therapeutic effects of haloperidol are well documented, the biological mechanisms mediating the temporal delay (approximately 3 weeks) between initial drug administration and attenuation of schizophrenic symptoms have received less attention (Crane 1973; Cotes et al. 1978; Hyman and Nestler 1996; Grace et al. 1997). In rodents, chronic (21 days), but not acute haloperidol administration has been shown to induce depolarization block of both the ventral tegmental area (VTA) and substantia nigra (SN) DA neurons (Chiodo and Bunney 1983; Grace 1992; Grace et al. 1997), paralleling the time course of antipsychotic effects in humans. Currently, the molecular events associated with the delayed time course of efficacy have not been determined. However, the changes likely involve adaptations in the molecular phenotype of neurons in specific brain regions, for example midbrain dopamine neurons. Understanding the temporal profile of effects of antipsychotic treatment on VTA and SN DA neurons within a clinically relevant time course may shed light on the neuroadaptive changes that underlie efficacy, and could lead to the identification of novel targets for pharmacotherapeutic development.
Numerous studies in the literature have examined the effects of chronic haloperidol treatment on gene expression in brain regions receiving midbrain dopaminergic input, such as the nucleus accumbens (NAc), prefrontal cortex (PFC) and striatum (Konradi and Heckers 2001). There is currently no consensus on the effect of haloperidol on striatal D2 mRNA levels (Srivastava et al. 1990; Matsunaga et al. 1991; Laruelle et al. 1992; Egan et al. 1994; Fox et al. 1994; Jaber et al. 1994). Similarly, neither D1 nor D3 receptor in striatum were altered by chronic haloperidol administration (Fox et al. 1994; Jaber et al. 1994; Hurley et al. 1996; Petersen et al. 2000). Based on emerging hypotheses regarding the involvement of glutamate dysregulation in schizophrenia (Carlsson et al. 1999; Goff and Coyle 2001), ionotropic glutamate receptor subunits have also been examined. In striatum, NMDA receptor subunits GRIN1, GRIN2A, GRIN2B and GRIN2C mRNAs were up-regulated following chronic (21 days) haloperidol treatment (Riva et al. 1997), whereas AMPA subunits GRIA1, GRIA2 and GRIA3 were not affected in either the NAc or striatum (Tascedda et al. 1999). In contrast, GRIA2 and GRIA4 mRNAs were reportedly decreased in PFC and striatum after 14 days of haloperidol (Healy and Meador-Woodruff 1997). Discrepancies in the literature are likely due to different treatment regimens, brain regions studied and the method of assessment.
Previous studies have provided valuable insight into the effects of haloperidol administration on gene expression; however, a number of questions remain. First, how do changes in gene expression develop over time? Second, what are the effects of haloperidol administration on gene expression in discrete neuronal populations? Third, because antipsychotic administration likely induces co-ordinate changes in gene expression, how does haloperidol administration regulate the expression of multiple transcripts? Methods such as in situ hybridization allow the analysis of a given mRNA in specific neuronal populations, yet the sensitivity does not allow for the analysis of low abundant mRNAs or the means to evaluate numerous transcripts within the same tissue section. Alternatively, reliance on regional assessment of gene expression emphasizes the majority of neuronal and glial populations and/or transcripts in highest abundance in the region, which may not adequately reflect alterations in gene expression in target neuronal populations. Single cell gene expression methodology combined with cDNA macro-array technology allows precise localization and assessment of co-ordinate changes in gene expression within specific neuronal populations in the brain (Ginsberg et al. 2000; Zhao et al. 2001; Hemby et al. 2002, 2003).
Whereas studies of haloperidol-induced alterations in gene expression have focused on brain regions receiving dopaminergic input, changes in VTA and SN DA neurons themselves have received considerably less attention. The DA neurons of the VTA and SN are known to be affected by haloperidol administration, and disruption of the functional integrity of these neurons may contribute to the aberrant behaviors associated with schizophrenia, making them excellent candidates for probing gene expression alterations associated with chronic antipsychotic administration. Following haloperidol administration (1, 10 or 21 days), the expression of 93 genes was evaluated in VTA and SN tyrosine hydroxylase (TH) immunopositive neurons and compared with controls. Results reveal haloperidol-induced and time-dependent alterations in functional classes of transcripts including receptors, signaling proteins and transcription factors. Computational analyses were used to determine statistical significance, and to partition the data into groups of genes with similar expression patterns to facilitate interpretation of these data.
Experimental procedures
Subjects
Male Sprague-Dawley rats (60–90 days; 225–275 g; Charles River, Wilmington, MA, USA) were used for this study. Rats were housed two per cage, maintained on a standard 12/12 h light-dark cycle, with food and water were available ad libitum. Rats were handled (5 min/day) for 3 days prior to experimentation to acclimate them to handling and the injection procedure. The health of the rats was monitored daily by the experimenter and weekly by the institutional veterinarians according to the guidelines issued by the Emory University Animal Care and Use Committee and the National Institutes of Health. All protocols were approved by the Emory University Animal Care and Use Committee.
Drug treatment
Haloperidol (Sigma, St. Louis, MO, USA) was prepared fresh daily in 0.3% tartaric acid at a concentration of 0.5 mg/mL. Subcutaneous injections of haloperidol (0.5 mg/kg/mL) or vehicle were administered daily in 1.0 mL/kg between 09:30 and 11:00 hours. Haloperidol treatment continued for one (n = 10), 10 (n = 10) or 21 (n = 7) consecutive days. Control groups consisted of vehicle administration for one (n = 8) and 21 days (n = 4). The dose of haloperidol used in the present study has been shown to affect DA cell physiology (Chiodo and Bunney 1983, 1987; Grace et al. 1997), neurochemical measures of DA release (Moghaddam and Bunney 1990; Gardner et al. 1994; Yamamoto et al. 1994), molecular biological indices (de Souza and Meredith 1999) and behavior (Boye and Rompre 2000).
Tissue preparation and immunocytochemistry
Twenty-five hours after the final injection, rats were killed with CO2 and transcardially perfused with 4% paraformaldehyde. Brains were removed, placed in a brain matrix, and 3 mm coronal blocks were taken from the rostral to the caudal portion of the brain. The blocks were placed in cassettes, post-fixed in 4% paraformaldehyde for 1 h and then transferred to 70% ethanol for 2 h. All blocks were then placed in a Tissue Tek VIP5 vacuum infiltration processor (Torrance, CA, USA) and processed in increasing concentrations of ethanol: 70% (30 min at 40°C), 80% (30 min at 40°C), twice in 95% (45 min at 40°C), twice in 100% (45 min at 40°C); then twice in xylenes (45 min at 40°C) and four times in paraffin (Paraplast, SPI Supplies, West Chester, PA, USA; 30 min at 58°C). Afterwards, tissue was transferred from the tissue processor to a Tissue Tek TEC tissue embedding console. Each cassette containing processed tissue was transferred to an orientation platform (58°C); the tissue was removed, placed in a base mold, paraffin was dispensed into the mold containing the tissue, then the top of the cassette was placed on top of the base mold and moved onto the chiller (3°C) to solidify the tissue block.
Blocks containing the midbrain were sectioned at 8 μm. Representative sections were stained with acridine orange to verify the presence of nucleic acids (data not shown). To identify individual neurons for subsequent single cell analysis, immunocytochemistry was performed using a modification of a previously described method (Fend et al. 1999). Briefly, sections were deparaffinized in ascending ethanol concentrations (15 s: 70%, 80% and 95%; 30 s: 2 × 100%) followed by xylenes (2 × 1 min) and RNase-free water (22°C for 5 min). Next, sections were immersed in Tris buffer (0.1 M, pH = 7.4) for 2 min at 22°C, and then incubated in primary monoclonal antibody against TH (Sigma T-1209, 1 : 1000) for 15 min at 22°C in 0.1 M Tris buffer (pH = 7.4). An adjacent section was immunostained with the TH antibody and counterstained with hematoxylin for archival purposes. Sections were rinsed with 0.1 M Tris buffer (pH = 7.4) and incubated with a horse anti-mouse secondary antibody for 10 min at 22°C in 0.1 M Tris buffer (pH = 7.4), followed by a rinse with Tris buffer as noted above. Next, the conjugate was labeled, using the avidin-biotin method (ABC Vectastain; Vector Laboratories, Burlingame, CA, USA), for 10 min at 22°C in 0.1 M Tris buffer (pH = 7.4), followed by a rinse with Tris buffer as described. Immunolabeling was visualized with 3,5′-diaminobenzidine. Afterwards, sections were rinsed in RNase-free water for 5 min and dehydrated in ascending ethanol concentrations (15 s each in 70%, 80%, 95% and 100%) and xylenes for 5 min. Sections were air-dried and TH-immunopositive cells were microdissected using laser capture microscopy (Pixcell II, Arcturus, Inc., Mountain View, CA, USA). Laser dissection parameters were as follows: diameter: 7 μm; power: 40–100 mW, duration: 400–1200 μs.
Approximately 200 TH immunopositive cells were laser capture microdissected (LCM) from the VTA (−5.3 to −5.8 mm caudal to bregma, ventral to the red nucleus and dorsomedial to the medial lemniscus) and the SN (−5.3 to −5.8 mm caudal to bregma, lateral to the medial lemniscus and limited to the dorsal and lateral aspects of the pars compacta (Paxinos and Watson 1998), respectively (Fig. 1). Anatomical matching of samples was accomplished by identifying anatomical landmarks with the stereotaxic boundaries of Paxinos and Watson atlas (Paxinos and Watson 1998) following immunostaining but prior to LCM. In addition, all sections used for LCM were archived and re-verified prior to RNA isolation and amplification. For each rat, TH-positive neurons dissected from the VTA were pooled into one sample, and neurons dissected from the SN were pooled into another. Cells close to the boundary between these two regions were not dissected to ensure anatomical distinction between regions. After completion of cell dissection from one region, the cap was removed and placed on a CapSure Pad (Arcturus, Inc.) to remove excess tissue.
Fig. 1.
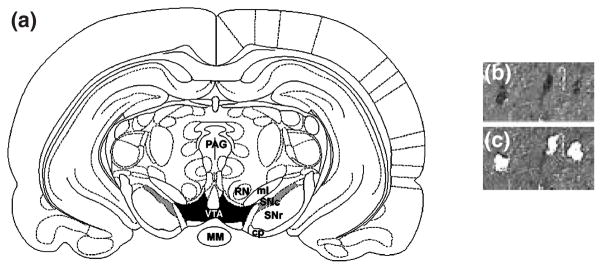
(a) Schematic of regions used for laser capture microdissection. Rat coronal midbrain section at −5.30 mm (relative to Bregma) showing boundaries for VTA (shaded in black) and SN (shaded in gray) from which tyrosine hydroxylase immunopositive cells were dissected. Midbrain section immunolabeled with anti-TH antibody (b) and the same section after microdissection of the indicated neurons (c) under 20× magnification. Abbreviations: MM = mammillary nucleus; PAG = periaqueductal gray area; SNc = substantia nigra – pars compacta; SNr = substantia nigra – pars reticulata; RN = red nucleus; ml = medial lemniscus; cp = cerebral peduncle; VTA = ventral tegmental area.
RNA extraction and amplification
Each cap was secured to the top of a 0.5 mL Eppendorf microcentrifuge tube containing 200 μL Trizol reagent (Gibco BRL, Rockville, MD, USA). The tube was inverted, vortexed and incubated at room temperature for 15 min. RNA was then extracted with phenol/chloroform and precipitated with ethanol in the presence of 0.5 μg yeast tRNA. Following extraction, a 66 base pair oligo(dT)-T7-primer/promoter [AAACGACGGCCAGTGAAT-TGTAATACGACTCACTATAGGCGC(T)24] was hybridized to poly(A +) mRNA for 7 min at 70°C, then quick cooled on ice for 5 min. Complimentary DNA (cDNA) was synthesized using reverse transcriptase (Superscript II, RNase H-; Invitrogen, Carlsbad, CA, USA) in 1× reverse transcriptase buffer containing 7 mM dithiothreitol (DTT), 250 μM each of dATP, dCTP, dGTP and TTP, and 0.12 U/μL of RNAsin, and incubated at 42°C for 90 min.
The amplification and re-amplification procedures are described in detail elsewhere (Eberwine et al. 1992; Ginsberg et al. 2000; Hemby et al. 2002, 2003). During the second round of amplification, 33P-UTP was incorporated into each sample. Under optimal conditions, the first round of aRNA amplification results in an approximately 1000-fold yield and two rounds of amplification result in approximately 106-fold increase over the original amount of each poly(A +) mRNA. The aRNA procedure is a linear amplification process with minimal change in the relative abundance of the mRNA population in the native state of the neuron. mRNA can be reliably amplified from small amounts of fixed tissue, including individual neurons (Ginsberg et al. 1999, 2000; Luo et al. 1999; Hasenkamp and Hemby 2002; Hemby et al. 2002, 2003; Kamme et al. 2003; Kamme and Erlander 2003; Tang et al. 2003).
Construction of candidate macroarrays
Reverse northern blots were prepared on nylon membranes and contained dopamine receptor subtypes, ionotropic glutamate and GABA-A receptor subunits, G-protein subunits, transcription factors, calcium binding proteins, as well as pre-synaptic and post-synaptic density proteins (see Table 1 for full list of genes). Inserts were amplified in 96-well plates using polymerase chain reaction (PCR) with GF200 primers under the following conditions: 95°C for 5 min (1 cycle); 95°C for 20 s, 55°C for 20 s, and 72°C for 2 min (40 cycles); and 72°C for 7 min (1 cycle). Aliquots of PCR samples were electrophoresed on a 1% agarose gel (1× Tris-Acetic Acid-EDTA, 0.05% ethidium bromide) at 5 V/cm for PCR band size verification. Gel images were captured by digital camera and archived. PCR product concentration was determined by spectrofluorometry (Molecular Devices, Gemini, Sunnyvale, CA, USA) using a 1 : 5000 dilution of SYBR 1 Green/Tris-EDTA and an aliquot of the PCR product. Values were compared with concentrations of known DNA standards for quantitation. Approximately 700 ng of each amplified insert was spotted on Nytran SuPerCharge ® nylon transfer membrane (Schleicher and Schuell, Riviera Beach, FL, USA) using a 96-well dot blot apparatus (Schleicher and Schuell; Minifold I). DNA was crosslinked to the membrane by ultraviolet irradiation at 120 mJ/cm2.
Table 1.
Statistical analysis of gene expression profiles for VTA and SN dopamine neurons following haloperidol administration
| Gene class | Main effect
|
Interaction
|
Post hoc analysis
|
|||||||
|---|---|---|---|---|---|---|---|---|---|---|
| VTA
|
SN
|
|||||||||
| VTA | SN | VTA | SN | Day 1 (n = 10) | Day 10 (n = 10) | Day 21 (n = 6) | Day 1 (n = 10) | Day 10 (n = 10) | Day 21 (n = 7) | |
| Glutamate receptors | < 0.001 | < 0.001 | < 0.001 | < 0.001 | ||||||
| GRM1a (encoding mGluR1a) | a′ | a′ | a′ | a | ||||||
| GRM3 (encoding mGluR3) | ||||||||||
| GRM4 (encoding mGluR4) | ||||||||||
| GRM5 (encoding mGluR5) | ||||||||||
| GRIN1 (encoding NMDAR1) | b | |||||||||
| GRIN2A (encoding NMDAR2A) | ||||||||||
| GRIN2B (encoding NMDAR2B) | ||||||||||
| GRIN2C (encoding NMDAR2C) | a′ | b′ | b′ | a′ | ||||||
| GRIN2D (encoding NMDAR2D) | ||||||||||
| GRIA1 (encoding GluR1) | a′ | a′,b | a,b | a′ | a′,b′ | a,b′ | ||||
| GRIA2 (encoding GluR2) | ||||||||||
| GRIA3 (encoding GluR3) | a′ | a′,b | b′ | a′ | a,b′ | b′ | ||||
| GRIA4 (encoding GluR4) | a′ | a′,b | a′ | a′ | a′,b′ | a′,b′ | ||||
| GRIK1 (encoding GluR5) | ||||||||||
| GRIK2 (encoding GluR6) | ||||||||||
| GRIK3 (encoding GluR7) | ||||||||||
| GRIK4 (encoding KA1) | a′ | a′ | b′,c′ | a′ | a′,b′ | a′,b′c | ||||
| GRIK5 (encoding KA2) | b,c | |||||||||
| GRID1 (encoding GluRδ1) | ||||||||||
| GRID2 (encoding GluRδ2) | ||||||||||
| GABA transcripts | < 0.001 | 0.286 | < 0.001 | < 0.001 | ||||||
| GABA-A subunit α1 | a′ | b′ | b′ | b | ||||||
| GABA-A subunit α3 | ||||||||||
| GABA-A subunit α4 | ||||||||||
| GABA-A subunit α6 | ||||||||||
| GABA-A subunit β1 | a′ | b | b′ | b | ||||||
| GABA-A subunit β2 | ||||||||||
| GABA-A subunit β3 | ||||||||||
| GABA-A subunit γ1 | ||||||||||
| GABA-A subunit γ2 | a′ | b′ | b | a′ | b′ | b′ | ||||
| GABA-A subunit γ3 | ||||||||||
| GABA-A subunit δ | ||||||||||
| GABA-A subunit ε | ||||||||||
| GAD 65 | a′ | a′,b′ | a′,b′ | a′ | b′ | a′,c′ | ||||
| GAD 67 | ||||||||||
| Dopamine transcripts | 0.005 | 0.002 | 0.531 | 0.137 | ||||||
| D1 receptor | ||||||||||
| D2 receptor | ||||||||||
| D3 receptor | ||||||||||
| D4 receptor | ||||||||||
| D1b receptor | ||||||||||
| Dopamine transporter | ||||||||||
| G-protein subunits | 0.031 | 0.030 | 0.011 | < 0.001 | ||||||
| Gαi1 | ||||||||||
| Gαi2 | a′ | b′ | b′ | a′ | b′ | a′,c′ | ||||
| Gαi3 | ||||||||||
| Gαs | ||||||||||
| Gαo | b | |||||||||
| Gαz | ||||||||||
| Gαq | ||||||||||
| Gα15 | ||||||||||
| Gβ1 | ||||||||||
| Gβ2 | ||||||||||
| Gβ3 | ||||||||||
| Gγ5 | ||||||||||
| GralA | ||||||||||
| GralB | ||||||||||
| Signal transduction | < 0.001 | 0.005 | < 0.001 | < 0.001 | ||||||
| AC3 | ||||||||||
| AC5 | ||||||||||
| GRK4 | ||||||||||
| GRK5 | ||||||||||
| PKAR1A | ||||||||||
| PKAR1B | ||||||||||
| PKAR2B | a′ | a′,b′ | a′,b′c | a′ | a′,b′ | b′ | ||||
| PP1Cα | ||||||||||
| PP1Cβ | ||||||||||
| PP2Cα | a′ | b′ | b′ | b′ | b′ | |||||
| PP1γ | ||||||||||
| PP2β | ||||||||||
| PLD | a | b | ||||||||
| CaMKIIα | a′ | a,b′ | b′ | a′ | b′ | b′ | ||||
| CaMKIIβ3 | ||||||||||
| CaMKIIδ | ||||||||||
| CaMKIIγ | ||||||||||
| CaMKIV | ||||||||||
| CaMKKα | ||||||||||
| Synaptic proteins | < 0.001 | < 0.001 | 0.428 | 0.013 | ||||||
| SYNJN II | ||||||||||
| SYNTX 5 | ||||||||||
| SYNBREV 2 | ||||||||||
| AMPAbp | a′ | b′ | b′ | |||||||
| spectrin | a | |||||||||
| nNOS | c | |||||||||
| citron | a | |||||||||
| CRIPT | a′ | a′ | a′ | |||||||
| homer1C | ||||||||||
| PSD-95 | ||||||||||
| SAPAP | ||||||||||
| GRIP1 | ||||||||||
| AKAP | ||||||||||
| Transcription factors | 0.570 | 0.033 | < 0.001 | < 0.001 | ||||||
| TFstat5b | ||||||||||
| RLZF-Y | a | b′ | b′ | |||||||
| CREB | a′ | b′ | b | a′ | a′,b′ | a,b′ | ||||
| Miscellaneous | 0.689 | 0.350 | 0.940 | 0.342 | ||||||
| pCCK | ||||||||||
| CART | ||||||||||
| BDNF | ||||||||||
| CNBR1 | ||||||||||
Full gene names are listed in the results section, unless otherwise noted. a: significantly different from control values, b: significantly different from values at day 1, c: significantly different from values at day 10. Double prime: p < 0.001, single prime: p < 0.01, no prime: p < 0.05.
Macroarrays were pre-hybridized with UltraHyb solution (Ambion, Austin, TX, USA) in hybridization bottles for 1 h at 42°C. Next, 33P-labeled aRNA probes from each region for each subject were heat denatured for 5 min at 70°C, placed on ice for 5 min and hybridized to their respective arrays overnight at 42°C in a rotisserie hybridization oven. Samples from the VTA and SN of each rat were hybridized to separate macroarrays and were not pooled within groups. Following hybridization, membranes were washed once with 2× sodium saline citrate (SSC)/0.1% sodium dodecyl sulfate (SDS) and once with 0.1× SSC/0.1% SDS for 20 min each at 42°C. Labeled hybridized products were detected using phosphoimager cassettes, and hybridization signal intensities were analyzed using ImageQuant software (Amersham Biosciences, Sunnyvale, CA, USA).
Data analysis
Densitometry values (hybridization intensities) were obtained for each clone and for background (non-specific) hybridization on the array. Background hybridization values were obtained from spots on the macroarrays in which no clone was loaded, as well as regions between spotted clones. Only clones with spot symmetry and lack of significant artifactual signal intensity as assessed by visual identification were accepted for analysis. The background value for each macroarray was subtracted from the net densitometry value for each clone on that array, and any resultant negative values were set to zero. This ‘signal – background’ value was then divided by the summed values for all of the clones on the array (global normalization) to yield a normalized value for each clone, thereby minimizing variations due to differences in the specific activity of the probe and the absolute quantity of probe present (Ginsberg et al. 2000; Hasenkamp and Hemby 2002; Hemby et al. 2002, 2003; Tang et al. 2003). Array data for functional classes of genes in each region (VTA and SN) were analyzed using a two way ANOVA with Time and Transcript as the fixed effects and normalized hybridization intensity as the dependent measure. Post hoc analyses were conducted as needed using Tukey’s test and the null hypothesis was rejected when p < 0.05.
In addition, SOM clustering (GeneCluster 1.0, Whitehead Institute, Center for Genome Research, Massachusetts Institute of Technology; http://www.genome.wi.mit.edu/cancer/software/software.html) was employed to elucidate common patterns of expression over time. SOM clustering is a data mining and visualization method originally developed by Kohenen (Kohonen 1990, 2000) and applied to the analysis of gene expression data from microarrays (Tamayo et al. 1999; Toronen et al. 1999). The clustering method is similar to k-means clustering (Kaech et al. 2002) but differs in that genes are divided into groups based on expression patterns, and relationships between groups are illustrated by two-dimensional maps.
The values used for SOM analysis were the mean expression levels for each of the 93 genes at each of the four time points (vehicle to represent baseline, 1 day, 10 day, 21 day) in each region. VTA and SN data were combined into one data set that contained 186 genes and passed through a variation filter, eliminating genes that did not show a relative change across time of 1.05 (5%) or 1000 absolute units. The resulting filtered data set contained 176 genes. For each gene, the mean of the values across time was normalized to zero with a standard deviation of one. Therefore, values at each time point were scaled with respect to zero such that the majority of values fell between −2 and 2. This normalization enables the examination of the shape of expression patterns rather than the absolute levels of expression (Tamayo et al. 1999). Parameters for SOM clustering were as follows: 3 rows × 4 columns, epochs = 50, seeds = 1, initialization = random vectors, neighborhood = bubbubble, alphai = 0.4, sigmai = 2, alphaf = 0.005, sigmaf = 0.2. The 3 × 4 grid was chosen empirically, based on the finding that larger grids yielded multiple clusters that were redundant, whereas smaller grids exhibited high error rates and included genes in cluster patterns that were not accurate.
Results
Custom-designed macroarrays containing 93 cDNAs were used to evaluate gene expression in TH immunopositive cells of the VTA and SN of rats following a time course of haloperidol administration. While limited in scope compared with high density arrays, the macroarrays contained a variety of transcripts including glutamate receptor subunits (n = 20), dopamine receptors and transporter (n = 6), GABA transcripts (n = 14), G-protein subunits (n = 14), signal transduction proteins (n = 19), transcription factors (n = 3), synaptic proteins (n = 13) and miscellaneous transcripts (n = 4). A comparison of gene expression in the VTA and SN of rats treated with vehicle for one day versus 21 days showed no main effect of TIME (VTA: F1,1150 = 0.0066, p = 0.935; SN: F1,1151 = 6.4 × 10 −14, p = 1.00), and no interaction between TIME and TRANSCRIPT (VTA: F(95,1150) = 1.026, p = 0.417; SN: F(95,1151) = 0.750, p = 0.962), indicating that change in gene expression over the course of haloperidol administration was not dependent on the injection procedure. In addition, there was no main effect of REGION (F1,1535 = 1.08 × 10 −10, p = 1.00) and no interaction between REGION and TRANSCRIPT (F(95,1535) = 0.713, p = 0.982) between VTA and SN for the transcripts evaluated in the present study.
Statistical comparisons using ANOVA for functional classes of genes
For the haloperidol time course analysis, animals treated with vehicle for one day were used as controls. ANOVAs on all genes within regions revealed significant main effects of TIME (VTA: F3,3226 = 8.836, p < 0.001; SN: F3,3317 = 4.897, p = 0.002) and interactions between TIME and TRANSCRIPT (VTA: F(285,3226) = 3.106, p < 0.001; SN: F(285,3317) = 3.096, p < 0.001). To further investigate these effects, we performed separate analyses on groups of genes having similar functions. ANOVAs and post hoc tests within functional groups revealed that 17 mRNAs in the VTA and 25 genes in the SN were significantly altered at some time point due to haloperidol administration; 17 mRNAs were similarly altered in both regions. All statistical results are summarized in Table 1.
Receptors
Several groups have reported alterations in glutamate receptor subunit protein and mRNA levels following neuroleptic administration. Consistent with these findings, we report a significant effect of haloperidol administration on glutamate receptor subunit mRNA expression in dopamine neurons in the VTA (F3,671 = 12.256; p < 0.001) and SN (F3,691 = 21.153; p < 0.001), with a significant interaction between TRANSCRIPT and TIME (VTA: F57,671 = 3.802; p < 0.001; SN: F57,691 = 5.258; p < 0.001). Post hoc analyses revealed significant changes in mRNA abundance of GRM1a, GRIN2C, GRIA1, GRIA3, GRIA4 and GRIK4 in both regions (Table 1, Fig. 2). In addition, GRIN1 and GRIK5 were significantly increased at day 21 of haloperidol administration compared with days 1 or 10 in the SN, but not in the VTA.
Fig. 2.
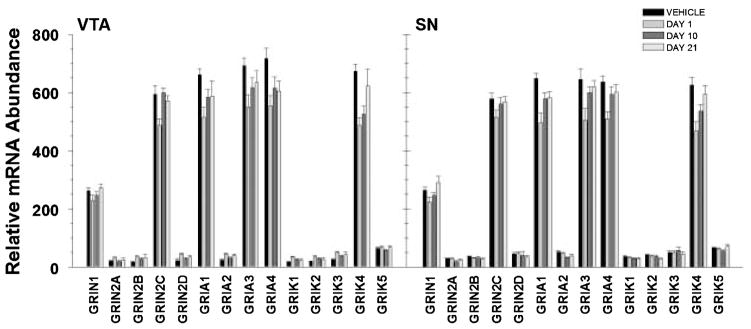
Representation of relative abundance of ionotropic glutamate receptor subunit mRNAs from TH immunopositive cells in the VTA and SN following haloperidol administration. Calculation of relative abundance values is described in the Methods. Bars represent mean ± SEM values for corresponding time points (see legend). Statistical significance is noted in Table 1.
There was a significant main effect of haloperidol on GABA transcript mRNA expression in the VTA (F3,468 = 6.351, p < 0.001), but not in the SN (F3,481 = 1.265, p = 0.286). Examination revealed a significant interaction for both the VTA (F39,468 = 4.704, p < 0.001) and the SN (F39,487 = 2.887, p < 0.001). In the VTA, post hoc analyses revealed significant decreases in α1, β1 and γ2 GABA-A receptor subunits on day 1 compared with controls, and significant increases in these subunits from day 1 to day 10. In addition, haloperidol induced a significant elevation in γ2 and β1 from day 1 to day 21. In the SN, the γ2 subunit was decreased at day 1 compared with controls, and higher at days 10 and 21 compared with day 1, while the α1 and β1 subunits were increased at days 10 and 21 compared with day 1, but not controls. Finally, a sustained decrease was found in glutamic acid decarboxylase 65 (GAD65) mRNA levels in both regions throughout the administration regimen (Fig. 3).
Fig. 3.
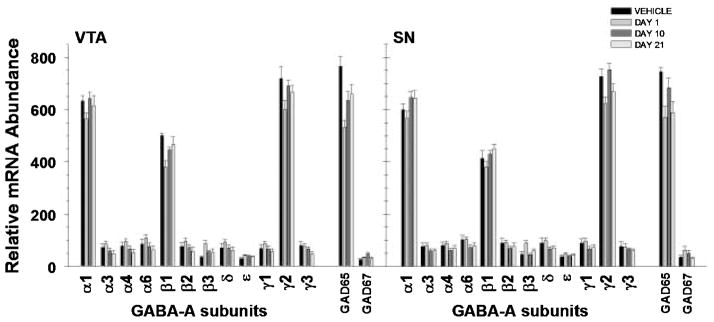
Representation of relative abundance of GABA-A receptor subunits and GAD65 and GAD67 mRNAs from TH immunopositive cells in the VTA and SN following haloperidol administration. Calculation of relative abundance values is described in the Methods. Bars represent mean ± SEM values for corresponding time points (see legend). Statistical significance is noted in Table 1.
Dopamine receptor mRNA levels were significantly different at the time points assessed in the present experiment in both regions (VTA: F3,196 = 4.411, p = 0.005; SN: F3,201 = 5.070, p = 0.002); however, there was no significant interaction of TIME by TRANSCRIPT in either region.
Signaling cascade transcripts
Previous studies in rodents have indicated a role for G-protein subunits in haloperidol administration. Examination of a variety of G-protein subunit mRNAs (Gαi1 – 3, Gβ1 – 3, Gγ5, Gα15, Gαs, Gαz, Gαq, Gαo, GralA and GralB) revealed a significant main effect of TIME in the VTA (F3,460 = 2.985, p = 0.031) and SN (F3,473 = 3.016, p = 0.030) and a TIME by TRANSCRIPT interaction in the VTA (F39,460 = 1.640, p = 0.011) and SN (F39,473 = 2.046, p < 0.001). In the VTA, the interaction was attributable to a down-regulation of the Gαi2 subunit at day 1 and corresponding increase in mRNA levels at days 10 and 21 compared with day 1. In the SN, post hoc analysis revealed a down-regulation of Gαi2 at days 1 and 21 compared with controls, with levels at day 10 being higher than those at days 1 and 21 (Table 1, Fig. 4).
Fig. 4.
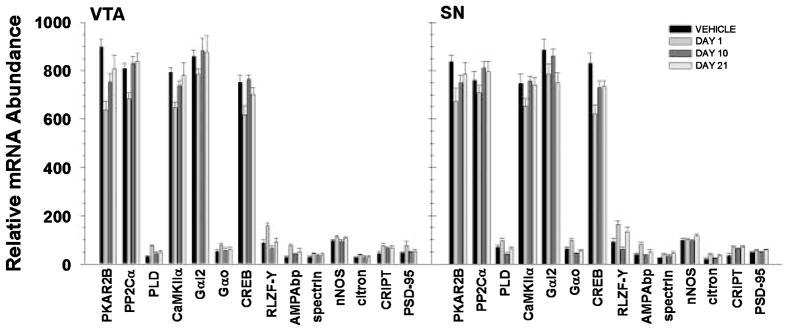
Representation of relative abundance of statistically significant transcripts from VTA and SN immunopositive cells following haloperidol administration. Calculation of relative abundance values is described in the Methods. Bars represent mean ± SEM values for corresponding time points (see legend). Statistical significance is noted in Table 1.
In addition to G protein subunits, haloperidol-mediated regulation of other transcripts related to signal transduction was investigated [adenylate cyclase 3 (AC3), adenylate cyclase 5 (AC5), G protein-coupled receptor kinase 4 (GRK4), G protein-coupled receptor kinase 5 (GRK5), protein kinase A regulatory subunit 1 A (PKAR1A), protein kinase A regulatory subunit 1B (PKAR1B), protein kinase A regulatory subunit 2B (PKAR2B), protein phosphatase 1 catalytic subunit α (PP1Cα), protein phosphatase 1 catalytic subunit β (PP1Cα), protein phosphatase 2 catalytic subunit α (PP2Cα), protein phosphatase 1 subunit γ (PP1γ), protein phosphatase 2 catalytic subunit β (PP2Cβ), phospholipase D (PLD), calcium/calmodulin-dependent protein kinase II-α (CaMKIIα), calcium/calmodulin-dependent protein kinase II-β3 (CaMKIIβ3), calcium/calmodulin-dependent protein kinase II-δ (CaMKIIδ), calcium/calmodulin-dependent protein kinase II-γ (CaMKIIγ), calcium/calmodulin-dependent protein kinase IV (CaMKIV), calcium/calmodulin-dependent protein kinase kinase α (CaMKKα)]. There was a significant main effect of haloperidol administration on mRNA levels in cells from the VTA (F3,645 = 8.242, p < 0.001) and SN (F3,662 = 4.263, p = 0.005). In addition, there was a significant interaction of TIME and TRANSCRIPT in the VTA (F(54, 645) = 7.546, p < 0.001) and SN (F54,662 = 2.458, p < 0.001) that was attributable to differential expression of several transcripts. In the VTA, PKAR2β subunit mRNA was decreased at all time points following haloperidol administration compared with vehicle, but levels increased from day 1–21. In the SN, PKAR2β mRNA levels were significantly lower than baseline on days 1 and 10 but were not significantly different form control levels by day 21. Similarly, CaMKIIα mRNA levels in the VTA were decreased at days 1 and 10 and returned to control levels by day 21, whereas levels were significantly decreased at day 1 only in the SN. Levels of PP2Cα subunit mRNA levels were decreased in the VTA following one day of haloperidol administration, but returned to baseline by day 10. In contrast, PP2Cα mRNA levels were significantly increased in the SN at days 10 and 21 compared with day 1, but were never different from controls. In addition, increased PLD mRNA levels following one day of haloperidol administration were seen in the VTA, and a similar pattern was found in the SN; levels at day 10 were significantly decreased from day 1 (Table 1, Fig. 4).
Synaptic proteins
Previous studies have reported significant decreased mRNA levels of various synaptic proteins in the brains of schizophrenic patients, indicating potential decrements in neuronal function in various brain regions. In the present study, we examined a number of pre-synaptic and post-synaptic density proteins [synaptojanin II (SYNJN II), synaptotaxin 5 (SYN-TX 5), synaptobrevin 2 (SYNBREV 2), AMPA binding protein (AMPAbp), spectrin alpha subunit (spectrin), neural nitric oxide synthase (nNOS), rho-interacting, ser/thre kinase 21 (citron), cysteine-rich interactor of PDZ3 (CRIPT), homer1C, post-synaptic density protein 95 kDa (PSD-95), PSD-95/SAP90-associated protein-1 (SAPAP), GluR interacting protein 1 (GRIP1), A-kinase anchoring protein (AKAP)].
Haloperidol administration significantly altered expression of synaptic protein transcripts in VTA (F3,440 = 24.015, p < 0.001) and SN dopamine neurons (F3,454 = 25.589, p < 0.001) and induced a significant TIME by TRANSCRIPT interaction in the SN (F36,454 = 1.638, p = 0.013). Post hoc analysis for the SN revealed significant increases in AMPAbp and citron mRNAs at day 1, as well as an increase in CRIPT mRNA that was sustained throughout the 21 day administration regimen. In addition, nNOS mRNA levels were increased from day 10 to day 21, and spectrin mRNA was increased at day 1 compared with controls (Table 1, Fig. 4). It should be noted that similar patterns of expression were seen in the VTA; however, post hoc analyses were not performed due to the lack of a significant TIME by TRANSCRIPT interaction.
Transcription factors
Analysis of three transcription factor mRNAs [transcription factor stat 5b (TFstat5b), rat lung zinc finger protein Y1 (RLZF-Y) and cAMP-responsive binding element (CREB)] revealed a significant main effect of TIME on gene expression in the SN only (VTA: F3,101 = 0.674, p = 0.570; SN: F3,104 = 3.048, p = 0.033). However, there were significant TIME by TRANSCRIPT interactions in both the VTA (F6,101 = 10.589, p < 0.001) and SN (F6,104 = 10.598, p < 0.001). Post hoc analysis revealed a significant decrease in CREB mRNA in VTA neurons on day 1 and a return to control levels by day 10. CREB mRNA levels in the SN neurons were decreased from controls at all time points, with day 1 having the lowest expression. mRNA levels for RLZF-Y were significantly increased on day 1 but had returned to control levels by day 21 in the VTA, whereas levels were significantly decreased on day 10 compared with day 1 in the SN (Table 1, Fig. 4).
Miscellaneous transcripts
Analysis of several additional transcripts [precursor to cholecystokinin (pCCK), cocaine-amphetamine related transcript (CART) brain-derived neurotrophic factor (BDNF) and cannabinoid receptor 1 (CNBR1)] did not reveal any significant difference in relative abundance over the time period studied in dopamine neurons in the VTA or SN (Table 1).
Self-organizing map clustering
SOM clustering provides a means of data mining and expression pattern profiling within the data set. It is important to note that these patterns reflect the normalized data only; they cannot address issues of comparative levels of expression or statistical significance, but rather are a tool for data mining and visualization of the data. Filtering of the present data set was employed to remove genes that changed less than 5% across all time points, and normalization was used to enable examination of the shape of expression patterns rather than the absolute levels of expression (Tamayo et al. 1999). The SOM algorithm was then performed and 12 distinct patterns of expression were generated. Figure 5 represents six of the 12 patterns identified by SOM. Each cluster contains genes with similar expression patterns, some genes which were identified as significantly altered following haloperidol administration as assessed by ANOVA.
Fig. 5.

Six out of the 12 conserved patterns of expression changes over time in VTA and SN DA neurons identified by SOM. Panels a–f represent individual plots of normalized data for each gene contained within the respective patterns (see Experimental procedures for description of data normalization).
Pattern A
Pattern A consists of genes that showed decreases at days 1 or 10, followed by increases at day 21. In VTA, the kainate receptor subunit GRIK4 was significantly decreased from baseline at day 1 and day 10, but not different from baseline at day 21. In the SN, GRIN1 and GRIK5 were increased at 21 days compared with earlier time points, but were not different from baseline.
Pattern B
Pattern B contains the highest number of genes found to be significantly altered by haloperidol over time, with many genes showing the same pattern of regulation in VTA and SN. In the VTA, CaMKIIα, GABA-A subunits β1 and γ2, GAD65, GRIA1, 3 and 4, GRM1a and PKAR2β were all significantly decreased at day 1. In the SN, CaMKIIα, CREB, GAD65, GRIA subunits 1, 3 and 4, Gαi2, GRIN2C, GRIK4, GRM1a and PKAR2β were significantly decreased at day 1. At day 10, GAD65, GRIA1, GRIA3, GRIA4 and PKAR2β were decreased from baseline in the VTA, and CREB, GAD65, GRIA1, GRIA4, GRIK4, GRM1a and PKAR2β were decreased from baseline in the SN. At day 21 of treatment, GAD65, GRIA4 and PKAR2β were decreased from baseline in the VTA, while CREB, GAD65, GRIA4, Gαi2, GRIK4 and PKAR2β were decreased from baseline in the SN.
Pattern C
Pattern C contains genes that are decreased at day 1, at or above baseline at day 10 with variable regulation at day 21. At day 1, CREB, GABA-A α1, Gαi2, GRIN2C and PP2Cα were decreased from baseline in the VTA, and GABA-A α1, GABA-A β1, GABA-A γ2 and PP2Cα were decreased from baseline in the SN. At day 10 and day 21, no genes in either region were significantly different from baseline.
Pattern D
Pattern D contains genes that are increased by one day of haloperidol treatment, but return to approximately baseline levels thereafter. In the VTA, PLD was significantly increased above baseline at day 1. In the SN, AMPAbp was increased above baseline at day 1, and PLD was significantly higher at day 10 than day 1.
Pattern E
Pattern E describes a regulation of genes that were increased at day 1, at or below baseline at day 10, followed by increases at day 21. In both the VTA and SN, the putative transcription factor RLZF-Y was significantly increased from baseline at day 1, but not different from baseline at days 10 or 21.
Pattern F
Pattern F contains genes that were generally increased at all time points of haloperidol administration. In the SN, CRIPT was significantly increased above baseline across the administration regimen. No genes in the VTA were significantly different from baseline at any time point in this pattern.
Discussion
The present study compared the gene expression profiles of 93 genes in TH-immunopositive cells of the VTA and SN in haloperidol-treated rats using laser capture microdissection, aRNA amplification and cDNA macroarrays. Previous studies have utilized microarray technology to assess alterations in the expression of multiple genes in brain regions from rats and monkeys treated chronically with haloperidol (Mirnics et al. 2000; Chardenot et al. 2002; Chong et al. 2002; Kontkanen et al. 2002; Middleton et al. 2002). Regional assessments of gene expression create a mosaic of expression level changes that are quite informative; however, determining the cellular origins of the gene expression has been complicated by cellular heterogeneity of cortical and subcortical regions and the difficulty in assessing multiple genes in discrete neuronal populations. Single cell gene expression methodology combined with array technology can overcome some of the anatomical and molecular limitations by assessing multiple transcripts in ‘target’ neuronal populations. The combination of discrete cell microdissection and arrays has provided a level of assessment heretofore unattainable with existing technology, and has been used successfully to profile neurons in schizophrenia, Alzheimer’s disease, drug overdose and aged humans (Ginsberg et al. 2000; Hemby et al. 2002, 2003; Tang et al. 2003). The present study identified the first molecular profiles of VTA and SN DA neurons following haloperidol administration as well as in control rats. Results revealed statistically significant haloperidol-induced alterations in 17 genes in the VTA and 25 genes in the SN compared with controls, with 17 being similarly regulated in both regions. In addition, SOMs revealed distinct and unique patterns of gene expression that provided insight into the temporal profile of effects of haloperidol treatment on VTA and SN DA cells.
Alterations in glutamate receptor subunit mRNAs
A major finding of the present study is the pattern of gene expression during haloperidol administration for ionotropic subunits and metabotropic glutamate receptors in midbrain DA cells. Haloperidol administration induced statistically significant decreases at day 1 in both VTA and SN in the expression of GRIA1, GRIA3, GRIA4, GRIK4, GRIN2C and GRM1a transcripts. Acute decreases ranged from 12 to 31%, but levels gradually returned to baseline over time (Figs 2a and 2b). At day 21, only GRIA1 and 4 (VTA and SN) and GRM1a and GRIK4 (SN) were significantly lower than baseline. Abnormal glutamatergic activity has been implicated in the pathology of schizophrenia based on evidence that NMDA antagonists induce psychotic symptoms markedly similar to schizophrenia in animals and humans (Javitt and Zukin 1991; Coyle 1996; Malhotra et al. 1996), and glutamate receptor mRNA and protein are altered in DA terminal regions in the brains of schizophrenic patients (Eastwood et al. 1995, 1997a,b; Sokolov 1998; Meador-Woodruff and Healy 2000; Meador-Woodruff et al. 2001). Previous studies of haloperidol administration indicate significant alterations in glutamate receptor mRNA and protein expression in rodents (Fitzgerald et al. 1995; Healy and Meador-Woodruff 1997; Riva et al. 1997) and rhesus monkeys (Mirnics et al. 2000).
The present data are particularly intriguing in light of the occurrence of depolarization block, a phenomenon whereby chronic haloperidol induces a state of hyperexcitation of midbrain DA neurons such that generation of action potentials is inhibited (Grace et al. 1997). Acute administration of haloperidol increases the firing rate of DA neurons via two mechanisms: the blockade of D2 autoreceptors on dopaminergic perikarya and activation of glutamatergic feedback systems (Pucak and Grace 1994, 1996). Whereas acute haloperidol administration increases glutamatergic neurotransmission (Grace et al. 1997; Cobb and Abercrombie 2002), chronic administration (i.e. 14–21 days) is required for the manifestation of depolarization block as well as the reversal of psychotic symptomology in schizophrenics, suggesting neuroadaptive molecular changes over this period. SOM clustering was used to visualize patterns of co-ordinate gene expression associated with haloperidol administration over the treatment regimen, possibly yielding insight into the molecular basis of depolarization block and the onset of antipsychotic effects of haloperidol. Figure 5(b) depicts a pattern of decreased expression on day 1 in both the VTA and SN that gradually increased over the three week administration period to approximate control levels. Interestingly, several ionotropic glutamate receptor subunits were members of this cluster. During the initial phase of haloperidol administration, decreased expression of glutamate receptor subunits may be occurring simultaneously with increased glutamatergic transmission in the midbrain, thereby reduced hyperexcitation of dopamine neurons. The gradual return of glutamate receptor subunit mRNAs to baseline levels may result in increased excitatory input to the dopamine cells and contribute to the development of depolarization block. Interestingly, glutamate transcripts in the VTA and SN show similar temporal expression patterns (Fig. 5b), in agreement with previous studies showing that typical antipsychotics, including haloperidol, induce depolarization block in both VTA and SN neurons (Chiodo and Bunney 1983).
The decrease in midbrain dopamine activity following chronic haloperidol administration may induce changes in synaptic protein mRNA levels. In the present study, the synaptic proteins category comprised pre-synaptic proteins, which are involved in the docking and fusion of vesicles and membranes, and post-synaptic proteins, which are involved in anchoring and clustering of receptors, and both of which are involved in synaptic plasticity. Citron, CRIPT AMPAbp, nNOS and spectrin mRNAs, transcripts associated with glutamate receptor anchoring and clustering, were found to be up-regulated in dopamine neurons of the SN in a region-specific manner. Correspondingly, GRIN1 and GRIK5 mRNA levels were increased in SN neurons, but not VTA neurons, following 21 days of haloperidol administration. The reasons for the regional and transcriptional specificity of these alterations remain unknown and warrant further examination. Future studies are also needed to correlate such changes with the development of depolarization block in the same subjects.
Alterations in GABA-A receptor subunit mRNAs
GABA-A receptors can be composed of a wide variety of subunits, and receptor subtype distribution appears to be highly heterogeneous throughout the brain (Pirker et al. 2000). The results of this study suggest that the predominant GABA-A receptor subtype expressed in midbrain DA neurons is α1β1γ2. In the VTA, all of these mRNAs were significantly decreased at day 1, while in the SN, all three were decreased at day 1, but only GABA-A γ2 showed significance. By day 10, these transcripts had returned to baseline in both regions, suggesting an acute response to haloperidol that does not persist to chronic time points. An initial decrease in GABA-A receptor subunits may facilitate the acute haloperidol-induced increase in firing rate of DA cells by reducing tonic inhibition from local circuit inter-neurons as well as GABAergic afferents onto these cells (Johnson and North 1992; Westerink et al. 1992; Cobb and Abercrombie 2002). Interestingly, the present results revealed expression of GAD65, a synthetic enzyme for GABA, in both VTA and SN DA neurons, supporting previous studies of co-localization of TH with GAD and GAD65 in midbrain dopamine cells (Campbell et al. 1991; Gonzalez-Hernandez et al. 2001). The authors suggest that approximately 10% of the dopamine nigrostriatal cells contain GAD65 mRNA (not GAD67 mRNA or protein) and are preferentially localized in the medial aspects of the SN and VTA (Gonzalez-Hernandez et al. 2001). The active form of GAD65 is regulated by energy metabolites and as such appears to be involved in the short-term requirements for increased GABA neurotransmission. The presence of GABA receptors on dopamine/GABA neurons suggests that GABA co-transmission may serve a modulatory function during excessive activity of these neurons (Gonzalez-Hernandez et al. 2001). In relation to the present study, decreased expression of GAD65 mRNA by haloperidol may indicate a diminished capacity of GABA to dampen excessive neuronal activity induced by haloperidol. Whereas no evidence to date directly demonstrates co-release of dopamine and GABA, it is reasonable to speculate potential co-release of these neurotransmitters by this subpopulation of neurons. Clearly, more studies need to be performed to fully understand the functional implications of co-localization of neurotransmitters in these and other cell types.
Alterations in cAMP pathway mRNAs
Haloperidol, via blockade of D2 receptors, has been found to increase cAMP signaling in striatum (Leveque et al. 2000; Dwivedi et al. 2002), and haloperidol-mediated induction of gene expression in this area is dependent on PKA (Adams et al. 1997) and CREB (Konradi and Heckers 1995). In addition, Gαi2 has been found to be down-regulated in cortex and striatum after haloperidol treatment (Gupta and Mishra 1992; Kaplan et al. 1999). In the present study, we report an approximate 10% decrease in Gαi2 mRNA at day 1 in both regions, followed by a return to baseline in VTA by day 10. Gαi2 was significantly lower than baseline at day 21, but not day 10 in the SN. Increases in PKA activity, as well as increases in mRNA for regulatory subunits PKAR2α and PKAR2β, have been found in striatum following chronic haloperidol (Leveque et al. 2000; Dwivedi et al. 2002). In contrast, the present results show down-regulation of PKAR2β mRNA across time in both regions, with the lowest expression at day 1. CREB mRNAwas decreased at all time points in SN, but was decreased at day 1 and returned to baseline levels by day 10 in the VTA. Differences in the effects of haloperidol administration between previous studies and the present results include examination of dopamine terminal versus cell body regions, use of in situ hybridization versus aRNA amplification, and examination of regional versus discrete neuronal changes in gene expression. Nevertheless, additional studies are needed to determine the mechanisms by which haloperidol administration induced a decrease in several transcripts in the cAMP pathway in these neurons.
Similarity of VTA and SN DA neurons
Overall, few differences were found between the gene expression profiles of VTA and SN dopamine cells. At baseline, no statistically significant differences were seen between regions in the expression of the 93 genes examined. These data suggest that functional differences between these cells may result more from their differential connectivity than their molecular composition. However, since the present study only examined a small number of genes relative to the whole rat genome, significant differences in the molecular fingerprint of these neuronal populations may still exist.
In response to haloperidol, time-dependent regulation of many transcripts appeared to be strikingly similar between VTA and SN DA neurons, especially at early time points. Electrophysiological, neurochemical and molecular studies have shown that haloperidol administration affects the mesocorticolimbic and nigrostriatal pathways in a similar manner (Moghaddam and Bunney 1990; Dilts et al. 1993; Gardner et al. 1994; Grace et al. 1997). Due to the functions subserved by these two pathways, the antipsychotic effects of haloperidol are likely manifested through the mesocorticolimbic DA system, whereas the nigrostriatal DA system likely underlies motor side-effects associated with this typical antipsychotic.
While the present study identified changes in gene expression as a function of haloperidol administration, the relationship of such changes to protein levels remains to be determined. Translational accessibility, post-translational modifications and phosphorylation states of proteins alter the relationship between mRNA abundance and functional protein levels. Furthermore, the potential transport of mRNAs and/or proteins out of the cell body regions may further complicate assessment of the relationship between mRNA and protein in the same brain region or cell type. Approaches for protein analysis in single cells that are analogous to aRNA amplification remain to be developed.
In summary, the results of this study provide the first expression profile of dopaminergic cells of the VTA and SN, both in a normative state and after a time course of treatment with haloperidol. In addition, statistically significant changes in several functional classes of transcripts, as well as conserved patterns of expression over time, have been identified. Most notable is the finding that glutamate receptor subunits are regulated in a manner that may contribute to the development of depolarization block in these DA cells. Additional studies are warranted to further clarify the neuroadaptations induced by antipsychotics that are responsible for their clinical efficacy; interesting comparisons with the present results would be the application of similar methodology to discrete cell types in terminal regions, as well as the use of atypical antipsychotic drugs. Understanding antipsychotic-induced alterations is a critical step in the development of improved pharmacotherapies, and identification of gene expression changes in response to antipsychotic administration may provide insight into the molecular pathology associated with schizophrenia.
Acknowledgments
This research was supported in part by grants from the National Institute on Drug Abuse (DA13772, SEH; DA15941, WHF) and the Stanley Research Foundation (SEH). We thank Drs Chris Muly and Bill Freeman for their helpful comments and suggestions. The Emory University Health Sciences Center Microarray Facility provided the cDNA clones.
Abbreviations used
- AMPA
(±) alpha-amino-3-hydroxy-5-methylis-oxazole-4-propionate
- aRNA
anti-sense ribonucleic acid
- cAMP
3,5-cyclic adenosine monophosphate
- CREB
cAMP response element binding protein
- DA
dopamine
- LCM
laser capture microdissected
- NAc
nucleus accumbens
- PFC
prefrontal cortex
- SN
substantia nigra
- SOM
self-organizing maps
- TH
tyrosine hydroxylase
- VTA
ventral tegmental area
References
- Adams MR, Brandon EP, Chartoff EH, Idzerda RL, Dorsa DM, McKnight GS. Loss of haloperidol induced gene expression and catalepsy in protein kinase A-deficient mice. Proc Natl Acad Sci USA. 1997;94:12157–12161. doi: 10.1073/pnas.94.22.12157. [DOI] [PMC free article] [PubMed] [Google Scholar]
- Baldessarini RJ. The ‘neuroleptic’ antipsychotic drugs. 1 Mechanisms of action. Postgrad Med. 1979a;65:114–109. doi: 10.1080/00325481.1979.11715115. [DOI] [PubMed] [Google Scholar]
- Baldessarini RJ. The ‘neuroleptic’ antipsychotic drugs. 2 Neurologic side effects. Postgrad Med. 1979b;65:123–128. doi: 10.1080/00325481.1979.11715116. [DOI] [PubMed] [Google Scholar]
- Baldessarini RJ, Tarsy D. Dopamine and the pathophysiology of dyskinesias induced by antipsychotic drugs. Annu Rev Neurosci. 1980;3:23–41. doi: 10.1146/annurev.ne.03.030180.000323. [DOI] [PubMed] [Google Scholar]
- Boye SM, Rompre PP. Behavioral evidence of depolarization block of dopamine neurons after chronic treatment with haloperidol and clozapine. J Neurosci. 2000;20:1229–1239. doi: 10.1523/JNEUROSCI.20-03-01229.2000. [DOI] [PMC free article] [PubMed] [Google Scholar]
- Campbell KJ, Takada M, Hattori T. Co-localization of tyrosine hydroxylase and glutamate decarboxylase in a subpopulation of single nigrotectal projection neurons. Brain Res. 1991;558:239–244. doi: 10.1016/0006-8993(91)90774-p. [DOI] [PubMed] [Google Scholar]
- Carlsson A, Hansson LO, Waters N, Carlsson ML. A glutamatergic deficiency model of schizophrenia. Br J Psych Suppl. 1999;37:2–6. [PubMed] [Google Scholar]
- Chardenot P, Roubert C, Galiegue S, Casellas P, Le Fur G, Soubrie P, Oury-Donat F. Expression profile and up-regulation of PRAX-1 mRNA by antidepressant treatment in the rat brain. Mol Pharmacol. 2002;62:1314–1320. doi: 10.1124/mol.62.6.1314. [DOI] [PubMed] [Google Scholar]
- Chiodo LA, Bunney BS. Typical and atypical neuroleptics: differential effects of chronic administration on the activity of A9 and A10 midbrain dopaminergic neurons. J Neurosci. 1983;3:1607–1619. doi: 10.1523/JNEUROSCI.03-08-01607.1983. [DOI] [PMC free article] [PubMed] [Google Scholar]
- Chiodo LA, Bunney BS. Population response of midbrain dopaminergic neurons to neuroleptics: further studies on time course and nondopaminergic neuronal influences. J Neurosci. 1987;7:629–633. doi: 10.1523/JNEUROSCI.07-03-00629.1987. [DOI] [PMC free article] [PubMed] [Google Scholar]
- Chong VZ, Young LT, Mishra RK. cDNA array reveals differential gene expression following chronic neuroleptic administration: implications of synapsin II in haloperidol treatment. J Neurochem. 2002;82:1533–1539. doi: 10.1046/j.1471-4159.2002.01104.x. [DOI] [PubMed] [Google Scholar]
- Cobb WS, Abercrombie ED. Distinct roles for nigral GABA and glutamate receptors in the regulation of dendritic dopamine release under normal conditions and in response to systemic haloperidol. J Neurosci. 2002;22:1407–1413. doi: 10.1523/JNEUROSCI.22-04-01407.2002. [DOI] [PMC free article] [PubMed] [Google Scholar]
- Cotes PM, Crow TJ, Johnstone EC, Bartlett W, Bourne RC. Neuroendocrine changes in acute schizophrenia as a function of clinical state and neuroleptic medication. Psychol Med. 1978;8:657–665. doi: 10.1017/s0033291700018869. [DOI] [PubMed] [Google Scholar]
- Coyle JT. The glutamatergic dysfunction hypothesis for schizophrenia. Harv Rev Psych. 1996;3:241–253. doi: 10.3109/10673229609017192. [DOI] [PubMed] [Google Scholar]
- Crane GE. Rapid reversal of tardive dyskinesia. Am J Psychiatry. 1973;130:1159. doi: 10.1176/ajp.130.10.1159. [DOI] [PubMed] [Google Scholar]
- Creese I, Burt DR, Snyder SH. Dopamine receptor binding predicts clinical and pharmacological potencies of anti-schizophrenic drugs. Science. 1976;192:481–483. doi: 10.1126/science.3854. [DOI] [PubMed] [Google Scholar]
- Dilts RP, Jr, Helton TE, McGinty JF. Selective induction of Fos and FRA immunoreactivity within the mesolimbic and mesostriatal dopamine terminal fields. Synapse. 1993;13:251–263. doi: 10.1002/syn.890130308. [DOI] [PubMed] [Google Scholar]
- Dwivedi Y, Rizavi HS, Pandey GN. Differential effects of haloperidol and clozapine on [(3) H]cAMP binding, protein kinase A (PKA) activity, and mRNA and protein expression of selective regulatory and catalytic subunit isoforms of PKA in rat brain. J Pharmacol Exp Ther. 2002;301:197–209. doi: 10.1124/jpet.301.1.197. [DOI] [PubMed] [Google Scholar]
- Eastwood SL, McDonald B, Burnet PW, Beckwith JP, Kerwin RW, Harrison PJ. Decreased expression of mRNAs encoding non-NMDA glutamate receptors GluR1 and GluR2 in medial temporal lobe neurons in schizophrenia. Brain Res Mol Brain Res. 1995;29:211–223. doi: 10.1016/0169-328x(94)00247-c. [DOI] [PubMed] [Google Scholar]
- Eastwood SL, Burnet PW, Harrison PJ. GluR2 glutamate receptor subunit flip and flop isoforms are decreased in the hippocampal formation in schizophrenia: a reverse transcriptase-polymerase chain reaction (RT-PCR) study. Brain Res Mol Brain Res. 1997a;44:92–98. doi: 10.1016/s0169-328x(96)00195-7. [DOI] [PubMed] [Google Scholar]
- Eastwood SL, Kerwin RW, Harrison PJ. Immunoautoradiographic evidence for a loss of alpha-amino-3-hydroxy-5-methyl-4-isoxazole propionate-preferring non-N-methyl-D-aspartate glutamate receptors within the medial temporal lobe in schizophrenia. Biol Psych. 1997b;41:636–643. doi: 10.1016/S0006-3223(96)00220-X. [DOI] [PubMed] [Google Scholar]
- Eberwine J, Yeh H, Miyashiro K, Cao Y, Nair S, Finnell R, Zettel M, Coleman P. Analysis of gene expression in single live neurons. Proc Natl Acad Sci USA. 1992;89:3010–3014. doi: 10.1073/pnas.89.7.3010. [DOI] [PMC free article] [PubMed] [Google Scholar]
- Egan MF, Hurd Y, Hyde TM, Weinberger DR, Wyatt RJ, Kleinman JE. Alterations in mRNA levels of D2 receptors and neuropeptides in striatonigral and striatopallidal neurons of rats with neuroleptic-induced dyskinesias. Synapse. 1994;18:178–189. doi: 10.1002/syn.890180303. [DOI] [PubMed] [Google Scholar]
- Fend F, Quintanilla-Martinez L, Kumar S, Beaty MW, Blum L, Sorbara L, Jaffe ES, Raffeld M. Composite low grade B-cell lymphomas with two immunophenotypically distinct cell populations are true biclonal lymphomas. A molecular analysis using laser capture microdissection. Am J Pathol. 1999;154:1857–1866. doi: 10.1016/S0002-9440(10)65443-0. [DOI] [PMC free article] [PubMed] [Google Scholar]
- Fitzgerald LW, Deutch AY, Gasic G, Heinemann SF, Nestler EJ. Regulation of cortical and subcortical glutamate receptor subunit expression by antipsychotic drugs. J Neurosci. 1995;15:2453–2461. doi: 10.1523/JNEUROSCI.15-03-02453.1995. [DOI] [PMC free article] [PubMed] [Google Scholar]
- Fox CA, Mansour A, Watson SJ., Jr The effects of haloperidol on dopamine receptor gene expression. Exp Neurol. 1994;130:288–303. doi: 10.1006/exnr.1994.1207. [DOI] [PubMed] [Google Scholar]
- Gardner EL, Chen J, Paredes W. Clozapine produces potent antidopaminergic effects anatomically specific to the mesolimbic system. J Clin Psych. 1994;55:15–22. [PubMed] [Google Scholar]
- Ginsberg SD, Crino PB, Hemby SE, Weingarten JA, Lee VM, Eberwine JH, Trojanowski JQ. Predominance of neuronal mRNAs in individual Alzheimer’s disease senile plaques. Ann Neurol. 1999;45:174–181. [PubMed] [Google Scholar]
- Ginsberg SD, Hemby SE, Lee VM, Eberwine JH, Trojanowski JQ. Expression profile of transcripts in Alzheimer’s disease tangle-bearing CA1 neurons. Ann Neurol. 2000;48:77–87. [PubMed] [Google Scholar]
- Goff DC, Coyle JT. The emerging role of glutamate in the pathophysiology and treatment of schizophrenia. Am J Psych. 2001;158:1367–1377. doi: 10.1176/appi.ajp.158.9.1367. [DOI] [PubMed] [Google Scholar]
- Gonzalez-Hernandez T, Barroso-Chinea P, Acevedo A, Salido E, Rodriguez M. Colocalization of tyrosine hydroxylase and GAD65 mRNA in mesostriatal neurons. Eur J Neurosci. 2001;13:57–67. [PubMed] [Google Scholar]
- Grace AA. The depolarization block hypothesis of neuroleptic action: implications for the etiology and treatment of schizophrenia. J Neural Transm. 1992;36 (Suppl):91–131. doi: 10.1007/978-3-7091-9211-5_6. [DOI] [PubMed] [Google Scholar]
- Grace AA, Bunney BS, Moore H, Todd CL. Dopamine-cell depolarization block as a model for the therapeutic actions of antipsychotic drugs. Trends Neurosci. 1997;20:31–37. doi: 10.1016/S0166-2236(96)10064-3. [DOI] [PubMed] [Google Scholar]
- Gupta SK, Mishra RK. Effects of chronic treatment of haloperidol and clozapine on levels of G-protein subunits in rat striatum. J Mol Neurosci. 1992;3:197–201. doi: 10.1007/BF03380139. [DOI] [PubMed] [Google Scholar]
- Hasenkamp W, Hemby SE. Functional genomics and psychiatric illness. Prog Brain Res. 2002;138:375–393. doi: 10.1016/S0079-6123(02)38087-7. [DOI] [PMC free article] [PubMed] [Google Scholar]
- Healy DJ, Meador-Woodruff JH. Clozapine and haloperidol differentially affect AMPA and kainate receptor subunit mRNA levels in rat cortex and striatum. Brain Res Mol Brain Res. 1997;47:331–338. doi: 10.1016/s0169-328x(97)00064-8. [DOI] [PubMed] [Google Scholar]
- Hemby SE, Ginsberg SD, Brunk B, Trojanowski JQ, Eberwine JH. Gene expression profile for schizophrenia: discrete neuron transcription patterns in the entorhinal cortex. Arch Gen Psych. 2002;59:631–640. doi: 10.1001/archpsyc.59.7.631. [DOI] [PubMed] [Google Scholar]
- Hemby SE, Trojanowski JQ, Ginsberg SD. Neuron specific age related decreases in dopamine receptor subtype mRNAs. J Comp Neurol. 2003;456:176–183. doi: 10.1002/cne.10525. [DOI] [PMC free article] [PubMed] [Google Scholar]
- Hurley MJ, Stubbs CM, Jenner P, Marsden CD. Effect of chronic treatment with typical and atypical neuroleptics on the expression of dopamine D2 and D3 receptors in rat brain. Psychopharmacology. 1996;128:362–370. doi: 10.1007/s002130050146. [DOI] [PubMed] [Google Scholar]
- Hyman SE, Nestler EJ. Initiation and adaptation: a paradigm for understanding psychotropic drug action. Am J Psych. 1996;153:151–162. doi: 10.1176/ajp.153.2.151. [DOI] [PubMed] [Google Scholar]
- Jaber M, Tison F, Fournier MC, Bloch B. Differential influence of haloperidol and sulpiride on dopamine receptors and peptide mRNA levels in the rat striatum and pituitary. Brain Res Mol Brain Res. 1994;23:14–20. doi: 10.1016/0169-328x(94)90206-2. [DOI] [PubMed] [Google Scholar]
- Javitt DC, Zukin SR. Recent advances in the phencyclidine model of schizophrenia. Am J Psych. 1991;148:1301–1308. doi: 10.1176/ajp.148.10.1301. [DOI] [PubMed] [Google Scholar]
- Johnson SW, North RA. Two types of neurone in the rat ventral tegmental area and their synaptic inputs. J Physiol. 1992;450:455–468. doi: 10.1113/jphysiol.1992.sp019136. [DOI] [PMC free article] [PubMed] [Google Scholar]
- Kaech SM, Hemby S, Kersh E, Ahmed R. Molecular and functional profiling of memory CD8 T cell differentiation. Cell. 2002;111:837–851. doi: 10.1016/s0092-8674(02)01139-x. [DOI] [PubMed] [Google Scholar]
- Kamme F, Erlander MG. Global gene expression analysis of single cells. Curr Opin Drug Discov Devel. 2003;6:231–236. [PubMed] [Google Scholar]
- Kamme F, Salunga R, Yu J, Tran DT, Zhu J, Luo L, Bittner A, Guo HQ, Miller N, Wan J, et al. Single-cell microarray analysis in hippocampus CA1: demonstration and validation of cellular heterogeneity. J Neurosci. 2003;23:3607–3615. doi: 10.1523/JNEUROSCI.23-09-03607.2003. [DOI] [PMC free article] [PubMed] [Google Scholar]
- Kaplan GB, Leite-Morris KA, Keith DJ. Differential effects of treatment with typical and atypical antipsychotic drugs on adenylyl cyclase and G proteins. Neurosci Lett. 1999;273:147–150. doi: 10.1016/s0304-3940(99)00610-2. [DOI] [PubMed] [Google Scholar]
- Kohonen T. The self-organizing map. IEEE. 1990;78:1464–1480. [Google Scholar]
- Kohonen T. Self-Organizing Maps. 3. Springer Verlag; Berlin: 2000. [Google Scholar]
- Konradi C, Heckers S. Haloperidol-induced Fos expression in striatum is dependent upon transcription factor cyclic AMP response element binding protein. Neuroscience. 1995;65:1051–1061. doi: 10.1016/0306-4522(94)00546-h. [DOI] [PubMed] [Google Scholar]
- Konradi C, Heckers S. Antipsychotic drugs and neuroplasticity: insights into the treatment and neurobiology of schizophrenia. Biol Psych. 2001;50:729–742. doi: 10.1016/s0006-3223(01)01267-7. [DOI] [PMC free article] [PubMed] [Google Scholar]
- Kontkanen O, Toronen P, Lakso M, Wong G, Castren E. Antipsychotic drug treatment induces differential gene expression in the rat cortex. J Neurochem. 2002;83:1043–1053. doi: 10.1046/j.1471-4159.2002.01213.x. [DOI] [PubMed] [Google Scholar]
- Laruelle M, Jaskiw GE, Lipska BK, Kolachana B, Casanova MF, Kleinman JE, Weinberger DR. D1 and D2 receptor modulation in rat striatum and nucleus accumbens after subchronic and chronic haloperidol treatment. Brain Res. 1992;575:47–56. doi: 10.1016/0006-8993(92)90421-5. [DOI] [PubMed] [Google Scholar]
- Leveque JC, Macias W, Rajadhyaksha A, Carlson RR, Barczak A, Kang S, Li XM, Coyle JT, Huganir RL, Heckers S, et al. Intracellular modulation of NMDA receptor function by antipsychotic drugs. J Neurosci. 2000;20:4011–4020. doi: 10.1523/JNEUROSCI.20-11-04011.2000. [DOI] [PMC free article] [PubMed] [Google Scholar]
- Luo L, Salunga RC, Guo H, Bittner A, Joy KC, Galindo JE, Xiao H, Rogers KE, Wan JS, Jackson MR, et al. Gene expression profiles of laser-captured adjacent neuronal subtypes. Nat Med. 1999;5:117–122. doi: 10.1038/4806. [erratum appears in Nat. Med. (1999) 5, 355] [DOI] [PubMed] [Google Scholar]
- Malhotra AK, Pinals DA, Weingartner H, Sirocco K, Missar CD, Pickar D, Breier A. NMDA receptor function and human cognition: the effects of ketamine in healthy volunteers. Neuropsychopharmacology. 1996;14:301–307. doi: 10.1016/0893-133X(95)00137-3. [DOI] [PubMed] [Google Scholar]
- Matsunaga T, Ohara K, Natsukari N, Fujita M. Dopamine D2-receptor mRNA level in rat striatum after chronic haloperidol treatment. Neurosci Res. 1991;12:440–445. doi: 10.1016/0168-0102(91)90075-a. [DOI] [PubMed] [Google Scholar]
- Meador-Woodruff JH, Healy DJ. Glutamate receptor expression in schizophrenic brain. Brain Res Brain Res Rev. 2000;31:288–294. doi: 10.1016/s0165-0173(99)00044-2. [DOI] [PubMed] [Google Scholar]
- Meador-Woodruff JH, Davis KL, Haroutunian V. Abnormal kainate receptor expression in prefrontal cortex in schizophrenia. Neuropsychopharmacology. 2001;24:545–552. doi: 10.1016/S0893-133X(00)00189-5. [DOI] [PubMed] [Google Scholar]
- Middleton FA, Mirnics K, Pierri JN, Lewis DA, Levitt P. Gene expression profiling reveals alterations of specific metabolic pathways in schizophrenia. J Neurosci. 2002;22:2718–2729. doi: 10.1523/JNEUROSCI.22-07-02718.2002. [DOI] [PMC free article] [PubMed] [Google Scholar]
- Mirnics K, Middleton FA, Marquez A, Lewis DA, Levitt P. Molecular characterization of schizophrenia viewed by microarray analysis of gene expression in prefrontal cortex. Neuron. 2000;28:53–67. doi: 10.1016/s0896-6273(00)00085-4. [DOI] [PubMed] [Google Scholar]
- Moghaddam B, Bunney BS. Acute effects of typical and atypical antipsychotic drugs on the release of dopamine from prefrontal cortex, nucleus accumbens, and striatum of the rat: an in vivo microdialysis study. J Neurochem. 1990;54:1755–1760. doi: 10.1111/j.1471-4159.1990.tb01230.x. [DOI] [PubMed] [Google Scholar]
- Paxinos G, Watson C. The Rat Brain in Stereotaxic Coordinates. 4. Academic Press; San Diego: 1998. [Google Scholar]
- Petersen R, Finsen B, Andreassen OA, Zimmer J, Jorgensen HA. No changes in dopamine D (1) receptor mRNA expressing neurons in the dorsal striatum of rats with oral movements induced by long-term haloperidol administration. Brain Res. 2000;859:394–397. doi: 10.1016/s0006-8993(00)02017-5. [DOI] [PubMed] [Google Scholar]
- Pirker S, Schwarzer C, Wieselthaler A, Sieghart W, Sperk G. GABA (A) receptors: immunocytochemical distribution of 13 subunits in the adult rat brain. Neuroscience. 2000;101:815–850. doi: 10.1016/s0306-4522(00)00442-5. [DOI] [PubMed] [Google Scholar]
- Pucak ML, Grace AA. Evidence that systemically administered dopamine antagonists activate dopamine neuron firing primarily by blockade of somatodendritic autoreceptors. J Pharmacol Exp Ther. 1994;271:1181–1192. [PubMed] [Google Scholar]
- Pucak ML, Grace AA. Effects of haloperidol on the activity and membrane physiology of substantia nigra dopamine neurons recorded in vitro. Brain Res. 1996;713:44–52. doi: 10.1016/0006-8993(95)01460-8. [DOI] [PubMed] [Google Scholar]
- Riva MA, Tascedda F, Lovati E, Racagni G. Regulation of NMDA receptor subunit messenger RNA levels in the rat brain following acute and chronic exposure to antipsychotic drugs. Brain Res Mol Brain Res. 1997;50:136–142. doi: 10.1016/s0169-328x(97)00175-7. [DOI] [PubMed] [Google Scholar]
- Seeman P, Lee T, Chau-Wong M, Wong K. Antipsychotic drug doses and neuroleptic/dopamine receptors. Nature. 1976;261:717–719. doi: 10.1038/261717a0. [DOI] [PubMed] [Google Scholar]
- Sokolov BP. Expression of NMDAR1, GluR1, GluR7, and KA1 glutamate receptor mRNAs is decreased in frontal cortex of ‘neuroleptic-free’ schizophrenics: evidence on reversible up-regulation by typical neuroleptics. J Neurochem. 1998;71:2454–2464. doi: 10.1046/j.1471-4159.1998.71062454.x. [DOI] [PubMed] [Google Scholar]
- de Souza IE, Meredith GE. NMDA receptor blockade attenuates the haloperidol induction of Fos protein in the dorsal but not the ventral striatum. Synapse. 1999;32:243–253. doi: 10.1002/(SICI)1098-2396(19990615)32:4<243::AID-SYN1>3.0.CO;2-O. [DOI] [PubMed] [Google Scholar]
- Srivastava LK, Morency MA, Bajwa SB, Mishra RK. Effect of haloperidol on expression of dopamine D2 receptor mRNAs in rat brain. J Mol Neurosci. 1990;2:155–161. doi: 10.1007/BF02896840. [DOI] [PubMed] [Google Scholar]
- Tamayo P, Slonim D, Mesirov J, Zhu Q, Kitareewan S, Dmitrovsky E, Lander ES, Golub TR. Interpreting patterns of gene expression with self-organizing maps: methods and application to hematopoietic differentiation. Proc Natl Acad Sci USA. 1999;96:2907–2912. doi: 10.1073/pnas.96.6.2907. [DOI] [PMC free article] [PubMed] [Google Scholar]
- Tang WX, Fasulo WH, Mash DC, Hemby SE. Molecular profiling of midbrain dopamine regions in cocaine overdose victims. J Neurochem. 2003;85:911–924. doi: 10.1046/j.1471-4159.2003.01740.x. [DOI] [PMC free article] [PubMed] [Google Scholar]
- Tascedda F, Lovati E, Blom JM, Muzzioli P, Brunello N, Racagni G, Riva MA. Regulation of ionotropic glutamate receptors in the rat brain in response to the atypical antipsychotic seroquel (quetiapine fumarate) Neuropsychopharmacology. 1999;21:211–217. doi: 10.1016/S0893-133X(99)00034-2. [DOI] [PubMed] [Google Scholar]
- Toronen P, Kolehmainen M, Wong G, Castren E. Analysis of gene expression data using self-organizing maps. FEBS Lett. 1999;451:142–146. doi: 10.1016/s0014-5793(99)00524-4. [DOI] [PubMed] [Google Scholar]
- Westerink BH, Santiago M, De Vries JB. In vivo evidence for a concordant response of terminal and dendritic dopamine release during intranigral infusion of drugs. Naunyn Schmiedebergs Arch Pharmacol. 1992;346:637–643. doi: 10.1007/BF00168736. [DOI] [PubMed] [Google Scholar]
- Yamamoto BK, Pehek EA, Meltzer HY. Brain region effects of clozapine on amino acid and monoamine transmission. J Clin Psych. 1994;55:8–14. [PubMed] [Google Scholar]
- Zhao X, Lein ES, He A, Smith SC, Aston C, Gage FH. Transcriptional profiling reveals strict boundaries between hippocampal subregions. J Comp Neurol. 2001;441:187–196. doi: 10.1002/cne.1406. [DOI] [PubMed] [Google Scholar]