

Abstract
Purpose
Results from clinical trials involving resistance to molecularly targeted therapies have revealed the importance of rational single agent and combination treatment strategies. In this study, we tested the efficacy of a type 1 insulin-like growth factor receptor (IGF1R)/insulin receptor (IR) tyrosine kinase inhibitor (TKI), OSI-906, in combination with a MEK 1/2 inhibitor based on evidence that the MAPK pathway was upregulated in colorectal cancer (CRC) cell lines that were resistant to OSI-906.
Experimental Design
The antiproliferative effects of OSI-906 and the MEK 1/2 inhibitor U0126, were analyzed both as single agents and in combination in 13 CRC cell lines in vitro. Apoptosis, downstream effector proteins, and cell cycle were also assessed. Additionally, the efficacy of OSI-906 combined with the MEK 1/2 inhibitor selumetinib (AZD6244, ARRY-142886), was evaluated in vivo using human CRC xenograft models.
Results
The combination of OSI-906 and U0126 resulted in synergistic effects in 11 out of 13 CRC cell lines tested. This synergy was variably associated with apoptosis or cell cycle arrest in addition to molecular effects on pro-survival pathways. The synergy was also reflected in the in vivo xenograft studies following treatment with the combination of OSI-906 and selumetinib.
Conclusions
Results from this study demonstrate synergistic antiproliferative effects in response to the combination of OSI-906 with a MEK 1/2 inhibitor in CRC cell line models both in vitro and in vivo, which supports the rational combination of OSI-906 with a MEK inhibitor in patients with CRC.
Keywords: IGF1R/IR, OSI-906, U0126, AZD6244, ARRY-142886, selumetinib, MEK, Colon Cancer
INTRODUCTION
The insulin-like growth factor (IGF) system involves complex regulatory networks, which can control numerous developmental and physiological functions including growth, mitosis, apoptosis, and differentiation (1–3). These diverse biological effects are primarily controlled through interactions between the ligands (IGF-1 and IGF-2) and the type 1 IGF receptor (IGF1R) (4). The IGF ligands are modulated by the activity of IGF binding proteins (IGFBP) found in the circulation and extracellular fluids. IGFBPs bind and sequester IGF ligands controlling their availability for receptors. IGF-1 and IGF-2 are usually found in complex with IGFBP-3 and the acid-labile subunit (ALS). Both IGF ligands elicit signals through IGF1R, and IGF-2 can additionally signal through the insulin receptor (IR) (2, 5). Following ligand binding, the intracellular tyrosine kinase domain of IGF1R is auto-phosphorylated prior to recruitment of two adaptor proteins, SRC homology and collagen domain (SHC) and insulin receptor substrate 1 (IRS-1). Subsequent phosphorylation of these adaptor proteins leads to recruitment of other factors, Grb2/SOS and PI3 kinase, thereby activating the mitogen-activated protein kinase (MAPK) and PI3K signaling cascades respectively. These pathways ultimately regulate transcription factors to elicit changes in gene expression, which mediate the biological effects of the IGF system (5).
Many years of research have culminated in a strong association between the IGF1R pathway and cancer. The IGF system has been implicated in multiple aspects of the tumor environment including growth, evasion of apoptosis, and metastasis (6, 7). Epidemiological data suggest that increased levels of circulating IGF-1 result in higher risk for colon, breast, lung, and prostate cancers, which comprise the most prevalent and deadly types of cancer (5, 8). Furthermore, several studies have specifically linked the IGF system to colorectal cancer (CRC). For example, it has been reported that IGF-2 is overexpressed in CRC compared with normal colonic mucosa (3, 9, 10). In addition, high levels of IGF1R and circulating IGF-1 have been linked to metastasis of CRC (11, 12). Altogether these data suggest that IGF1R is an attractive therapeutic target for several tumor types including CRC.
Due to its implication in several tumor types, the IGF1R has been one of the most intensely studied therapeutic targets in cancer research. Nearly 30 compounds targeting IGF1R are being investigated both in vitro and in phase I, II, and III clinical trials. These compounds include both antibodies against IGF1R and inhibitors of the IGF1R intracellular tyrosine kinase domain (13). The tyrosine kinase inhibitor (TKI), OSI-906, is one of these agents. OSI-906 is a selective and orally bioavailable IGF1R/IR TKI which exhibits potent ligand-dependent inhibition of phosphorylation of IGF1R and IR. Furthermore, OSI-906 has been shown to prevent ligand-induced activation of downstream pathways including pAkt, pERK1/2, and p-p70S6K. Phase I and II clinical trials involving OSI-906 are currently in progress (14).
Our prior in vitro data demonstrated the effect of OSI-906 on 27 CRC cell lines. Six cell lines were found sensitive and 21 cell lines resistant to OSI-906. The sensitivity profiles of these cell lines were further confirmed through in vivo xenograft studies (15). The major clinical challenge of drug resistance in developmental cancer therapeutics necessitates investigation into patient-selective single agent and rational combination therapeutic strategies. For that reason we previously performed pathway enrichment analysis of basal gene expression to identify expression differences between the CRC cell lines that were sensitive or resistant to OSI-906. This analysis revealed RAS/RAF/MAPK signaling pathway as one of the top enriched pathways in CRC cell lines that were resistant to OSI-906 (15). Therefore, in this study we examined the efficacy of OSI-906 in combination with a MEK 1/2 inhibitor, either U0126 or selumetinib (AZD6244, ARRY-142886) against CRC cell lines. Based upon our prior analysis, we hypothesized that the interaction between OSI-906 and a MEK inhibitor would be synergistic in CRC cell lines that are resistant to OSI-906. Interestingly, we found that this combination was synergistic regardless of sensitivity to OSI-906. Our results suggest that the combination of OSI-906 with a MEK inhibitor represents a rational and potentially active therapeutic strategy in patients with CRC.
MATERIALS AND METHODS
Drugs
Selumetinib was generously provided by AstraZeneca Pharmaceutical and the National Cancer Institute, NIH. OSI-906 was generously provided by OSI Pharmaceuticals, LLC/Astellas and the National Cancer Institute, NIH. U0126 was obtained from Promega (Madison, WI). Both OSI-906 and U0126 were dissolved in DMSO at 10 mM, and stored at −20°C. For in vivo studies, OSI-906 was dissolved in 25 μmol/L tartaric acid and selumetinib was dissolved in 80%, 0.5% methylcellulose/20% Tween 80 for in vivo use.
Cell Lines and Culture
Twelve of the human CRC cell lines were obtained from the American Type Culture Collection (Manassas, VA). GEO cells were provided by Dr. Fortunato Ciardiello (Cattedra di Oncologia Medica, Dipartimento Medico-Chirurgico di Internistica Clinica e Sperimentale “F Magrassi e A Lanzara,” Seconda Universita’ degli Studi di Napoli, Naples, Italy). GEO cells were cultured in DMEM/F12. All other cells were routinely cultured in RPMI 1640. All medium was supplemented with 10% fetal bovine serum, 1% penicillin-streptomycin, and 1% MEM nonessential amino acids. All cells were kept at 37°C under an atmosphere containing 5% CO2. Cells were routinely tested for the presence of mycoplasma (MycoAlert, Cambrex Bio Science, Baltimore, MD).
Proliferation and Combination Effects
Cell proliferation was analyzed using the sulforhodamine B (SRB) method (16). Cells in a logarithmic growth phase were transferred to 96-well flat bottom plates with lids. One hundred microliter cell suspensions containing 5000 viable cells were plated into each well, and cells were allowed to attach overnight before drug exposure. All cell lines were exposed to OSI-906 (0.3, 0.6, 1.2 μmol/L) and U0126 (0.5, 1.0, 5.0 μmol/L) alone or in all possible combinations for 72 hours. Doses were chosen based on previous published studies with these compounds. (15, 17) After exposure to drugs, cells were fixed with cold 10% trichloroacetic acid for 30 minutes at 4° C. Cells were washed with water and stained with 0.4% SRB (MP Biomedicals, Solon, OH) for 20 min at room temperature, after which cells were washed again with 1% acetic acid and bound SRB was solubilized with 10 mmol/L Tris at room temperature. The optical density (OD) was read on a plate reader (Biotek Synergy 2, Winooski, VT) set at an absorbance wavelength 565 nm. Cell proliferation curves were derived from the raw OD data and results of combinations were analyzed by the Chou and Talalay method (18) using the Calcusyn software program (Biosoft, Cambridge, UK). For each combination, the combination index (CI) was calculated with synergy indicated by a CI<1, additivity by a CI=1, and antagonism by a CI>1.
Caspase 3/7 Activity
Cells were seeded in 96-well white-walled plates at 5,000–10,000 cells/well and allowed to attach for 24 hours prior to drug exposure. Cells were then exposed to OSI-906 (0.6 μmol/L and 1.2 μmol/L) and U0126 (2.5 μmol/L and 5.0 μmol/L) alone and in combination for 12, 24, 48, and 72 hours. Caspases 3 and 7 were measured using a luminometric Caspase-Glo 3/7 assay (Promega, Madison, WI) according to manufacturer’s protocol using a plate reader (Biotek Synergy 2, Winooski, VT). For statistical analysis, each single agent was compared to the appropriate combination and a T-test was performed.
Flow Cytometric Analysis of Cell Cycle Distribution
Cells were plated in 6-well plates and incubated overnight. The cells were then exposed to both OSI-906 (1.2 μmol/L) and U0126 (5 μmol/L) alone or in combination. After 24 hours cells were collected using trypsin and rinsed once in PBS. Cells were then resuspended in Krishan’s stain and allowed to incubate for at least 12 hours at 4°C before analysis by the University of Colorado Cancer Center Flow Cytometry Core Facility.
Immunoprecipitation and Immunoblotting
Five different CRC cell lines were seeded into 6-well plates, allowed to attach overnight, and exposed for 6 hours to OSI-906 (1.2 μmol/L) and U0126 (5 μmol/L) alone and in combination. After treatment, cells were rinsed with PBS and scraped into RIPA lysis buffer containing protease inhibitors, EDTA, NaF, and sodium orthovanadate. Total protein was quantified using the BioRad Dc Protein Assay (BioRad, Hercules, CA). Total protein (40 μg) was loaded on a 4–12% gradient gel, electrophoresed, and then transferred to a nitrocellulose membrane using the I-Blot (Invitrogen, Carlsbad, CA). Membranes were blocked for 1 hour in blocking buffer (0.1% Casein solution in 0.2X PBS). Membranes were then incubated overnight at 4°C in blocking buffer plus 0.1% Tween-20 with one of the following primary antibodies: pAkt, Akt, pERK, ERK, pS6RP, S6RP, p4eBP1, 4eBP1, pMDM2, MDM2, PARP, LC3B or Actin (All from Cell Signaling, Beverly, MA except MDM2 from Santa Cruz Biotechnology, Santa Cruz, CA). Blots were then washed 3×10 minutes in 1X PBS containing 0.1% Tween-20 and incubated with the appropriate secondary goat anti-rabbit and goat anti-mouse IgG (H+L) DyLight™ conjugated antibodies (Thermo Scientific, Rockford, IL) at a 1:15,000 dilution for 1 hour at room temperature. Following 3×20 minute washes, blots were developed using the Odyssey Infrared Imaging System (LI-COR Biosciences, Lincoln, NE).
In vivo xenograft studies
Five to six-week-old female athymic nude mice (Harlan Sprague Dawley, Indianapolis, IN) were used. Mice were caged in groups of 5, kept on a 12-hour light/dark cycle, and provided with sterilized food and water ad libitum. Animals were allowed to acclimate for at least 7 days before any handling. For the CRC cell line derived xenografts, SW480 or HCT15 cells in logarithmic growth phase were harvested with 0.25% Trypsin/EDTA, pelleted by centrifugation, resuspended in a 1:1 mixture of serum-free RPMI 1640 and Matrigel (BD Biosciences, Bedford, MA), and injected (5×10⁶ cells in 100 μL) subcutaneously into the flank of 20 mice (8–10 evaluable tumor per group). The human patient-derived xenograft CUCRC006 was generated as previously described (17). Briefly, a peritoneal metastasis tumor specimen was collected at the time of surgery from a consenting patient at the University of Colorado Hospital. Tumor material not needed for histopathologic analysis was cut into pieces 2 to 3 mm3 in size, coated in Matrigel, and implanted subcutaneously. After tumors were expanded through the F3 generation, they were injected into the left and right flanks of approximately 60 mice (30 evaluable tumors per group). When the average tumor size of patient- or cell line-derived xenografts reached a volume of approximately 150 mm3, mice were randomized into the vehicle group, OSI-906 group, selumetinib group, or combination group. Mice were monitored daily for signs of toxicity and weighed twice weekly. Treatment was administered once daily (40 mg/kg OSI-906) or twice daily (25 mg/kg selumetinib) by oral gavage, and tumor size was evaluated twice per week with caliper measurements, using the Study Director software package (Studylog Systems, South San Francisco, CA). Tumor volume was calculated with the equation: volume = (length × width2) × 0.52. Tumor growth inhibition (TGI) was calculated from the average tumor volume of the treated (Vt) and vehicle control (Vvc) groups, with the equation: TGI = 1 − (Vt/Vvc).
Xenograft studies were conducted in accordance with the NIH guidelines for the care and use of laboratory animals in a facility accredited by the American Association for Accreditation of Laboratory Animal Care, and received approval from University of Colorado Institutional Animal Care and Use Committee prior to initiation. Collection of patient tumor tissue at the University of Colorado hospital was performed under a Colorado Multi-Institutional Review Board (COMIRB) approved protocol.
Immunohistochemistry
Immunohistochemistry was performed in the University of Colorado Cancer Center Pathology Core Lab. Five micron thick paraffin sections were deparaffinized, antigens unmasked and immunohistochemically stained for Ki-67 (Neomarkers/Thermo Scientific, Waltham, MA; rabbit monoclonal SP6; cat# RM-9106-SO; dilution 1:500 in TBST + 1% BSA w/v). Antigens were revealed in pH 9.5 BORG solution (Biocare Medical, Concord, CA) for 5 minutes at 125°C (22psi; Decloaking chamber, Biocare) with a 10 minute ambient cool down. Immunodetection was performed on the NexES stainer (Ventana Medical Systems, Tucson, AZ) at an operating temperature of 37°C with a primary antibody incubation time of 32 minutes. Antibodies were detected with a modified I-VIEW DAB (Ventana) detection kit. The I-VIEW secondary antibody and enzyme were replaced with a species specific rabbit conjugated polymer (Rabbit ImmPress; cat# MP-7401; Vector Labs, Carpinteria, CA; Full Strength in place of the secondary antibody, 50% Strength diluted in PBS pH 7.6 in place of the SA-HRP, 8 minutes each). All sections were counterstained in Acidified Harris hematoxylin for 1.5 minutes, blued in 1% ammonium hydroxide (v/v), dehydrated in graded alcohols, cleared in xylene and coverglass mounted using synthetic resin.
Statistical methods
Statistical analysis was performed using GraphPad Prism Software (La Jolla, CA). For comparisons of two groups an un-paired t-test was performed. All comparisons with p < 0.05 are considered statistical significant. A one-way analysis of variance (ANOVA) was used to determine whether the means were significantly different between the groups. If the overall means were significantly different, we carried out a pair-wise comparison. The p values were adjusted using Tukey’s method for multiple comparisons. SE of the mean was indicated for each value by a bar.
RESULTS
The effects of OSI-906 and U0126 as single agents on proliferation of CRC cell lines
Initially, a panel of 27 CRC cell lines was exposed to OSI-906 (0–5 μmol/L). Cell lines considered sensitive (S) to OSI-906 had IC50≤1.5 μmol/L and resistant (R) cell lines had no IC50 found up to 5 μmol/L (15). As shown in Figure 1A and S1A, 13 of these cell lines were further investigated for this study. Similarly a panel of the same 13 CRC cell lines was exposed to U0126 (0–20 μmol/L) (Figure 1B and S1B). We did not consider any of the cell lines sensitive to U0126 as IC50 values were largely >1.5 μmol/L. Mutational status for KRAS, BRAF and PIK3CA did not correlate to sensitivity to either agent.
Figure 1.
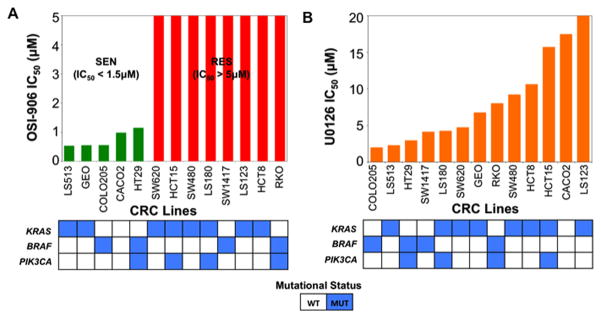
Proliferative effects on 13 CRC cell lines plotted as IC50 following exposure to (A) OSI-906 (0–5 μmol/L), or (B) U0126 (0–20 μmol/L). In the OSI-906 graph, green and red bars represent sensitive (IC50 < 1.5 μmol/L) and resistant (IC50 > 5 μmol/L) cell lines, respectively. Mutational status of KRAS, BRAF and PIK3CA of these cell lines were colored as blue boxes.
The interaction between OSI-906 and U0126 is synergistic in CRC cell lines
Previously, Affymetrix U133 Plus 2.0 gene arrays were performed on four sensitive and five OSI-906 resistant CRC cell lines to assess basal gene expression. Pathway enrichment analysis of this data revealed that the RAS/RAF/MAPK signaling pathway was among the top enriched pathways in OSI-906 resistant CRC cell lines (15). The core genes upregulated were found at different levels throughout the classical MAPK pathway including ligands, receptors, and key downstream signaling proteins. For example, among the core genes found upregulated were: FGF, PDGF, FGFR, RAS, RAF1, and MEK2 (Figure 2). We therefore hypothesized that the combination of U0126 with OSI-906 would induce synergistic antiproliferative effects in CRC cell lines that were resistant to OSI-906. Thirteen CRC cell lines were chosen for exposure to the combination with a range of responsiveness to OSI-906 or U0126. OSI-906 and U0126 displayed a synergistic interaction in 11 out of the 13 CRC cell lines tested regardless of sensitivity to either agent (Figures 3 and S2–4). In these 11 cell lines, nearly all CI values were less than one and several cell lines displayed strong synergy. For example, Colo205 CRC cells exhibited a range of CI values between 0.09–0.40 following exposure to all combinations of OSI-906 and U0126. Two other cell lines, RKO and GEO, showed variable combination effects (CI values ranging from 0.7 – 1.6).
Figure 2.
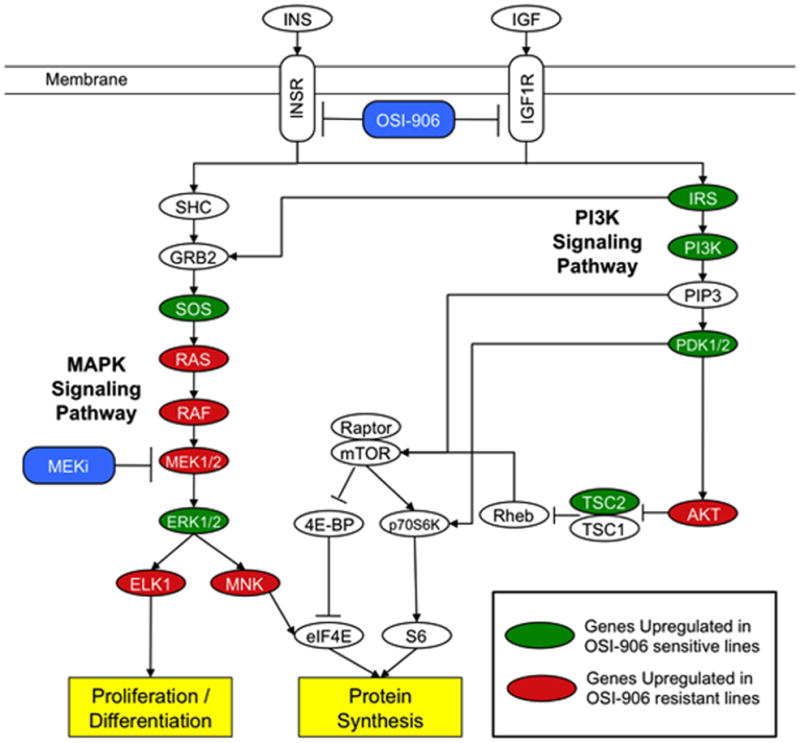
MAPK signaling pathway is upregulated in OSI-906 resistant CRC lines. Gene set enrichment analysis revealed that MAPK signaling pathway is upregulated in OSI-906 resistant lines, suggesting a rational combination of OSI-906 with a MEK inhibitor (MEKi) might reveal synergistic effects in OSI-906 resistant cell lines. Green and red ovals represent genes upregulated in OSI-906 sensitive and resistant lines, respectively. This pathway is modified from the KEGG insulin signaling pathway previously identified as one of the top enriched pathways in OSI-906 resistant CRC lines (15).
Figure 3.
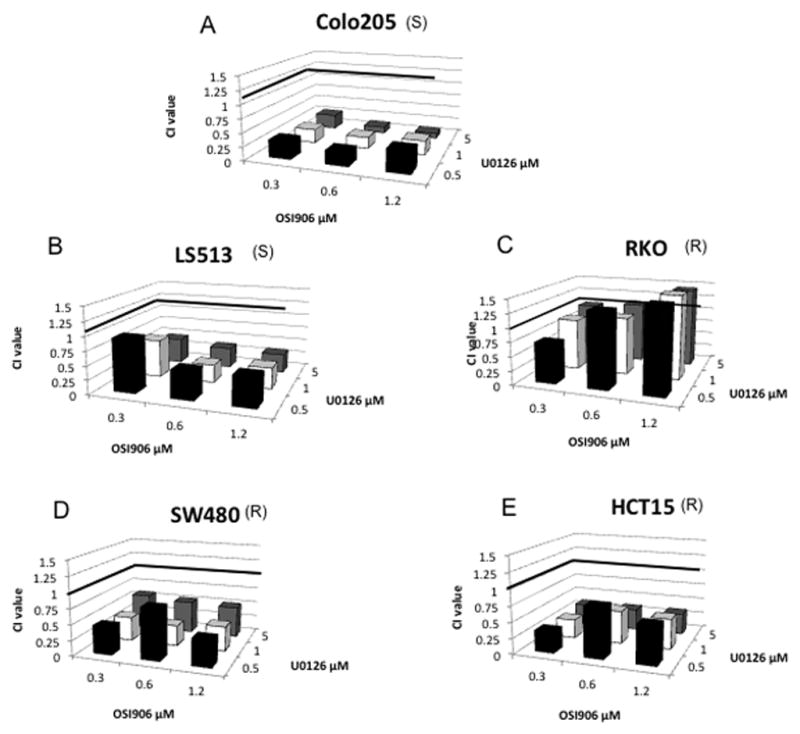
Proliferative effects of OSI-906 combined with U0126 on (A) Colo205 (KRASWT/BRAFMT/PIK3CAWT), (B) LS513 (KRASMT/BRAFWT/PIK3CAWT), (C) RKO (KRASWT/BRAFMT/PIK3CAMT), (D) SW480 (KRASMT/BRAFWT/PIK3CAWT), and (E) HCT15 (KRASMT/BRAFWT/PIK3CAMT) CRC cell lines. Cells were exposed to OSI-906 and U0126 for 72 h. CI values were generated by Calcusyn, the Chou and Talalay method for assessing drug interactions. S and R represent sensitivity or resistance to OSI-906. Cell lines are listed in order from most sensitive to most resistant to U0126.
Apoptosis is enhanced following exposure to the combination of OSI-906 and U0126 in CRC cell lines
Several studies have demonstrated induction of apoptosis in response to inhibition of the MEK pathway (19–21). Therefore, caspase 3/7 activity was measured in all thirteen CRC cell lines to identify whether there was induction of apoptosis following exposure to U0126 and/or the combination. Interestingly, only the Colo205 cell line which is inherently sensitive to OSI-906 demonstrated a synergistic induction of apoptosis following combination treatment, which was associated with PARP cleavage (Figures 4, S5, S6).
Figure 4.
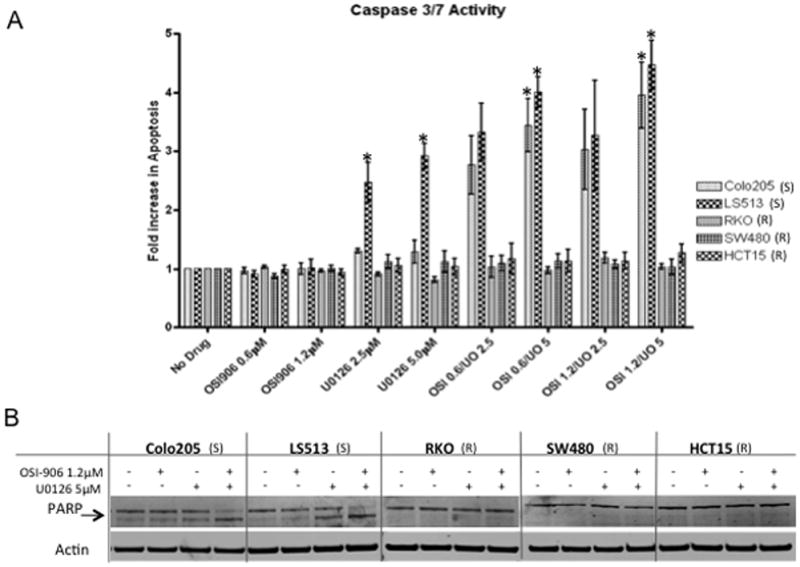
(A) Effect of OSI-906 and U0126 on Caspase 3/7 activity. Cells were exposed to OSI-906 and U0126 alone or in all possible combinations for 24 h. (All * indicate p<0.05) (B) Effect of OSI-906 and U0126 on PARP cleavage (arrow indicates cleaved fragment). S and R represent sensitivity or resistance to OSI-906. Cell lines are listed in order from most sensitive to most resistant to U0126.
G0/G1 cell cycle arrest is induced in CRC cells exposed to OSI-906, U0126 and the combination
Inhibitors of IGF-1R and RAS/RAF/MAPK signaling pathways are known to impact cell cycle through G0/G1 arrest (19, 22–26). Thus, assessment of cell cycle distribution was carried out using flow cytometric analysis in the CRC cell lines. Five CRC cell lines were chosen for this analysis, including Colo205 and LS513 cells which were associated with apoptosis in response to combination treatment, and the SW480 and HCT15 cell lines that exhibited strong synergy, but no apoptosis. In general, we observed G0/G1 arrest with OSI-906 and U0126 that was maintained in the combination (Figure S7). No differential effects on the cell cycle were observed to differentiate the effects of synergy associated with proliferation.
The combination of OSI-906 and U0126 inhibits pro-survival pathways and affects MDM2 phosphorylation
OSI-906 and U0126 inhibit well characterized downstream effects on their respective pathways. OSI-906 has been shown to decrease IGF1R, IR, AKT, ERK, and p70S6K phosphorylation (14), while U0126 inhibits phosphorylation of MEK and ERK (27, 28). To validate the effects of these two agents and look for evidence of synergy, modulation of downstream targets in the MAPK and PI3K pathways were analyzed (Figure 5A and S8). Phosphorylation of AKT or ERK was decreased with exposure to OSI-906 or U0126, respectively (Figure 5); although this was variable among the cell lines and there were more consistent effects on p-ERK (Figure S8). Interestingly, these effects were not observed in the RKO cells that were resistant to OSI-906 and did not exhibit synergy in the combination. A striking effect observed in the sensitive cell lines undergoing apoptosis with the combination (Colo205, LS513) was the loss of pS6RP with a subtle decrease in 4eBP1. Due to the reported relationship between the PI3K/AKT/mTOR pathway and MDM2 regulation (29), we also assessed MDM2 phosphorylation following a 24-hour exposure to the combination. We observed a modest decrease in pMDM2 in the combination in the two sensitive cell lines exhibiting apoptosis, but not in the other cell lines exhibiting additivity or synergy but not apoptosis.
Figure 5.
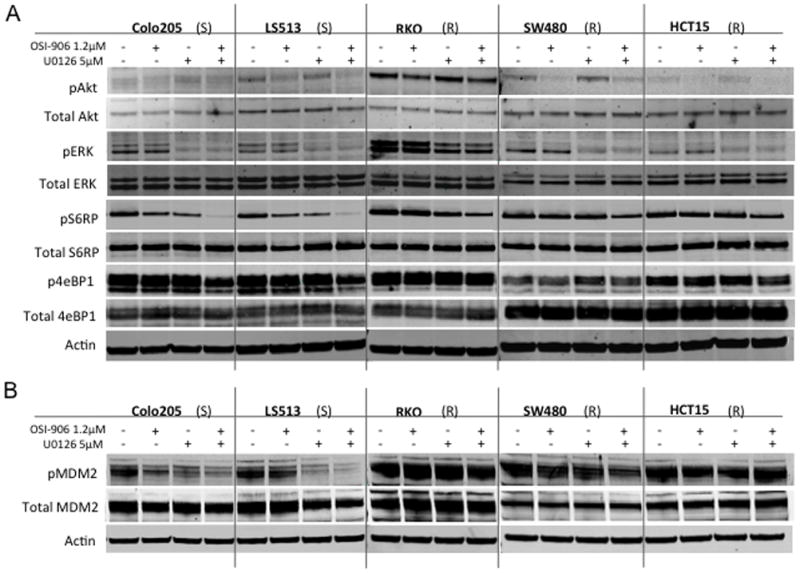
Effect of OSI-906 and U0126 alone and in combination on downstream effectors. (A) Five CRC cell lines were exposed to OSI-906 and U0126 for 6 h. (B) Five CRC cell lines were exposed to OSI-906 and U0126 for 24 h. S and R represent sensitivity or resistance to OSI-906. Cell lines are listed in order from most sensitive to most resistant to U0126.
Confirmation of antitumor effects using OSI-906 and selumetinib in vivo
To further investigate this combination, we next conducted in vivo experiments. Selumetinib was used for the in vivo studies as this agent has better anti-tumor effects in vivo and is available through the Cancer Therapy Evaluation Program (CTEP). The combination was initially tested in HCT15 and SW480 CRC cell line derived xenografts. In the HCT15 xenograft model, neither OSI-906 nor selumetinib as a monotherapy had a statistically significant effect on tumor growth when compared to vehicle, after 20 days of treatment (TGI = 38% and 48% for OSI-906 and selumetinib, respectively). However, as depicted in Figure 6A, treatment with the combination resulted in statistically significant tumor growth inhibition (TGI = 81%, p = 0.0007) as compared to vehicle. A similar effect was observed in the SW480 model but to a lesser extent (Supplement Figure S9).
Figure 6.
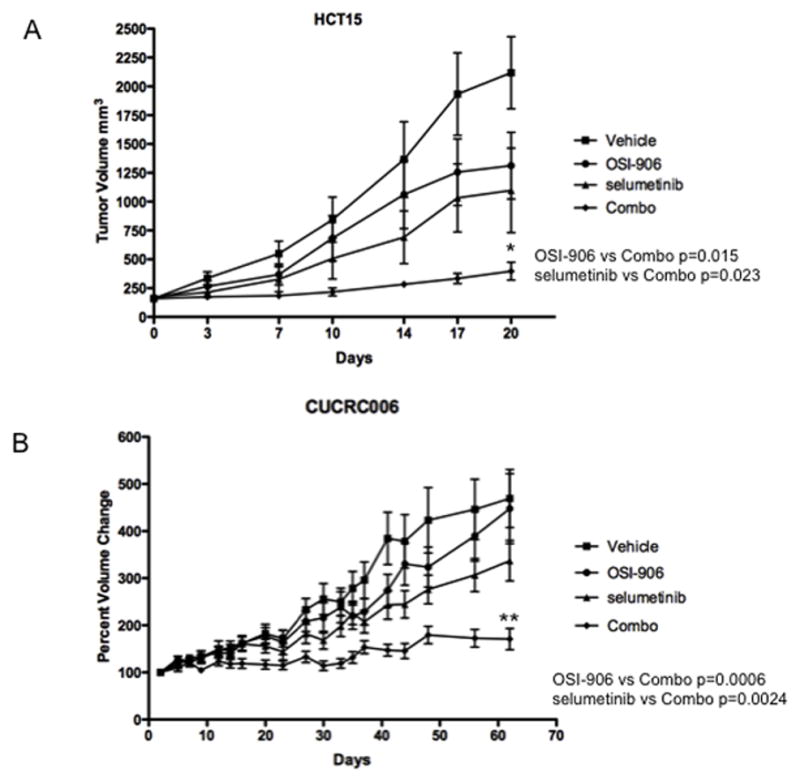
Effect of OSI-906 and selumetinib alone and in combination in athymic nude mice. Mice were treated with drugs for 20 days. Tumors treated with the combination of OSI-906 and selumetinib were significantly inhibited in comparison to the control, single agent OSI-906, and single agent selumetinib groups (ANOVA p<0.05). *Indicates significant difference between combination treatment and single agent or untreated controls. (A) HCT15 (KRASMT/BRAFWT/PIK3CAMT); (B) CUCRC006 (KRASMT/BRAFWT/PIK3CAWT).
We also tested the combination in a patient-derived tumor xenograft (PDTX) model. CUCRC006 (KRASMT, BRAFWT and PIK3CAWT) responded very similarly to the HCT15 xenograft (Figure 6B). After treatment for 62 days, neither single agent demonstrated a statistically significant effect on tumor growth (TGI = 4.8% and 28% for OSI-906 and AZD-6244, respectively), while the combination treatment did when compared to the vehicle or either single agent group (TGI = 64%, p < 0.0002). As a comparison, this PDTX model had a TGI of 34% for irinotecan (Data not shown). Concordant with these results was IHC staining for % of Ki67 positive cells: 90% (vehicle), 75% (selumetinib), 80% (OSI-906) and 30% for the combination (Data not shown).
DISCUSSION
Several laboratory and epidemiological studies have revealed the importance of the IGF signaling pathway in colorectal cancer (30). While initial clinical trials involving IGF1R inhibitors were encouraging, the latest combination studies have shown varied results (13, 31, 32). In recent clinical trials with other molecularly targeted agents, low response rates and acquired resistance have been observed. Evidence of resistance has already been discovered following treatment with inhibitors of BCR-ABL, and EGFR, among others (33). Therefore, multiple studies are investigating the mechanisms of resistance to specific targeted agents, including our previous investigation into predictive biomarkers for sensitivity to OSI-906 (15, 34–36). These studies can also provide evidence for rational combinations, which may result in more effective clinical therapeutic regimens and successful patient outcomes.
The combination of an IGF1R inhibitor with a MEK inhibitor has recently generated wide interest, yet few studies of this type have been published to date. Buck et al. (37) briefly explored the combination of PQIP (IGF1R-TKI) and PD98059 (MEK1 inhibitor) in colorectal, pancreatic, and lung cancer cell lines using the Bliss additivity model. In addition, examination of the combination of an IGF1R antibody with U0126 has been assessed in hematopoietic cells (38). Based on previous study, we investigated the combination of an IGF1R/IR tyrosine kinase inhibitor, OSI-906, and a MEK 1/2 inhibitor (either U0126 or selumetinib) in OSI-906 resistant colorectal cancer cell lines (15). We hypothesized that cells lines resistant to OSI-906 would be a more likely to have a synergistic response when used in combination. However this study revealed sensitivity/resistance to OSI-906 did not predict synergistic response. We additionally evaluated trends in U0126 sensitivity, and mutational statuses of KRAS, BRAF, and PIK3CA (previously sequenced in our CRC cell lines) (15). However, there were no apparent trends that predicted a synergistic response.
To further delineate the interaction between these drugs in combination, we first assessed induction of apoptosis. Bertrand et al. (38) reported that apoptosis was enhanced in response to the combination of an IGF1R antibody and U0126 in hematopoietic stem cells. Two CRC cell lines, out of our thirteen tested, similarly indicated an induction of apoptosis in response to the combination of OSI-906 and U0126. However, only one them (Colo205), which is inherently sensitive to OSI-906 demonstrated synergistic induction of apoptosis.
Due to the lack of apoptosis and yet the presence of synergy, cell cycle effects were also assessed by flow cytometry. Several studies have shown induction of G0/G1 arrest following exposure to IGF1R and MEK inhibitors as single agents (19, 22–26). However, evaluation of the cell cycle following treatment with both an IGF1R inhibitor and a MEK inhibitor in combination has not been published. Our cell cycle analysis did not generally reveal mechanisms of synergy. Combination treatment did not demonstrate any increase in cell cycle arrest as compared to single agent effects with the exception of one cell line. In the OSI-906 resistant cell line, HCT15 cells did exhibit a small induction of G0/G1 arrest in combination treated cells. Similar results have been recently described with combinations of PIK3CA and MEK inhibitors where there was an enhanced cell cycle arrest at G0/G1 following combination treatments (41–44). One possible explanation for the lack of cell cycle arrest observed in this study could be the fact that three of five cell lines evaluated exhibited strong single agent effects with 90% arrest in G0/G1.
Given that both OSI-906 and U0126 are inhibitors of pro-survival signaling cascades, their actions as such have been characterized in previous reports (14, 27, 28). In our CRC cell lines it appears that IGF1R inhibition primarily acts through the PI3K/AKT/mTOR pathway and not the RAS/RAF/MAPK signaling pathway, as expected; whereas U0126 exhibited inhibition of MEK/ERK. Combination effects on phosphorylation of both AKT and ERK were comparable to those observed in single agent exposures. Interestingly, dephosphorylation of S6RP was observed when the drugs were used in combination, which has been previously described (45). However, others have noted activation of AKT by MEK inhibitors and ERK activation by PI3K inhibitors (45–49). These data clearly support the fact that there is crosstalk between the RAS/RAF/MAPK and at PI3K/AKT/mTOR signaling pathways; however, this relationship is not clearly defined and perhaps is cell-context dependent.
Several studies have reported MDM2-mediated apoptosis in response to inhibiting PI3K/AKT/mTOR signaling pathway (29, 50, 51). In this study, two of the cell lines (Colo205 and LS513) demonstrated a reduction of MDM2 in response to combination treatment and interestingly, both are wild type for PIK3CA. These results are intriguing and warrant further study into the PI3K dependence of the p53/MDM2 axis.
Lastly, we tested the efficacy of OSI-906 with a clinical MEK 1/2 inhibitor, selumetinib, in athymic nude mice. We conducted the in vivo studies using both HCT15 and SW480 cell lines, which both displayed synergy without apoptosis in response to the combination of OSI-906 and U0126 in vitro. Despite this lack of apoptosis in vitro, the combination of OSI-906 and selumetinib demonstrated striking tumor growth inhibition following 30 days of treatment in mice. This was confirmed with a reduction in Ki67 staining. Next both agents were tested in our patient-derived tumor xenograft model (PDTX). These PDTX models have certain advantages over cancer cell line derived xenograft models (52). They closely recapitulate the heterogeneity of human tumors and are excellent models to study stromal–tumor interactions and drug efficacy testing (52). Our PDTX model confirmed our previous findings that the combination had significant anti-tumor activity when compared to the vehicle or either single agent, and the Ki-67 staining was, again, markedly reduced in the combination. These in vivo studies would rationally support clinical investigation into the combination of an IGF1R inhibitor and a MEK inhibitor in patients with CRC.
In summary, initial results from clinical trials involving IGF1R inhibitors are mixed (13, 31, 32), and likely reflect either the lack of patient selection strategies and/or recognition of compensatory resistance pathways. Thus, studies such as this are needed to develop rational, mechanism-based combinations that may be translated to the clinic and yield improved benefit for patients. One ongoing challenge is how to select patients for combination therapy since the magnitude of synergistic effects observed in preclinical models can vary widely and insights into mechanisms of apoptosis may not be apparent. However, as next-generation sequencing analysis becomes more integrated into the characterization of preclinical models and patient response profiles, the ability to select particular molecular subtypes for rational combinations such as IGF1R/IR and MEK blockade in CRC may become possible.
Supplementary Material
Statement of Translational Relevance.
The insulin-like growth factor 1 receptor (IGF1R)/insulin receptor (IR) pathway has been implicated in cancer and therefore has been a target of interest in cancer therapeutics. A number of agents targeting this pathway have been designed and tested in clinical trials. However, despite some early successes, many of them have failed. Overcoming resistance and/or developing rational combinations are now the major focus for these agents and other targeted agents. This study describes the addition of a MEK inhibitor in overcoming resistance to an IGF1R/IR inhibitor in colorectal cell lines and in human colorectal cancer xenograft models; thereby identifying this as a rational combination for clinical evaluation.
Acknowledgments
This is study was funded in part by:
K12 Institutional Training Award (Paul Calabresi Award for Clinical Oncology) K12-CA086913-08
Footnotes
Data has been presented in part at:
AACR/NCI/EORTC International Conference in Molecular Targets and Cancer Therapeutics, Oct 2009, Boston MA
AACR/NCI/EORTC International Conference in Molecular Targets and Cancer Therapeutics, Nov 2011, San Francisco CA
- E. Erin Genova, HTL(ASCP)CMQIHC and Kathy Lux, HT(ASCP) of the University of Colorado Denver Cancer Center Research Histology Core.
- Cancer Center Support Grant (P30CA046934)
References
- 1.Froesch ER, Hussain MA, Schmid C, Zapf J. Insulin-like growth factor I: physiology, metabolic effects and clinical uses. Diabetes/metabolism reviews. 1996;12:195–215. doi: 10.1002/(SICI)1099-0895(199610)12:3<195::AID-DMR164>3.0.CO;2-G. [DOI] [PubMed] [Google Scholar]
- 2.Butler AA, Yakar S, Gewolb IH, Karas M, Okubo Y, LeRoith D. Insulin-like growth factor-I receptor signal transduction: at the interface between physiology and cell biology. Comparative biochemistry and physiology. 1998;121:19–26. doi: 10.1016/s0305-0491(98)10106-2. [DOI] [PubMed] [Google Scholar]
- 3.Pollak MN, Schernhammer ES, Hankinson SE. Insulin-like growth factors and neoplasia. Nature reviews. 2004;4:505–18. doi: 10.1038/nrc1387. [DOI] [PubMed] [Google Scholar]
- 4.Jerome L, Shiry L, Leyland-Jones B. Deregulation of the IGF axis in cancer: epidemiological evidence and potential therapeutic interventions. Endocrine-related cancer. 2003;10:561–78. doi: 10.1677/erc.0.0100561. [DOI] [PubMed] [Google Scholar]
- 5.LeRoith D, Roberts CT., Jr The insulin-like growth factor system and cancer. Cancer letters. 2003;195:127–37. doi: 10.1016/s0304-3835(03)00159-9. [DOI] [PubMed] [Google Scholar]
- 6.Samani AA, Yakar S, LeRoith D, Brodt P. The role of the IGF system in cancer growth and metastasis: overview and recent insights. Endocrine reviews. 2007;28:20–47. doi: 10.1210/er.2006-0001. [DOI] [PubMed] [Google Scholar]
- 7.Baserga R, Peruzzi F, Reiss K. The IGF-1 receptor in cancer biology. International journal of cancer. 2003;107:873–7. doi: 10.1002/ijc.11487. [DOI] [PubMed] [Google Scholar]
- 8.Jemal A, Siegel R, Ward E, Hao Y, Xu J, Thun MJ. Cancer statistics, 2009. CA: a cancer journal for clinicians. 2009;59:225–49. doi: 10.3322/caac.20006. [DOI] [PubMed] [Google Scholar]
- 9.Zhang L, Zhou W, Velculescu VE, Kern SE, Hruban RH, Hamilton SR, et al. Gene expression profiles in normal and cancer cells. Science (New York, NY) 1997;276:1268–72. doi: 10.1126/science.276.5316.1268. [DOI] [PubMed] [Google Scholar]
- 10.Comprehensive molecular characterization of human colon and rectal cancer. Nature. 2012;487:330–7. doi: 10.1038/nature11252. [DOI] [PMC free article] [PubMed] [Google Scholar]
- 11.Hakam A, Yeatman TJ, Lu L, Mora L, Marcet G, Nicosia SV, et al. Expression of insulin-like growth factor-1 receptor in human colorectal cancer. Human pathology. 1999;30:1128–33. doi: 10.1016/s0046-8177(99)90027-8. [DOI] [PubMed] [Google Scholar]
- 12.Wu Y, Yakar S, Zhao L, Hennighausen L, LeRoith D. Circulating insulin-like growth factor-I levels regulate colon cancer growth and metastasis. Cancer research. 2002;62:1030–5. [PubMed] [Google Scholar]
- 13.Gualberto A, Pollak M. Emerging role of insulin-like growth factor receptor inhibitors in oncology: early clinical trial results and future directions. Oncogene. 2009;28:3009–21. doi: 10.1038/onc.2009.172. [DOI] [PubMed] [Google Scholar]
- 14.Mulvihill MJ, Cooke A, Rosenfeld-Franklin M, Buck E, Foreman K, Landfair D, et al. Discovery of OSI-906: a selective and orally efficacious dual inhibitor of the IGF-1 receptor and insulin receptor. Future medicinal chemistry. 2009;1:1153–71. doi: 10.4155/fmc.09.89. [DOI] [PubMed] [Google Scholar]
- 15.Pitts TM, Tan AC, Kulikowski GN, Tentler JJ, Brown AM, Flanigan SA, et al. Development of an Integrated Genomic Classifier for a Novel Agent in Colorectal Cancer: Approach to Individualized Therapy in Early Development. Clin Cancer Res. 2010:16. doi: 10.1158/1078-0432.CCR-09-3191. [DOI] [PMC free article] [PubMed] [Google Scholar]
- 16.Papazisis KT, Geromichalos GD, Dimitriadis KA, Kortsaris AH. Optimization of the sulforhodamine B colorimetric assay. Journal of immunological methods. 1997;208:151–8. doi: 10.1016/s0022-1759(97)00137-3. [DOI] [PubMed] [Google Scholar]
- 17.Tentler JJ, Nallapareddy S, Tan AC, Spreafico A, Pitts TM, Morelli MP, et al. Identification of predictive markers of response to the MEK1/2 inhibitor selumetinib (AZD6244) in K-ras-mutated colorectal cancer. Molecular cancer therapeutics. 2010;9:3351–62. doi: 10.1158/1535-7163.MCT-10-0376. [DOI] [PMC free article] [PubMed] [Google Scholar]
- 18.Chou T-C, Talalay P. Analysis of combined drug effects: a new look at a very old problem. Trends Pharmacol Sci. 1983;4:450–4. [Google Scholar]
- 19.Ciuffreda L, Del Bufalo D, Desideri M, Di Sanza C, Stoppacciaro A, Ricciardi MR, et al. Growth-inhibitory and antiangiogenic activity of the MEK inhibitor PD0325901 in malignant melanoma with or without BRAF mutations. Neoplasia (New York, NY) 2009;11:720–31. doi: 10.1593/neo.09398. [DOI] [PMC free article] [PubMed] [Google Scholar]
- 20.Nishioka C, Ikezoe T, Yang J, Komatsu N, Koeffler HP, Yokoyama A. Blockade of MEK signaling potentiates 5-Aza-2′-deoxycytidine-induced apoptosis and upregulation of p21(waf1) in acute myelogenous leukemia cells. International journal of cancer. 2009;125:1168–76. doi: 10.1002/ijc.24377. [DOI] [PubMed] [Google Scholar]
- 21.Zhang YJ, Tian XQ, Sun DF, Zhao SL, Xiong H, Fang JY. Combined inhibition of MEK and mTOR signaling inhibits initiation and progression of colorectal cancer. Cancer investigation. 2009;27:273–85. doi: 10.1080/07357900802314893. [DOI] [PubMed] [Google Scholar]
- 22.Hopfner M, Sutter AP, Huether A, Baradari V, Scherubl H. Tyrosine kinase of insulin-like growth factor receptor as target for novel treatment and prevention strategies of colorectal cancer. World J Gastroenterol. 2006;12:5635–43. doi: 10.3748/wjg.v12.i35.5635. [DOI] [PMC free article] [PubMed] [Google Scholar]
- 23.Mukohara T, Shimada H, Ogasawara N, Wanikawa R, Shimomura M, Nakatsura T, et al. Sensitivity of breast cancer cell lines to the novel insulin-like growth factor-1 receptor (IGF-1R) inhibitor NVP-AEW541 is dependent on the level of IRS-1 expression. Cancer letters. 2009;282:14–24. doi: 10.1016/j.canlet.2009.02.056. [DOI] [PubMed] [Google Scholar]
- 24.Sabbatini P, Rowand JL, Groy A, Korenchuk S, Liu Q, Atkins C, et al. Antitumor activity of GSK1904529A, a small-molecule inhibitor of the insulin-like growth factor-I receptor tyrosine kinase. Clin Cancer Res. 2009;15:3058–67. doi: 10.1158/1078-0432.CCR-08-2530. [DOI] [PubMed] [Google Scholar]
- 25.Friday BB, Yu C, Dy GK, Smith PD, Wang L, Thibodeau SN, et al. BRAF V600E disrupts AZD6244-induced abrogation of negative feedback pathways between extracellular signal-regulated kinase and Raf proteins. Cancer research. 2008;68:6145–53. doi: 10.1158/0008-5472.CAN-08-1430. [DOI] [PubMed] [Google Scholar]
- 26.Liu D, Xing M. Potent inhibition of thyroid cancer cells by the MEK inhibitor PD0325901 and its potentiation by suppression of the PI3K and NF-kappaB pathways. Thyroid. 2008;18:853–64. doi: 10.1089/thy.2007.0357. [DOI] [PMC free article] [PubMed] [Google Scholar]
- 27.Rice PL, Goldberg RJ, Ray EC, Driggers LJ, Ahnen DJ. Inhibition of extracellular signal-regulated kinase 1/2 phosphorylation and induction of apoptosis by sulindac metabolites. Cancer research. 2001;61:1541–7. [PubMed] [Google Scholar]
- 28.Favata MF, Horiuchi KY, Manos EJ, Daulerio AJ, Stradley DA, Feeser WS, et al. Identification of a novel inhibitor of mitogen-activated protein kinase kinase. The Journal of biological chemistry. 1998;273:18623–32. doi: 10.1074/jbc.273.29.18623. [DOI] [PubMed] [Google Scholar]
- 29.Fang J, Meng Q, Vogt PK, Zhang R, Jiang BH. A downstream kinase of the mammalian target of rapamycin, p70S6K1, regulates human double minute 2 protein phosphorylation and stability. J Cell Physiol. 2006;209:261–5. doi: 10.1002/jcp.20749. [DOI] [PubMed] [Google Scholar]
- 30.Donovan EA, Kummar S. Role of insulin-like growth factor-1R system in colorectal carcinogenesis. Crit Rev Oncol Hematol. 2008;66:91–8. doi: 10.1016/j.critrevonc.2007.09.003. [DOI] [PMC free article] [PubMed] [Google Scholar]
- 31.Atzori F, Traina TA, Ionta MT, Massidda B. Targeting insulin-like growth factor type 1 receptor in cancer therapy. Target Oncol. 2009;4:255–66. doi: 10.1007/s11523-009-0123-z. [DOI] [PubMed] [Google Scholar]
- 32.Zha J, Lackner MR. Targeting the Insulin-like Growth Factor Receptor-1R Pathway for Cancer Therapy. Clin Cancer Res. 2010 doi: 10.1158/1078-0432.CCR-09-2232. [DOI] [PubMed] [Google Scholar]
- 33.Stegmeier F, Warmuth M, Sellers WR, Dorsch M. Targeted Cancer Therapies in the Twenty-First Century: Lessons From Imatinib. Clin Pharmacol Ther. 2010 doi: 10.1038/clpt.2009.297. [DOI] [PubMed] [Google Scholar]
- 34.Ring A, Dowsett M. Mechanisms of tamoxifen resistance. Endocrine-related cancer. 2004;11:643–58. doi: 10.1677/erc.1.00776. [DOI] [PubMed] [Google Scholar]
- 35.Shah NP, Tran C, Lee FY, Chen P, Norris D, Sawyers CL. Overriding imatinib resistance with a novel ABL kinase inhibitor. Science (New York, NY) 2004;305:399–401. doi: 10.1126/science.1099480. [DOI] [PubMed] [Google Scholar]
- 36.Cappuzzo F, Varella-Garcia M, Finocchiaro G, Skokan M, Gajapathy S, Carnaghi C, et al. Primary resistance to cetuximab therapy in EGFR FISH-positive colorectal cancer patients. Br J Cancer. 2008;99:83–9. doi: 10.1038/sj.bjc.6604439. [DOI] [PMC free article] [PubMed] [Google Scholar]
- 37.Buck E, Eyzaguirre A, Rosenfeld-Franklin M, Thomson S, Mulvihill M, Barr S, et al. Feedback mechanisms promote cooperativity for small molecule inhibitors of epidermal and insulin-like growth factor receptors. Cancer research. 2008;68:8322–32. doi: 10.1158/0008-5472.CAN-07-6720. [DOI] [PubMed] [Google Scholar]
- 38.Bertrand FE, Steelman LS, Chappell WH, Abrams SL, Shelton JG, White ER, et al. Synergy between an IGF-1R antibody and Raf/MEK/ERK and PI3K/Akt/mTOR pathway inhibitors in suppressing IGF-1R-mediated growth in hematopoietic cells. Leukemia. 2006;20:1254–60. doi: 10.1038/sj.leu.2404217. [DOI] [PubMed] [Google Scholar]
- 39.Ryan BM, O’Donovan N, Duffy MJ. Survivin: a new target for anti-cancer therapy. Cancer treatment reviews. 2009;35:553–62. doi: 10.1016/j.ctrv.2009.05.003. [DOI] [PubMed] [Google Scholar]
- 40.Pyrko P, Soriano N, Kardosh A, Liu YT, Uddin J, Petasis NA, et al. Downregulation of survivin expression and concomitant induction of apoptosis by celecoxib and its non-cyclooxygenase-2-inhibitory analog, dimethyl-celecoxib (DMC), in tumor cells in vitro and in vivo. Mol Cancer. 2006;5:19. doi: 10.1186/1476-4598-5-19. [DOI] [PMC free article] [PubMed] [Google Scholar]
- 41.Martin-Sanchez E, Rodriguez-Pinilla SM, Sanchez-Beato M, Lombardia L, Dominguez-Gonzalez B, Romero D, et al. Simultaneous pan-PI3K and MEK inhibition as a potential therapeutic strategy in peripheral T cell lymphomas. Haematologica. 2012 doi: 10.3324/haematol.2012.068510. [DOI] [PMC free article] [PubMed] [Google Scholar]
- 42.Miyoshi S, Hamada H, Hamaguchi N, Kato A, Katayama H, Irifune K, et al. Antitumor activity of MEK and PI3K inhibitors against malignant pleural mesothelioma cells in vitro and in vivo. International journal of oncology. 2012;41:449–56. doi: 10.3892/ijo.2012.1462. [DOI] [PMC free article] [PubMed] [Google Scholar]
- 43.Zou ZQ, Zhang LN, Wang F, Bellenger J, Shen YZ, Zhang XH. The novel dual PI3K/mTOR inhibitor GDC-0941 synergizes with the MEK inhibitor U0126 in non-small cell lung cancer cells. Molecular medicine reports. 2012;5:503–8. doi: 10.3892/mmr.2011.682. [DOI] [PubMed] [Google Scholar]
- 44.Roy SK, Srivastava RK, Shankar S. Inhibition of PI3K/AKT and MAPK/ERK pathways causes activation of FOXO transcription factor, leading to cell cycle arrest and apoptosis in pancreatic cancer. Journal of molecular signaling. 2010;5:10. doi: 10.1186/1750-2187-5-10. [DOI] [PMC free article] [PubMed] [Google Scholar]
- 45.Haagensen EJ, Kyle S, Beale GS, Maxwell RJ, Newell DR. The synergistic interaction of MEK and PI3K inhibitors is modulated by mTOR inhibition. Br J Cancer. 2012;106:1386–94. doi: 10.1038/bjc.2012.70. [DOI] [PMC free article] [PubMed] [Google Scholar]
- 46.Carracedo A, Ma L, Teruya-Feldstein J, Rojo F, Salmena L, Alimonti A, et al. Inhibition of mTORC1 leads to MAPK pathway activation through a PI3K-dependent feedback loop in human cancer. The Journal of clinical investigation. 2008;118:3065–74. doi: 10.1172/JCI34739. [DOI] [PMC free article] [PubMed] [Google Scholar]
- 47.Serra V, Scaltriti M, Prudkin L, Eichhorn PJ, Ibrahim YH, Chandarlapaty S, et al. PI3K inhibition results in enhanced HER signaling and acquired ERK dependency in HER2-overexpressing breast cancer. Oncogene. 2011;30:2547–57. doi: 10.1038/onc.2010.626. [DOI] [PMC free article] [PubMed] [Google Scholar]
- 48.Turke AB, Song Y, Costa C, Cook R, Arteaga CL, Asara JM, et al. MEK inhibition leads to PI3K/AKT activation by relieving a negative feedback on ERBB receptors. Cancer research. 2012;72:3228–37. doi: 10.1158/0008-5472.CAN-11-3747. [DOI] [PMC free article] [PubMed] [Google Scholar]
- 49.Roberts PJ, Usary JE, Darr DB, Dillon PM, Pfefferle AD, Whittle MC, et al. Combined PI3K/mTOR and MEK Inhibition Provides Broad Antitumor Activity in Faithful Murine Cancer Models. Clin Cancer Res. 2012;18:5290–303. doi: 10.1158/1078-0432.CCR-12-0563. [DOI] [PMC free article] [PubMed] [Google Scholar]
- 50.Kojima K, Shimanuki M, Shikami M, Samudio IJ, Ruvolo V, Corn P, et al. The dual PI3 kinase/mTOR inhibitor PI-103 prevents p53 induction by Mdm2 inhibition but enhances p53-mediated mitochondrial apoptosis in p53 wild-type AML. Leukemia. 2008;22:1728–36. doi: 10.1038/leu.2008.158. [DOI] [PubMed] [Google Scholar]
- 51.Moumen A, Patane S, Porras A, Dono R, Maina F. Met acts on Mdm2 via mTOR to signal cell survival during development. Development. 2007;134:1443–51. doi: 10.1242/dev.02820. [DOI] [PubMed] [Google Scholar]
- 52.Tentler JJ, Tan AC, Weekes CD, Jimeno A, Leong S, Pitts TM, et al. Patient-derived tumour xenografts as models for oncology drug development. Nature reviews Clinical oncology. 2012;9:338–50. doi: 10.1038/nrclinonc.2012.61. [DOI] [PMC free article] [PubMed] [Google Scholar]
Associated Data
This section collects any data citations, data availability statements, or supplementary materials included in this article.