

Abstract
Background
Sorafenib is a multikinase inhibitor with antiangiogenic and antiproliferative properties, approved for the treatment of hepatocellular carcinoma. The effect of Sorafenib on liver regeneration in healthy rats was investigated.
Methods
Sixty Wistar rats received either Sorafenib (group S; 15 mg/kg) or placebo for 14 days prior to resection and until sacrifice. After a 70% partial hepatectomy, the rats were euthanized on post-operative days (POD) 2, 4 or 8. Hepatocyte proliferation was estimated by immunohistochemistry for Ki-67 antigen using stereological methods on sections prepared by systematic uniform random sampling.
Results
Seven animals (12%) died after surgery. Death rates were similar in treated rats and controls. At hepatectomy, the body weight was significantly lower in group S rats. The liver weight and regeneration rates were lower in group S rats on PODs 2, 4 and 8. Hepatocyte proliferation was significantly lower in group S animals on PODs 2 and 4. Alanine aminotransferase ALAT was significantly higher in the Sorafenib-treated group on PODs 2, 4 and 8. Alkaline phosphatase ALP and bilirubin levels were similar in the two groups, although bilirubin was elevated in group S rats on POD 8.
Conclusion
In this rat model, Sorafenib did not increase post-hepatectomy mortality, but was associated with a significant impaired liver weight gain, regeneration rates and hepatocyte proliferation.
Introduction
The liver is characterized by complex physiology and the ability to undergo rapid regeneration.1–3 Documented evolutionary pressures have driven these unique traits, and have resulted in a phenomenal ability to recover lost functional capacity without jeopardising the viability of the entire organism.
Hepatocellular carcinoma (HCC) is the sixth most common cancer worldwide and the third most common cause of cancer-related death.4 At present, local ablation of small tumours, surgical resection or transplantation offer the best chances of a cure.5
Sorafenib is an orally active multikinase inhibitor with antiangiogenic and antiproliferative properties, which has been shown to improve the survival of patients with preserved liver function and advanced HCC.6,7 Sorafenib is approved for the treatment of advanced HCC in the USA and Europe.8 Against this background, Sorafenib use may be considered in other patients with HCC as an adjuvant or neoadjuvant therapy. In addition, Sorafenib treatment is increasingly being used in patients who, after a proper work-up, are candidates for local treatment, i.e. surgery or local ablation.
Liver regeneration is dependent on neoangiogenesis and tissue proliferation. Inhibition of these vital processes by Sorafenib could impair regeneration. The aim of the present study was to investigate how treatment with Sorafenib influences liver regeneration in healthy rats, after a partial hepatectomy. Unlike previous studies of experimental liver regeneration after a hepatectomy, design-based stereological methods to provide accurate estimates of hepatocyte proliferation were used.
Material and methods
All animal experiments were performed under the approval of the Danish Animal Experiment Inspectorate, Copenhagen, Denmark, under license number 2009/561–1752 and in accordance with the ‘Guide for the Care and Use of Laboratory Animals’ published by the US National Institutes of Health. Animals were housed in standard animal laboratories at a controlled temperature of 23 °C, with an artificial 12-h light-dark cycle and free access to food and water.
Sixty Wistar rats were randomly divided into two groups, and received either Sorafenib (group S) or placebo saline (control group P). All animals were dosed by oral gavage. Sorafenib was prepared by dissolving a 200-mg Sorafenib tablet in 40 ml of saline, in a sealed bottle 15 min prior to gavage (final concentration 5 mg/ml). The solution was maintained under constant stirring on an automatic laboratory mixer. Rats in group S were given 15 mg of Sorafenib per kg per day. Rats in group P were given an equivalent volume of 0.75 ml of saline. The rats were awake and not anaesthetized during gavage, which was performed by an experienced professional animal caretaker. All animals were given treatment (S or P) every day from 2 weeks prior to resection and until sacrifice on post-operative days (POD) 2, 4 or 8. The animals were treated on the day of resection and on the day of sacrifice as well. On both days, oral gavage was given 1 h prior to resection/sacrifice.
After 14 days of treatment, the rats underwent a 70% partial hepatectomy. All surgical procedures were performed under inhalation anaesthesia. Induction was performed in a glass cylinder through which a mixture of oxygen (2.0 l/min), nitrous oxide, (0.5 l/min) and 4% isoflurane (Forene; Abbott Laboratories, Maidenhead, UK) was blown. During surgery, anaesthesia was maintained with 2% isoflurane, oxygen and nitrous oxide as above, administered through a nasal mask. With the animal placed in a supine position on a heated pad, a transverse abdominal incision was made and the liver was mobilized. A partial liver resection was performed by a previously described technique.9 Briefly, the base of the median and left lateral lobes was ligated, and the lobes were resected, resulting in a 70% liver resection model. The abdomen was closed with a 4–0 absorbent suture in two layers, single knots. Before surgery, the animals received a subcutaneous injection of a long-lasting non-steroidal anti-inflammatory, 5 mg/kg Carprofen (Rimadyl; Pfizer Animal Health, Exton, PA, USA) and 1.0 ml of isotonic saline. The rats were kept in the animal facilities until the end of the experiment.
After a partial hepatectomy, rats were block randomized into 3 groups of 10 (plus 3 groups of 10 for controls), for evaluation on the same POD. Thus, the animals in groups 1, 2 and 3 were analysed on PODs 2, 4 and 8, respectively. On the given POD, the rats were again weighed and anaesthetized, and a laparotomy was performed through the previous incision. Blood samples were collected from the heart by cannulation. All rats were subsequently euthanized by cervical dislocation. The regenerated liver was then mobilized and removed. The liver weight was recorded, and the caudate lobe was removed, weighed and fixed in phosphate-buffered 4% formaldehyde for 24–48 h. Body weight, morbidity and mortality, was recorded daily throughout the study period. Dead rats were autopsied to establish the cause of death.
Biochemical analysis
Blood was sampled from the heart at euthanization, processed and stored at −80°C until analysis. Alanine aminotransferase (ALAT), alkaline phosphatase (ALP) and bilirubin (BR) levels were measured using the Modular P (Roche Diagnostics, Mannheim, Germany).
Liver weight and regeneration rate
The total liver weight prior to a partial hepatectomy was calculated from the resected liver weight.9 The post-operative total liver weight was measured at sacrifice. The change in liver weight was recorded as the hepatic regeneration rate (RR). RR is defined as (liver weight per 100 g of the body weight at sacrifice/pre-operative projected liver weight per 100 g of the body weight) × 100:
LWm is the measured liver weight at sacrifice; LWp is the pre-operative projected liver weight.
Immunohistochemistry
Hepatocellular proliferation was estimated using immunohistochemical staining for the Ki-67 antigen. Ki-67 is expressed during all active phases of the cell cycle (G1, S, G2 and M phases), but not in resting (G0) cells.10 Sections for immunohistochemistry were prepared according to stereological principles using systematic uniform random sampling (SURS; see Stereological quantitation). Immunohistochemical staining of the thick 30-μm paraffin sections was performed using a standard (in-house) protocol, modified for use in thick sections. Briefly, sections were deparaffinized and boiled in a microwave oven in Tris-EGTA buffer, pH 9 for heat-induced epitope retrieval. Monoclonal mouse anti-rat Ki-67 specific antibody (clone MIB-5, isotype IgG1; Dako, Glostrup, Denmark)11 diluted at 1:20 was used as the primary antibody in this study. Sections were incubated with the primary antibody for 4 days at 4°C. Sections were washed, positive signals were visualized using the EnVision+ horseradish peroxidase labelled anti-mouse detection system (Dako), and the sections were counterstained with haematoxylin.
Stereological quantitation
The formaldehyde-fixed caudate lobe was cut into 2-mm-thick parallel slabs using a tissue slicer and handled as described previously, before paraffin embedding.12 A 30-μm section was cut from each of the paraffin-embedded blocks creating a set of SURS sections for immunostaining and further analysis.13,14
All sections were analysed using the Olympus BH-50 microscope, modified for stereology with a motorized stage and a digital camera connected to a PC with newCAST 3.6.5.0 software (Visiopharm, Hørsholm, Denmark). The same investigator analysed all sections and was blinded to the section group.
The optical fractionator method was used to estimate the total number of Ki-67 positive cells in each section, as shown in Fig. 1a,b. Microscopy was performed using a 60× oil objective lens. Approximately 0.5%, of the section area, was analysed for Ki-67 positive cells and the thickness of the sampled section was measured every time a positive cell was seen in the frame. The number of Ki-67-positive cells N was calculated using the following formula:
Figure 1.
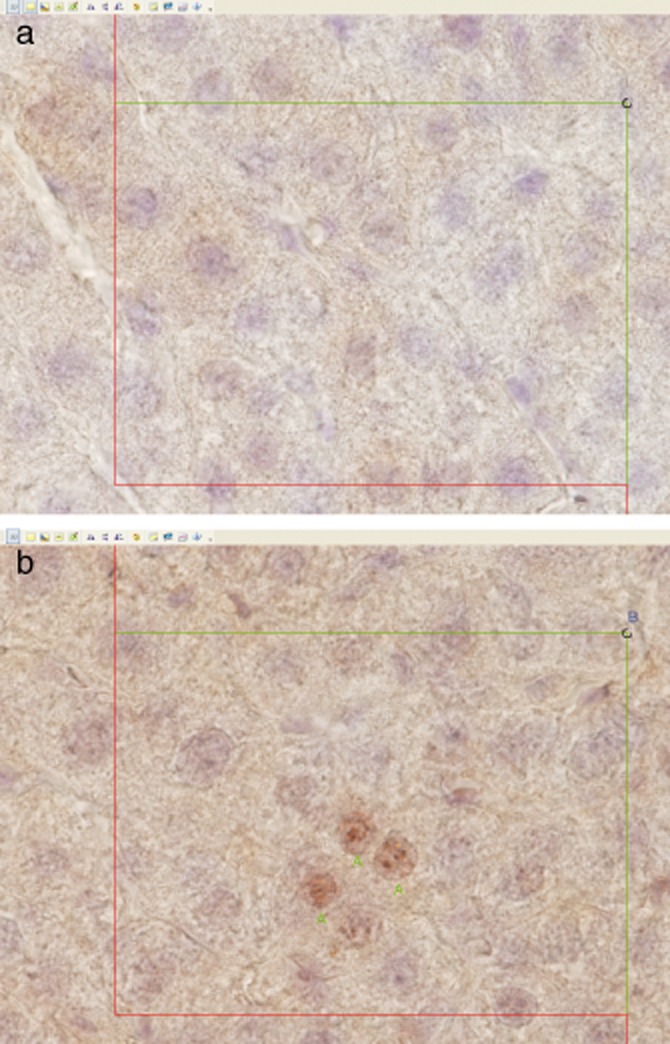
Kasper Jarlhelt Andersen: Ki-67-stained liver sections with the counting frames displayed. A positive hepatocyte was counted if it was significantly stained according to a trained histologist, and if the cell was sampled by the optical fractionator. The disector height was 15 μm and it was placed in the middle of the thick section (cut section thickness was 30 μm and it was approximately 27 μm after shrinkage measured at the microscope). Positive-stained cells in focus at the start of the disector were not counted but all positive-stained hepatocytes coming into focus in the next 15 μm were counted, if they were sampled by the counting frame. Cells were sampled by the counting frame, if they were inside the counting frame, did touch the inclusion lines and did not touch the exclusion lines. The red lines (left and bottom) are exclusion lines and green lines (top and right) are inclusion lines. (a) Counting frame 100 × 75 μm. No Ki-67 positive hepatocytes are observed in the frame. (b) Counting frame 100 × 75 μm. Three Ki-67 positive hepatocytes marked with ‘A's’, are observed inside the frame
SSF is the Section Sampling Fraction = a(frame)/(dx × dy), a(frame) is the area of the 2D unbiased counting frame, 7500 μm2, and dx and dy are the stepping distance in the x- and y-direction equal to 1225 μm, respectively.
ASF is the Area Sampling Fraction = h/tq−,15 where h is the disector height (15 μm) and tq− is the q− weighted section thickness (=15/28.54).
HSF is the Height Sampling Fraction = the height of the sampled section cut on a calibrated microtome divided by the average thickness of the embedded slabs after shrinkage. The thickness of the slabs was 2 mm before embedding. Several of these were exhaustively cut in thin histological slices for measuring slab thickness after shrinkage. Seven tissue land markers for these slabs were followed through the whole series of sections and the average slab thickness after shrinkage calculated:
and Q− is the number of positive cells counted. The counting rules used are described in Fig. 1a,b.
Statistical analysis
Data are presented as the mean [±standard error of the mean (SEM)]. For comparison of the two groups, the t-test was used where applicable, i.e. when normality and equal variance tests were passed. When the t-test was not applicable, a Mann-Whitney Rank Sum test was used, e.g. in following cases: BW-POD 2, ALAT-POD 8, ALP-POD 8, BR-POD 2, BR-POD 4 and Ki67-POD 8.
The reproducibility of the stereological data was tested by re-evaluation of all sections from eight randomly chosen livers. Data from the first (A1) and second evaluations (A2) were compared using the Mann–Whitney Rank sum test. Finally, the variability between readings was assessed by difference-average plots, as described by Bland and Altman16
Results
Mortality and morbidity
Seven animals died prior to evaluation, four as a consequence of suture gnawing, resulting in intestinal perforation and three from unidentifiable causes. Of these seven animals, three were from group S and four were from group P. All other rats were healthy and behaved as expected with regard to activity and food consumption.
Liver biochemistry
Alanine aminotransferase
High concentrations of ALAT were observed during the early part of the post-operative period, with a level on POD 2 of 438 U/l for group S and 179 U/l for group P rats. Concentrations rapidly decreased during the following days, before reaching low values on POD 4. Group S rats had significantly higher ALAT concentrations during the regenerative/recovery period (P < 0.001), the most distinct difference being 259 U/l g on POD 2 (Fig. 2a).
Figure 2.

Kasper Jarlhelt Andersen: the mean alanine aminotransferase (a), bilirubin (b) and alkaline phosphatase (c) [±standard error (SE)] for each group of animals. Blue circles illustrate Sorafenib and red triangles illustrate placebo
Bilirubin
High concentrations of BR were observed during the early part of the post-operative period, with levels on POD 2 of 4.2 umol/l and 3.1 umol/l for group S and group P rats, respectively. Concentrations decreased during the following days, reaching low levels on POD 8. No difference was found comparing BR in the two groups on PODs 2 and 4. However, group S rats had a significantly higher BR concentration (P < 0.001) of 1.0 umol/l on POD 8 (Fig. 2b).
Alkaline phosphatase
High concentrations of ALP were also seen early on in the post-operative period with levels on POD 2 of 345 U/l and 353 U/l for group S and group P rats, respectively. No significant difference in ALP levels was found when you compare the two groups over the course of the study period (Fig. 2c).
Body weight
At the start of oral gavage, animals had a mean body weight of 225 g (209–255). At the time of resection, the mean body weight was 264 g (236–279) for group S and 284 g (246–322) for group P rats, respectively. Weight loss was noted during the first four PODs, after which weight gain was observed in group P, but not in group S animals. There was a statistical significant difference in bodyweight, comparing group S and group P rats before resection (P < 0.001) and on POD 4 (P = 0.025) and POD 8 (P < 0.001) (Fig. 3).
Figure 3.

Kasper Jarlhelt Andersen: the mean body weight [±standard error (SE)] for each group of animals. Blue circles illustrate Sorafenib and red triangles illustrate placebo. POD, post-operative day
Liver weight
The mean weight of the resected 70% liver in group S rats was 5.8 g (4.4–6.9), giving an estimated median total liver weight (100%) of 8.3 g (6.3–9.9) in this group. For group P rats, the mean weight of the resected 70% liver was 7.0 g (5.3–8.1), giving an estimated median total liver weight (100%) of 10.0 g (7.6–11.6). Gains in liver weight during the recovery/regenerative period for each group are shown in Fig. 4. Major growth was noted during PODs 0–4 for both groups, although this was particularly evident in group P. The liver weight in group P rats was close to the baseline on POD 8, whereas the pre-operative liver weight in group S rats was not reached by this time. Group S animals had a significantly lower liver weight at all times after a hepatectomy until the end of experiment (P < 0.001), with the most distinct differences of 3.0 g and 2.9 g being seen on PODs 4 and 8, respectively (Fig. 4a).
Figure 4.
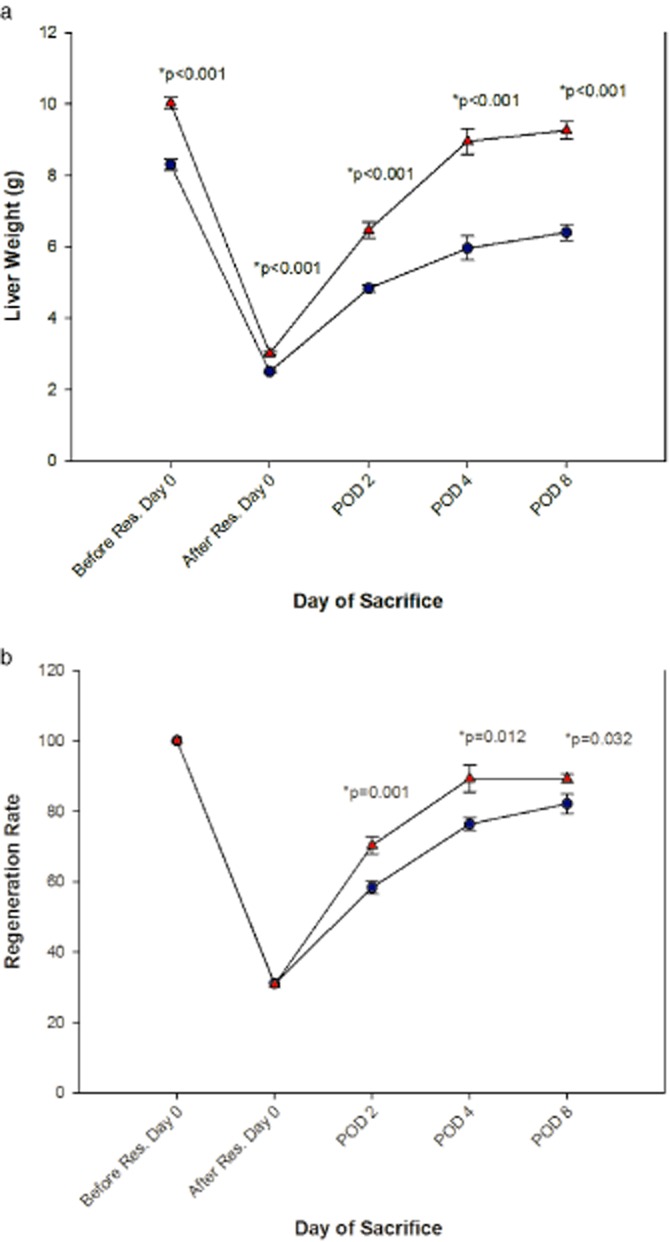
Kasper Jarlhelt Andersen: the mean liver weight (a) and regeneration rate [±standard error (SE)] for each group of animals. Blue circles illustrate Sorafenib and red triangles illustrate placebo. POD, post-operative day
Liver regeneration rate
RR showed similar patterns to those seen in the liver weight curves (Fig. 4b), i.e. with most accelerated regrowth taking place during PODs 0–4, although the RR curves were more stable and showed less variation on each POD than did the liver weight curves. For group P rats, a RR of 89 was reached at POD 8, by which point the RR for the group S animals was 82. Group S rats had a significantly lower RR during the whole post-operative period.
Hepatocyte proliferation
Proliferation was maximal on PODs 2 and 4 in both groups, after which there was a decline to low levels on POD 8. Proliferation was significantly lower in group S compared with group P rats on PODs 2 and POD 4 (Fig. 5).
Figure 5.

Kasper Jarlhelt Andersen: the mean hepatocyte proliferation (±SE) for each group of animals. The 106 is the total number of positive cells in the liver lobe. Blue circles illustrate Sorafenib and red triangles illustrate placebo. POD, post-operative day
Discussion
Liver regeneration depends on hepatocyte proliferation and neoangiogenesis. Interference with either of these vital processes by Sorafenib could impair or delay regeneration.
The effect of Sorafenib treatment on liver regeneration in healthy rats after a partial hepatectomy was studied. We chose to treat the animals both before and after resection to study the full impact of Sorafenib on liver regeneration. Sorafenib was administered at a dose of 15 mg/kg/day in order to match the human dose.17 Body weight dynamics are a reliable marker of acute stress in animals and as such are crucial to studying liver resections.18 It was found that rats in the Sorafenib group had a significantly lower mean body weight at the time of liver resection (Fig. 3). As animals had similar body weights before starting oral gavage, this suggests an anorectic effect of Sorafenib. Furthermore, rats in both groups S and P lost weight until POD 4, after which a steep increase in body weight was observed in the control group P rats, but not in the group S-treated rats.
ALAT, ALP and BR have been traditionally used as markers of hepatic injury. In particular, ALAT is used as a measure of the degree of liver cell damage.19 We found initially high concentrations of ALAT in both treated and control groups of animals on POD 2, presumably reflecting liver injury after resection, before ALAT fell to low levels on PODs 4 and 8. However, significantly higher ALAT concentrations were seen in the group S rats throughout the study, suggesting a more severe degree of liver damage in the treated animals.
Bilirubin and ALP were elevated in both groups on POD 2, falling to low levels at POD 4. No differences were seen in these markers, comparing Sorafenib and placebo-treated animals. This suggests that Sorafenib does not damage the biliary tree in the early phase after a resection. Bilirubin was significantly elevated in the Sorafenib-treated group on POD 8, whereas no difference was found with regard to ALP. This is difficult to explain and may be a chance finding, as one would expect eventual differences to be observed in both parameters if present, reflecting damage to the biliary tree caused by Sorafenib.
Steep increases were found in liver weight from PODs 0 to 4. These rises continued, with a less steep incline, to POD 8. Values for liver weight were significantly lower in the Sorafenib-treated animals at all time points. After correcting for bodyweight, a similar pattern was found to apply when estimating liver RR. Thus, the impaired regenerating capacity of the liver in treated animals cannot be ascribed to an anorectic effect of Sorafenib, at least not as the sole factor. Probably inhibition of liver growth was caused by Sorafenib's anti-angiogenetic and anti-proliferative properties acting directly on the liver during regeneration. In a study by Hora et al. on mice treated with Sorafenib for 14 days before resection and until sacrifice and in mice treated after resection and until sacrifice, differences in liver regeneration were not found when comparing treated animals and controls after 24 h and 72 h.20 On the other hand, Hora et al.20 found a significantly lower liver regeneration in Sorafenib treated animals after 120 h. These results partly differ from those of the present study where we found a significant difference in liver regeneration judged by regeneration rate POD 2. One explanation could be that rats are more sensitive to the effects of Sorafenib than mice. This is supported by a recent study by Kurniali et al. 21on Sorafenib-treated liver-resected mice where they found no difference in liver regeneration when comparing Sorafenib-treated animals and controls in spite of a high dosage up to 90 mg/kg/day.
In accordance with the liver weight and RR dynamics, we found high levels of hepatocyte proliferation from PODs 2 to 4 in both the placebo- and Sorafenib-treated groups, after which they fell to near zero on POD 8. At all time points, the proliferation was significantly lower in rats treated with Sorafenib compared with placebo. Again, this could be explained by Sorafenibs anti-angiogenetic and anti-proliferative properties acting directly on the liver during regeneration. Hora et al.20 evaluated cell proliferation by BrdU incorporation. With regard to this parameter there is agreement between our studies. They found a significant reduction in cell proliferation after 24 and 72 h in animals treated with Sorafenib before and after surgery. However, Kurniali et al. 21 found no difference in cell proliferation between Sorafenib-treated mice and controls. One explanation to this discrepancy could be the fact that they estimated cell proliferation by flow cytometry in contrast to the study by Hora et al. 20 and the present study, where cell proliferation was judged in histological sections.
The difference in sensitivity to the effects of Sorafenib demonstrated between such closely related species such as rats and mice when comparing the present study to the studies by Hora et al. and Kurniali et al. clearly demonstrates, that one should be very cautious when extrapolating these results into humans.
Most previous histopathological studies evaluating hepatic injury or liver regeneration have used either standard pathological examination or modified scoring systems such as that described by Suzuki et al. 22 Routine histopathological examination of a limited random tissue sample has several drawbacks. Thus, it is prone to subjectivity, being highly dependent on the observer and has no component of systematic unbiased randomization. Furthermore, traditional methods of analysis produce at best only semi-quantitative data, making it more difficult to make statistical comparisons. In addition, semi-quantitative methods do not allow for the reference area or volume to be accurately estimated and as a result, run the risk of a highly biased conclusion. These pitfalls were avoided by applying stereological methods to select and evaluate immunohistochemically stained fields in a design-based randomized manner, in order to estimate the total number of Ki-67 positive cells in our tissue sections.
In conclusion, Sorafenib does not increase mortality after a partial hepatectomy in this rat model. However, Sorafenib administered before and after a liver resection, significantly impairs liver weight gain, liver regeneration rates and hepatocyte proliferation as estimated by design-based stereological methods.
Authors' contributions
Study conception and design: Kasper Jarlhelt Andersen, Anne-Sofie Kannerup, Anders Riegels Knudsen, Jens Randel Nyengaard, Stephen Hamilton-Dutoit4 and Frank Viborg Mortensen
Data collection: Kasper Jarlhelt Andersen
Data analysis and interpretation: Kasper Jarlhelt Andersen, Anders Riegels Knudsen, Jens Randel Nyengaard and Frank Viborg Mortensen
Drafting of the manuscript: Kasper Jarlhelt Andersen, Anne-Sofie Kannerup, Anders Riegels Knudsen and Frank Viborg Mortensen
Critical revision of manuscript: Kasper Jarlhelt Andersen, Anne-Sofie Kannerup, Anders Riegels Knudsen, Hideki Sasanuma, Morten Ladekarl, Jens Randel Nyengaard, Stephen Hamilton-Dutoit and Frank Viborg Mortensen
Conflicts of interest
No conflicts of interest.
References
- 1.Michalopoulos GK, DeFrances MC. Liver regeneration. Science. 1997;276:60–66. doi: 10.1126/science.276.5309.60. [DOI] [PubMed] [Google Scholar]
- 2.Taub R. Liver regeneration: from myth to mechanism. Nat Rev Mol Cell Biol. 2004;5:836–847. doi: 10.1038/nrm1489. [DOI] [PubMed] [Google Scholar]
- 3.Michalopoulos GK, Khan Z. Liver regeneration, growth factors, and amphiregulin. Gastroenterology. 2005;128:503–506. doi: 10.1053/j.gastro.2004.12.039. [DOI] [PMC free article] [PubMed] [Google Scholar]
- 4.Parkin DM, Bray F, Ferlay J, Pisani P. Global cancer statistics, 2002. CA Cancer J Clin. 2005;55:74–108. doi: 10.3322/canjclin.55.2.74. [DOI] [PubMed] [Google Scholar]
- 5.Llovet JM, Burroughs A, Bruix J. Hepatocellular carcinoma. Lancet. 2003;362:1907–1917. doi: 10.1016/S0140-6736(03)14964-1. [DOI] [PubMed] [Google Scholar]
- 6.Llovet JM, Ricci S, Mazzaferro V, Hilgard P, Gane E, Blanc JF, et al. Sorafenib in advanced hepatocellular carcinoma. N Engl J Med. 2008;359:378–390. doi: 10.1056/NEJMoa0708857. [DOI] [PubMed] [Google Scholar]
- 7.Cheng AL, Kang YK, Chen Z, Tsao CJ, Qin S, Kim JS, et al. Efficacy and safety of sorafenib in patients in the Asia-Pacific region with advanced hepatocellular carcinoma: a phase III randomised, double-blind, placebo-controlled trial. Lancet Oncol. 2009;10:25–34. doi: 10.1016/S1470-2045(08)70285-7. [DOI] [PubMed] [Google Scholar]
- 8.Simpson D, Keating GM. Sorafenib: in hepatocellular carcinoma. Drugs. 2008;68:251–258. doi: 10.2165/00003495-200868020-00007. [DOI] [PubMed] [Google Scholar]
- 9.Higgins GM, Anderson RM. Experimental pathology of the liver I Restoration of the liver of the white rat following partial surgical removal. Arch Pathol. 1931;12:186–202. [Google Scholar]
- 10.Scholzen T, Gerdes J. The Ki-67 protein: from the known and the unknown. J Cell Physiol. 2000;182:311–322. doi: 10.1002/(SICI)1097-4652(200003)182:3<311::AID-JCP1>3.0.CO;2-9. [DOI] [PubMed] [Google Scholar]
- 11.Gerlach C, Sakkab DY, Scholzen T, Dassler R, Alison MR, Gerdes J. Ki-67 expression during rat liver regeneration after partial hepatectomy. Hepatology. 1997;26:573–578. doi: 10.1002/hep.510260307. [DOI] [PubMed] [Google Scholar]
- 12.Muhlfeld C, Nyengaard JR, Mayhew TM. A review of state-of-the-art stereology for better quantitative 3D morphology in cardiac research. Cardiovasc Pathol. 2010;19:65–82. doi: 10.1016/j.carpath.2008.10.015. [DOI] [PubMed] [Google Scholar]
- 13.Nyengaard JR. Stereologic methods and their application in kidney research. J Am Soc Nephrol. 1999;10:1100–1123. doi: 10.1681/ASN.V1051100. [DOI] [PubMed] [Google Scholar]
- 14.Knudsen AR, Kannerup AS, Gronbaek H, Dutoit SH, Nyengaard JR, Funch-Jensen P, et al. Quantitative histological assessment of hepatic ischemia-reperfusion injuries following ischemic pre- and post-conditioning in the rat liver. J Surg Res. 2013;180:e11–e20. doi: 10.1016/j.jss.2012.03.036. [DOI] [PubMed] [Google Scholar]
- 15.Dorph-Petersen KA, Nyengaard JR, Gundersen HJ. Tissue shrinkage and unbiased stereological estimation of particle number and size. J Microsc. 2001;204(Pt 3):232–246. doi: 10.1046/j.1365-2818.2001.00958.x. [DOI] [PubMed] [Google Scholar]
- 16.Bland JM, Altman DG. Statistical methods for assessing agreement between two methods of clinical measurement. Lancet. 1986;1:307–310. [PubMed] [Google Scholar]
- 17.Llovet JM, Bruix J. Novel advancements in the management of hepatocellular carcinoma in 2008. J Hepatol. 2008;48(Suppl. 1):S20–S37. doi: 10.1016/j.jhep.2008.01.022. [DOI] [PubMed] [Google Scholar]
- 18.Kuhn MA, Smith PD, Wachtel TL, Wright TE, Rogazewski A, Nguyen K, et al. Abdominal wall repair is delayed during hepatic regeneration. J Surg Res. 2001;95:54–60. doi: 10.1006/jsre.2000.6038. [DOI] [PubMed] [Google Scholar]
- 19.Schmidt E, Schmidt FW. Enzyme diagnosis of liver diseases. Clin Biochem. 1993;26:241–251. doi: 10.1016/0009-9120(93)90123-n. [DOI] [PubMed] [Google Scholar]
- 20.Hora C, Romanque P, Dufour JF. Effect of sorafenib on murine liver regeneration. Hepatology. 2011;53:577–586. doi: 10.1002/hep.24037. [DOI] [PubMed] [Google Scholar]
- 21.Kurniali PC, O'Gara K, Wang X, Wang LJ, Somasundar P, Falanga V, et al. The effects of sorafenib on liver regeneration in a model of partial hepatectomy. J Surg Res. 2012;178:242–247. doi: 10.1016/j.jss.2012.01.033. [DOI] [PMC free article] [PubMed] [Google Scholar]
- 22.Suzuki S, Nakamura S, Koizumi T, Sakaguchi S, Baba S, Muro H, et al. The beneficial effect of a prostaglandin I2 analog on ischemic rat liver. Transplantation. 1991;52:979–983. doi: 10.1097/00007890-199112000-00008. [DOI] [PubMed] [Google Scholar]