

Abstract
Background
Erythropoietin, through its specific receptor (EpoR), may induce responses in a variety of non-haematopoietic tissues including malignant cells. The purpose of this study was to examine the expression of EpoR in hepatocellular carcinoma (HCC) and to correlate the levels of EpoR expression with the clinicopathological properties of HCC and tumour recurrence.
Methods
The study included 134 patients who underwent curative hepatectomy for hepatitis B virus (HBV)-related primary HCC. The clinical, laboratory and pathological data from these patients were retrospectively collected. The expression of EpoR mRNA and protein were evaluated by reverse transcription-polymerase chain reaction (RT-PCR) and Western blot analysis, respectively.
Results
Expression of EpoR mRNA in the cirrhotic liver was positively correlated with tumour cell differentiation and 1-year disease-free survival (74.8% in the high expression group versus 46.9% in the low expression group; P = 0.001), as it was for EpoR mRNA expression in HCC (64.4% in the high expression group versus 52.7% in the low expression group; P = 0.044). Tumour recurrence showed stronger dependence on the expression of EpoR protein in non-malignant cirrhotic livers than in HCC.
Conclusion
In HBV-related HCC, the levels of EpoR mRNA and protein in non-tumour cirrhotic livers were positively correlated with tumour cell differentiation, which is a favourable predictor of disease-specific survival.
Introduction
Erythropoietin (Epo) is a glycoprotein hormone with a central regulatory role in red blood cell formation.1 A specific transmembrane erythropoietin receptor (EpoR) mediates the action of Epo in several non-haematopoietic tissues including the heart, blood vessels, kidneys and brain, suggesting that Epo/EpoR signalling may influence functions other than erythropoiesis.2–4 Epo is now known to mediate events in embryonic neural development, neovascularization, the T-cell mediated immune response and wound healing, and may protect the heart and kidneys from ischaemic injury.5
Active Epo/EpoR signalling has been detected in carcinomas of the breast,6–8 ovary,9 kidney,10 prostate,11 stomach,12 pancreas,12 lung,12 squamous tissues of the head and neck,13 and neuroblastoma.14 Evidence suggests that Epo may adversely affect cancer patient survival by stimulating tumour cell proliferation, inhibiting apoptosis, inducing angiogenesis during tumour growth, promoting survival of hypoxic cancer cells, inducing tumour cell migration, and modulating tumour sensitivity to chemoradiation therapy.1,15,16
Hepatocellular carcinoma (HCC) is one of the most highly vascularized solid tumours, and angiogenesis plays a prominent role in the development and progression of HCC.17 Accordingly, the action of EpoR in HCC may have particular clinical significance. This is an observational study which aimed to measure the expression of EpoR mRNA and protein in tumour and non-tumour liver tissue from patients with HCC using reverse transcription-polymerase chain reaction (RT-PCR) and Western blot analysis, and to retrospectively correlate these levels to the clinicopathological properties of the tumours and with tumour recurrence.
Materials and methods
Patient population and tissue samples
From January 2006 to May 2010, the study included 134 patients diagnosed with hepatitis B virus (HBV)-related primary HCC in the Samsung Medical Center Department of Surgery. All patients included this study had sera positive for HBsAg, implying chronic hepatitis B infection, and underwent acurative hepatectomy with a negative resection margin. Only the patients who agreed with the universal informed consents for their specimens to be used in the experiments were included. Patients who had had a previous hepatectomy or neoadjuvant treatments such as transarterial chemoembolization, radiofrequency ablation or portal vein embolization were excluded. One patient with hepatitis C virus co-infection was also excluded. As a prior ischaemic insult to the liver or previous viral infection could affect the histology of liver tissue and biology of the EpoR expression, patients with a history of this were excluded. Immediately after the complete resection of pathological lesions, tissue samples were obtained from both the non-tumour cirrhotic liver (N) and the HCC (T). One-half of each sample was processed for histopathological examination and the other half was stored at −70°C until RNA was extracted.
RT-PCR
The expression of EpoR mRNA in the non-tumour cirrhotic liver tissue and the HCC were determined using RT-PCR. Total RNA was isolated from tissues with an RNA preparation kit (Hybrid-R, GeneAll Biotechnology Co., Ltd, Seoul, Korea) and quantified using a Nano-Drop cuvette-free spectrophotometer (NanoDrop Technologies, Inc., Wilmington, DE, USA). For synthesis of cDNA, 2 μg of each total RNA sample was used as a template. Single-stranded cDNA was prepared using AMV reverse transcriptase with oligo-dT primers (Intron Biotechnology, Seoul, Korea) and amplified for PCR using Pfu Taq polymerase (Solgent Co. Ltd, Daejeon, Korea). The primers used for EpoR amplification were the following: EpoR (550bp) forward 5′-cgg gga cag atg atg agg-3′, reverse 5′-gca gcc tgg tgt cct aag ag-3′; GAPDH (200bp) forward 5′-TCC TGC ACC ACC AAC TGC TT-3′, reverse 5′-TCC ACC ACC CTG TTG CTG TA-3′. PCR products were separated by electrophoresis on 1.5% agarose gel, visualized by ethidium bromide staining and quantified using Quantity One software (Bio-Rad, Hercules, CA, USA). As there is no absolute quantification method to analyse data from RT-PCR, the values of EpoR mRNA were expressed as a relative quantification by dividing the values of GAPDH.
Western blot analysis
Tissues or cells were lysed with RIPA lysis buffer (Intron, Seoul, South Korea) containing protease inhibitor (Thermo Fisher Scientific, Inc., Rockford, IL, USA) to isolate the whole protein. The protein concentration was quantified using a BCA protein assay kit (Thermo Fisher Scientific, Inc.). Equal amounts of extracted protein (50 μg) were loaded into each lane of a 10% sodium dodecyl sulfate polyacrylamide electrophoresis gel. After electrophoresis, proteins were transferred to a polyvinylidenedifluoride membrane filter (Millipore, Billerica, MA, USA) which had been soaked in blocking buffer (4% skim milk) for 60 min and then incubated overnight with rabbit anti-human EpoR polyclonal antibody 1:200 (Santa Cruz Biotechnology, Inc., Santa Cruz, CA, USA). To quantify the total protein, mouse anti-human β-actin polyclonal antibody 1:4000 (Sigma Aldrich Co., St. Louis, MO, USA) was included. The blot was incubated for 1 h with either horseradish peroxidase (HRP)-conjugated anti-mouse IgG 1:1000 or HRP-conjugated anti-rabbit IgG 1:1000 (TrueBlot, eBioscience, San Diego, CA, USA). Proteins stained with an enhanced chemiluminescence kit (AbFrontier, Seoul, South Korea) were exposed to X-ray film (Agfa, Bonn, Germany). The level of protein expression was measured using Image J software (Version 1.43; National Institutes of Health, Bethesda, MD, USA). Relative protein expression was quantified by normalization to β-actin. The expression of EpoR protein was analysed in both cirrhotic tissue and HCC using Western blots. A total of 119 paired data were collected.
Control group
To obtain the baseline values of the EpoR expression in human liver tissue, 40 samples of normal liver tissue without cirrhosis or HCC were collected for the control group. The values of EpoR mRNA and protein in these hepatic tissues were measured. The mean intensity value (INT) of EpoR mRNA expression was 0.812 ± 0.257 (median, 0.832; range, 0.338∼1.220) INT. Using this value as a cut-off point, the patient population were divided into two groups: a high EpoR mRNA expression group and a low EpoR mRNA expression group. The mean intensity value of EpoR protein expression was 2.271 ± 6.297 (median, 0.817; range, 0.036∼36.703) OD. Here, OD is the unit of log10 (255/pixel value). For the analysis of EpoR mRNA expression, a high EpoR protein expression group and a low EpoR protein expression group were also defined.
Clinical, laboratory and pathological data
Post-operatively, the patients were seen every 2 weeks during the first month, and then once every 3 months. The clinical records of the 134 patients included in the study were retrospectively reviewed. Pre-operative laboratory results including haemoglobin, liver function tests, tumour markers and serological viral titres were recorded. Pathological data included tumour size, multiplicity, gross type, growth pattern, cell type, microvascular invasion and degree of tumour differentiation (Edmonson grade). The p53, cyclin D1 and cyclin E expression in HCC tissues were analysed by immunohistochemical staining.
Statistical analysis
All data were expressed as means ± standard deviations and analysed using SPSS version 18.0 (SPSS Inc., Chicago, IL, USA). Categorical variables were analysed by Pearson's chi-square test or Fisher's exact test, and continuous data by Spearman's rank correlation. Disease-specific and overall-survival rates were computed using the Kaplan–Meier method. Differences in survival were calculated using the log-rank test. In all of the tests used, P-values less than 0.05 were considered statistically significant.
Results
The study population included 131 patients who were classified as Child A in Child–Turcotte–Pugh classification (97.8%) and 3 patients as Child B (2.2%). None of the patients had a history of portal hypertensive complications such as uncontrolled ascites or hepatic encephalopathy. The mean value of the indocyanine green test to estimate the remaining liver function was 9.64 ± 5.53%. The mean follow-up period after a hepatectomy was 683 ± 384 days. During the study period, 69 patients (51.5%) experienced disease recurrence and 37 died (27.6%). The mean disease-free time and mean overall survival time of the patients were 523.2 ± 421.1 and 802.3 ± 390.6 days, respectively. Patients with recurrent HCC were treated with a repeat hepatectomy or transarterial chemoembolization if they were not surgical candidates.
Expression of EpoR mRNA in non-tumour cirrhotic liver tissue: EpoR-R (N)
Correlations of EpoR-R (N) expression with laboratory and clinicopathological data are presented in Table 1A. The mean intensity value of EpoR mRNA expression in non-tumour cirrhotic liver tissue [EpoR-R (N)] was 0.709 ± 0.489 (median, 0.600; range, 0.009∼3.917) INT. Specifically, a high level of EpoR-R (N) expression was more frequently in conjunction with well-differentiated HCC (Edmonson grade 1) than with poorly differentiated tumours (grade 3). In Fig. 1a, Kaplan–Meier survival curves show a significantly longer disease-free survival in patients with high EpoR-R (N) expression than in those with low EpoR-R (N) expression. Overall survival did not differ according to EpoR-R (N) expression.
Table 1.
Statistical significance of erythropoietin receptor mRNA (EpoR-R) expression in non-tumour cirrhotic liver (A) and hepatocellular carcinoma (HCC) (B) according to pre-operative laboratory data and clinicopathological features of HCC
| Variables | (A) EpoR-R expression in non-tumour cirrhotic liver | (B) EpoR-R expression in HCC | ||||
|---|---|---|---|---|---|---|
| Low EpoR-R (n = 80) | High EpoR-R (n = 54) | P-value | Low EpoR-R (n = 76) | High EpoR-R (n = 58) | P-value | |
| Patient age (years) | 49.3 ± 9.5 | 50.7 ± 7.2 | 0.713 | 50.4 ± 9.6 | 49.1 ± 7.2 | 0.466 |
| Patient gender: male | 67 (83.8) | 43 (79.6) | 0.542 | 63 (82.9) | 47 (81.0) | 0.781 |
| Child–Turcotte–Pugh (CTP) score | 5.3 ± 0.5 | 5.2 ± 0.6 | 0.628 | 5.2 ± 0.4 | 5.3 ± 0.7 | 0.559 |
| Pre-operative laboratory findings | ||||||
| Haemoglobin (g/dl) | 14.5 ± 1.7 | 14.6 ± 1.7 | 0.796 | 14.7 ± 1.6 | 14.3 ± 1.7 | 0.304 |
| Albumin (g/dl) | 4.0 ± 0.5 | 4.0 ± 0.6 | 0.714 | 4.1 ± 0.4 | 3.9 ± 0.6 | 0.208 |
| Total bilirubin (mg/dl) | 0.8 ± 0.4 | 0.7 ± 0.3 | 0.442 | 0.8 ± 0.4 | 0.7 ± 0.4 | 0.067 |
| Aspartate aminotransferase (U/l) | 50.3 ± 39.1 | 47.4 ± 36.5 | 0.634 | 50.3 ± 39.0 | 47.7 ± 36.9 | 0.632 |
| Alanine aminotransferase (U/l) | 59.7 ± 77.3 | 55.3 ± 44.7 | 0.881 | 53.3 ± 56.4 | 62.0 ± 77.0 | 0.827 |
| Alkaline phosphatase (U/l) | 86.7 ± 32.5 | 95.6 ± 68.5 | 0.474 | 88.6 ± 32.9 | 92.5 ± 66.6 | 0.254 |
| Prothrombin time (INR) | 1.07 ± 0.09 | 1.09 ± 0.12 | 0.662 | 1.07 ± 0.08 | 1.09 ± 0.12 | 0.274 |
| Tumour marker | ||||||
| Alpha-fetoprotein (×104 ng/ml) | 3.0 ± 2.3 | 1.6 ± 4.3 | 0.748 | 3.1 ± 2.3 | 1.5 ± 4.2 | 0.789 |
| PIVKA-IIa (ng/ml) | 274.0 ± 222.3 | 172.8 ± 217.3 | 0.123 | 239.7 ± 220.6 | 245.9 ± 234.3 | 0.871 |
| Serological viral titre | ||||||
| HBV DNA titer (IU) | 36.0 ± 132.6 | 18.8 ± 54.7 | 0.802 | 23.0 ± 68.7 | 40.3 ± 154.6 | 0.343 |
| Post-operative pathology findings | ||||||
| Tumour size (cm) | 6.1 ± 3.3 | 5.4 ± 2.8 | 0.011 | 6.0 ± 3.3 | 5.5 ± 3.0 | 0.093 |
| Multiplicity: multiple | 8 (10.0) | 4 (7.4) | 0.762 | 6 (7.9) | 6 (10.3) | 0.623 |
| Perinodular extension | 64 (80.0) | 41 (75.9) | 0.232 | 61 (80.3) | 44 (75.9) | 0.639 |
| Microtrabecular pattern | 65 (81.3) | 42 (77.8) | 0.677 | 61 (80.3) | 46 (79.3) | 0.720 |
| Classic cell type | 62 (77.5) | 47 (87.0) | 0.206 | 58 (76.3) | 51 (87.9) | 0.160 |
| Differentiation | ||||||
| Edmonson grade 1 | 1 (1.3) | 16 (29.6) | 0.001 | 2 (2.6) | 15 (25.9) | 0.033 |
| Edmonson grade 2 | 67 (83.8) | 27 (50.0) | 60 (78.9) | 34 (58.6) | ||
| Edmonson grade 3 | 12 (15.0) | 11 (20.4) | 14 (18.4) | 9 (15.5) | ||
| Microvascular invasion | 59 (73.8) | 36 (66.7) | 0.376 | 54 (71.1) | 41 (70.7) | 0.963 |
| Immunohistochemical staining | ||||||
| p53: positive | 20 (25.0) | 30 (55.6) | 0.001 | 20 (26.3) | 30 (51.7) | 0.006 |
| Cyclin D1: positive | 25 (31.3) | 19 (35.2) | 0.865 | 23 (30.3) | 21 (36.2) | 0.749 |
| Cyclin E: positive | 25 (31.3) | 18 (33.3) | 0.954 | 22 (28.9) | 21 (36.2) | 0.616 |
All data were presented as number (%) or mean value ± standard deviation.
PIVKA-II, des-r-carboxyprothrombin.
Figure 1.

Disease-free survival and overall survival of hepatocellular carcinoma (HCC) patients according to the erythropoietin specific receptor (EpoR) mRNA expression in non-malignant cirrhotic liver and hepatocellular carcinoma
(a) Survival according to EpoR mRNA in non-tumour cirrhotic liver
| Disease-free survival rate | Overall survival rate | |||||
|---|---|---|---|---|---|---|
| (Number at risk) | (Number at risk) | |||||
| 6 months | 1 year | 2 years | 6 months | 1 year | 2 years | |
| Low EpoR-R (N) group (n = 80; 59.7%) | 63.5% | 46.9% | 36.7% | 98.8% | 85.9% | 70.0% |
| (50) | (34) | (20) | (79) | (66) | (44) | |
| High EpoR-R (N) group (n = 54; 40.3%) | 83.1% | 74.8% | 66.3% | 98.1% | 90.5% | 82.6% |
| (43) | (35) | (22) | (53) | (47) | (41) | |
(b) Survival according to EpoR mRNA in hepatocellular carcinoma
| Disease-free survival rate | Overall survival rate | |||||
|---|---|---|---|---|---|---|
| (Number at risk) | (Number at risk) | |||||
| 6 months | 1 year | 2 years | 6 months | 1 year | 2 years | |
| Low EpoR-R (T) group (n = 76; 56.7%) | 69.4% | 52.7% | 37.7% | 98.7% | 87.6% | 71.7% |
| (51) | (37) | (16) | (75) | (62) | (41) | |
| High EpoR-R (T) group (n = 58; 43.3%) | 75.7% | 64.4% | 58.3% | 98.3% | 87.9% | 79.0% |
| (43) | (34) | (26) | (57) | (51) | (43) | |
Expression of EpoR mRNA in hepatocellular carcinoma tissue: EpoR-R (T)
Correlations of EpoR-R (T) expression with laboratory and clinicopathological data are presented in Table 1B. Analysis of EpoR mRNA in HCC tissue [EpoR-R (T)] by RT-PCR produced an expression value of 0.622 ± 0.376 (median, 0.542; range, 0.033∼2.044) INT. Survival data by degree of EpoR-R (T) expression is shown in Fig. 1b.
Correlation between EpoR-R (N) and EpoR-R (T)
A close relationship was identified in this series of patients between the EpoR-R (N) and EpoR-R (T) as shown in Fig. 2. However, although the correlation of EpoR-R (N) and EpoR-R (T) between groups was obvious, the same correlation did not hold within individuals, i.e. the intensity of EpoR-R (T) expression did not always correspond to the intensity of EpoR-R (N) expression in tissue samples from the same patient. In 79 patients (59.0%), the intensity of EpoR-R (T) expression was lower than EpoR-R (N) expression in non-malignant cirrhotic tissue surrounding the tumour. The other 55 patients (41.0%) had higher values for EpoR-R (T) expression than for EpoR-R (N); in other words, a ratio of EpoR-R (T/N) expression greater than 1.
Figure 2.
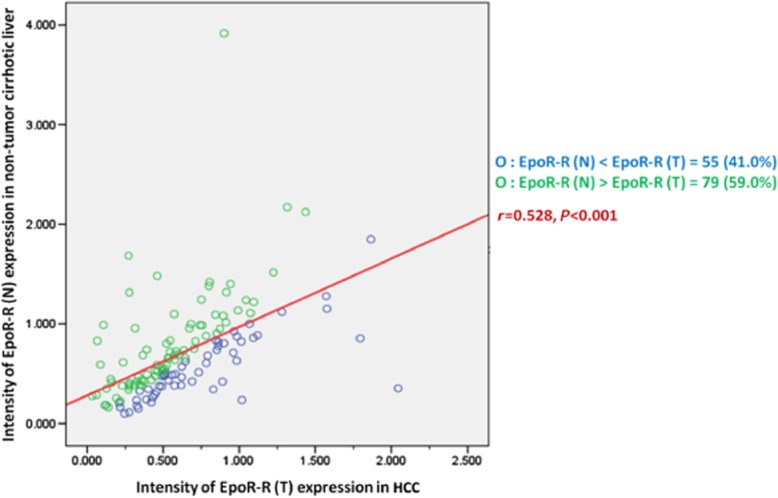
Linear correlation between the intensity of the erythropoietin specific receptor (EpoR) mRNA expression in non-tumour cirrhotic liver and hepatocellular carcinoma (HCC)
Significance of EpoR-R expression in patients with HCC
The clinicopathological variables were compared for four patient groups categorized by the relative degrees of EpoR-R expression in non-malignant cirrhotic liver and HCC. The number of patients with both high EpoR-R (N) and high EpoR-R (T); high EpoR-R (N) and low EpoR-R (T); low EpoR-R (N) and high EpoR-R (T); and low EpoR-R (N) and low EpoR-R (T) was 42 (31.3%), 12 (9.0%), 16 (11.9%) and 64 (47.8%), respectively. In statistical analysis of clinicopathological variables, group categorization was only significantly associated with the degree of tumour cell differentiation (P = 0.002, data not shown). Survival analysis for the four groups in relation to EpoR-R expression (Fig. 3) showed that the group with both high EpoR-R (N) and high EpoR-R (T) had the longest disease-free survival.
Figure 3.
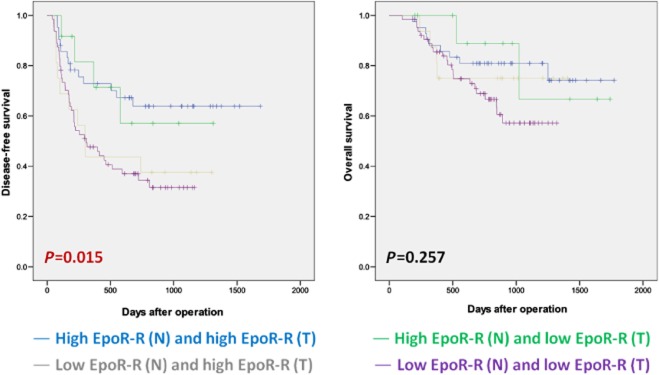
Survival in hepatocellular carcinoma (HCC) patient groups classified by the relative erythropoietin specific receptor EpoR mRNA expression in non-tumour cirrhotic liver and HCC
| Disease-free survival rate | Overall survival rate | |||||
|---|---|---|---|---|---|---|
| (Number at risk) | (Number at risk) | |||||
| 6 months | 1 year | 2 years | 6 months | 1 year | 2 years | |
| High EpoR-R (N) and high EpoR-R (T) | 78.2% | 72.8% | 63.9% | 97.6% | 88.1% | 80.9% |
| (n = 42; 31.3%) | (31) | (27) | (19) | (41) | (37) | (33) |
| High EpoR-R (N) and low EpoR-R (T) | 91.7% | 81.5% | 57.0% | – | 88.9% | 87.8% |
| (n = 12; 9.0%) | (11) | (8) | (4) | (12) | (8) | (6) |
| Low EpoR-R (N) and high EpoR-R (T) | 62.5% | 43.8% | 37.5% | – | 87.5% | 75.0% |
| (n = 16; 11.9%) | (10) | (7) | (6) | (16) | (14) | (12) |
| Low EpoR-R (N) and low EpoR-R (T) | 65.4% | 54.2% | 34.3% | 98.4% | 85.5% | 68.8% |
| (n = 64; 47.8%) | (41) | (34) | (13) | (63) | (52) | (34) |
Significance of EpoR protein expression in cirrhotic liver and hepatocellular carcinoma: EpoR-P (N) and EpoR-P (T)
The mean values were 1.417 ± 1.801 (median, 0.813; range, 0.037∼11.097) OD and 1.948 ± 4.156 (median, 0.879; range, 0.058∼33.486) OD, respectively. The correlation between EpoR-P expression and laboratory or clinicopathological features are shown in Table 2. Survival data are shown in Fig. 4.
Table 2.
Functional significance of erythropoietin receptor protein (EpoR-P) expression in non-tumour cirrhotic liver (A) and hepatocellular carcinoma (HCC) (B) according to pre-operative laboratory data and clinicopathological features of HCC
| Variables | (A) EpoR-P expression in non-tumour cirrhotic liver | (B) EpoR-P expression in hepatocellular carcinoma | ||||
|---|---|---|---|---|---|---|
| Low EpoR-P (n = 91) | High EpoR-P (n = 28) | P-value | Low EpoR-P (n = 92) | High EpoR-P (n = 27) | P-value | |
| Patient age (years) | 49.7 ± 8.8 | 49.9 ± 8.8 | 0.159 | 49.5 ± 9.0 | 50.6 ± 8.4 | 0.678 |
| Patient gender: male | 77 (84.6) | 24 (85.7) | 0.871 | 78 (84.8) | 23 (85.2) | 0.807 |
| Child–Turcotte–Pugh (CTP) score | 5.1 ± 0.4 | 5.4 ± 0.5 | 0.422 | 5.1 ± 0.3 | 5.4 ± 0.7 | 0.168 |
| Pre-operative laboratory findings | ||||||
| Haemoglobin (g/dl) | 14.6 ± 1.6 | 14.7 ± 1.5 | 0.271 | 14.6 ± 1.6 | 14.3 ± 1.4 | 0.675 |
| Albumin (g/dl) | 4.1 ± 0.4 | 3.9 ± 0.5 | 0.121 | 4.1 ± 0.4 | 3.8 ± 0.5 | 0.656 |
| Total bilirubin (mg/dl) | 0.7 ± 0.3 | 0.9 ± 0.5 | 0.441 | 0.7 ± 0.3 | 0.8 ± 0.3 | 0.081 |
| Aspartate aminotransferase (U/l) | 50.4 ± 37.5 | 46.7 ± 15.6 | 0.952 | 49.4 ± 38.8 | 51.2 ± 17.6 | 0.560 |
| Alanine aminotransferase (U/l) | 61.0 ± 64.2 | 43.9 ± 20.9 | 0.907 | 61.7 ± 67.0 | 47.0 ± 20.2 | 0.559 |
| Alkaline phosphatase (U/l) | 92.6 ± 54.6 | 85.1 ± 33.4 | 0.680 | 87.8 ± 32.7 | 104.0 ± 90.9 | 0.954 |
| Prothrombin time (INR) | 1.07 ± 0.10 | 1.08 ± 0.08 | 0.881 | 1.06 ± 0.08 | 1.12 ± 0.14 | 0.448 |
| Tumour marker | ||||||
| Alpha-fetoprotein (×104 ng/ml) | 2.7 ± 1.7 | 1.1 ± 4.7 | 0.961 | 2.9 ± 1.7 | 0.8 ± 3.9 | 0.851 |
| PIVKA-IIa (ng/ml) | 250.4 ± 224.8 | 272.9 ± 212.8 | 0.192 | 229.3 ± 222.9 | 332.1 ± 202.3 | 0.248 |
| Serological viral titre | ||||||
| HBV DNA titer (IU) | 41.3 ± 134.4 | 53.0 ± 83.7 | 0.790 | 35.6 ± 132.7 | 27.9 ± 68.7 | 0.538 |
| Post-operative pathology findings | ||||||
| Tumour size (cm) | 5.8 ± 3.2 | 6.5 ± 3.5 | 0.438 | 5.8 ± 3.0 | 6.5 ± 3.8 | 0.976 |
| Multiplicity: multiple | 7 (7.7) | 2 (7.1) | 0.692 | 6 (6.5) | 2 (7.4) | 0.904 |
| Perinodular extension | 78 (85.7) | 24 (85.7) | 0.542 | 77 (83.7) | 25 (92.6) | 0.501 |
| Microtrabecular pattern | 78 (85.7) | 21 (75.0) | 0.976 | 79 (85.9) | 20 (74.1) | 0.681 |
| Classic cell type | 67 (73.6) | 27 (96.4) | 0.245 | 74 (80.4) | 21 (77.8) | 0.825 |
| Differentiation | ||||||
| Edmonson grade 1 | 6 (6.6) | 11 (39.3) | 0.002 | 6 (6.5) | 1 (3.7) | 0.080 |
| Edmonson grade 2 | 67 (73.6) | 15 (53.6) | 80 (87.0) | 22 (81.5) | ||
| Edmonson grade 3 | 18 (19.8) | 2 (7.1) | 6 (6.5) | 4 (14.8) | ||
| Microvascular invasion | 60 (65.9) | 23 (82.1) | 0.371 | 63 (68.5) | 20 (74.1) | 0.681 |
| Immunohistochemical staining | ||||||
| p53: positive | 19 (20.9) | 5 (17.9) | 0.098 | 27 (29.3) | 7 (25.9) | 0.313 |
| Cyclin D1: positive | 20 (22.0) | 9 (32.1) | 0.583 | 29 (31.5) | 10 (37.0) | 0.531 |
| Cyclin E: positive | 17 (18.7) | 7 (25.0) | 0.521 | 22 (23.9) | 12 (44.4) | 0.615 |
All data were presented as number (%) or mean value ± standard deviation.
PIVKA-II, des-r-carboxyprothrombin.
Figure 4.

Disease-free survival and overall survival of hepatocellular carcinoma (HCC) patients according to the erythropoietin specific receptor (EpoR) protein expression in the cirrhotic liver and hepatocellular carcinoma as determined using Western blot analysis
(a) Survival according to EpoR protein in cirrhotic liver
| Disease-free survival rate | Overall survival rate | |||||
|---|---|---|---|---|---|---|
| (Number at risk) | (Number at risk) | |||||
| 6 months | 1 year | 2 years | 6 months | 1 year | 2 years | |
| Low EpoR-P (N) group (n = 91; 76.5%) | 67.2% | 45.8% | 35.5% | 98.5% | 85.0% | 74.9% |
| (44) | (27) | (17) | (67) | (56) | (42) | |
| High EpoR-P (N) group (n = 28; 23.5%) | 74.1% | 66.6% | 53.9% | 96.8% | 89.3% | 77.6% |
| (22) | (18) | (11) | (27) | (23) | (18) | |
(b). Survival according to EpoR protein in HCC
| Disease-free survival rate | Overall survival rate | |||||
|---|---|---|---|---|---|---|
| (Number at risk) | (Number at risk) | |||||
| 6 months | 1 year | 2 years | 6 months | 1 year | 2 years | |
| Low EpoR-P (T) group (n=92; 77.3%) | 69.4% | 56.4% | 44.2% | 98.7% | 86.5% | 78.8% |
| (51) | (38) | (24) | (75) | (63) | (47) | |
| High EpoR-P (T) group (n=27; 22.7%) | 59.3% | 37.0% | 30.8% | 95.0% | 85.0% | 64.0% |
| (11) | (6) | (5) | (19) | (17) | (12) | |
Discussion
Kayser and Gabius18 first suggested that human tumours might express EpoR and subsequent studies confirmed the presence of EpoR in different types of cancers. Sereno et al.19 suggested that patterns of EpoR expression may be related to disease-free survival in patients with cancer, specifically in patients with gastric adenocarcinoma.
This study demonstrated the expression of EpoR protein and mRNA in cirrhotic liver tissue as well as in associated HCC identified a positive correlation between EpoR expression in either cirrhotic liver or HCC and disease-free survival. In addition, this study showed that the expression of EpoR protein in cirrhotic liver tissue rather than HCC itself was negatively related to tumour recurrence. EpoR protein appeared to be more important in the non-malignant cirrhotic liver than in the tumour.
In erythroid progenitor cells, Epo induces cell differentiation in a stage-specific manner.10 Likewise, in the present study, EpoR expression was significantly greater in HCC that displayed a low histological grade. In breast and gastric cancer, Acs et al.7 and Ribatti et al.20 reported that EpoR expression depends strongly on cancer grade. Chabowska et al.21 also demonstrated that EpoR expression is significantly higher in moderately-differentiated colorectal cancers than in less differentiated cancers. They suggested that the better histological differentiation may result from improved supply of oxygen and the trophic influence of Epo and EpoR.21 Sereno et al.19 suggested that well-differentiated tumours had better preserved protein synthetic machinery than less well-differentiated tumours and that higher EpoR expression was a consequence rather than a cause of the differentiated state. The findings of this study suggested that HCC with more highly-differentiated cells produced higher levels of EpoR protein and that the degree of tumour cell differentiation was positively related to disease-free survival in patients with HCC. In other words, the better histological level of tumour cell differentiation in HCC resulted from the improved oxygen supply because of the high level of EpoR protein expression in the background cirrhotic liver before the development of HCC, at the same time, which is a favourable factor in disease-free survival of the patients with HCC.
Several recent studies7,21–24 have reported significant over-expression of EpoR in malignant tumour cells compared with normal or benign adjacent tissue. However, the relationship found here between EpoR expression in cirrhotic livers and EpoR expression in HCC was not consistent with these previous observations. Although EpoR (T/N) expression differed significantly between groups, it was impossible to establish a similar correlation within individuals. In only 59.0% of patients in this group was EpoR expression in HCC higher than that in adjacent cirrhotic liver tissue. In concordance with the findings of this study, Feldman et al. and Sinclair et al. found no increase in tumour levels of EpoR transcripts relative to normal tissues in renal cell carcinoma,25 melanoma,25 or prostate cancer.11
It is widely accepted that the hypoxic core environment in some solid tumours may induce EpoR expression,6,22 as a function of hypoxia-inducible factor-1 regulation.1,26–30 Mohyeldin et al.13 observed that EpoR expression levels are highest in hypoxic tumour regions. Other investigators measured increased EpoR mRNA levels in breast cancer cells immediately after hypoxia exposure.6,31 However, based on the findings of this study, it is suggested that a hypervascularized solid tumour such as HCC would probably not up-regulate EpoR expression by the tissue hypoxia pathway. Vascular changes within the HCC are characterized by arterialization and sinusoidal capillarization,17 which do not promote hypoxia. This may explain why EpoR (T) expression did not consistently exceed the level of EpoR (N) expression.
Studies show that EpoR protein expression in cancer cells may contribute to disease progression or invasiveness through the anti-apoptotic and pro-migratory effects of Epo;10,13,16,32 however, other studies contradict these findings. Westphal et al.33 and Farrell and Lee34 demonstrated that Epo does not increase the proliferation rate of EpoR-positive cells in malignant and benign human cell lines. Similar studies show that tumour cell growth does not depend critically on EpoR expression.21,35
In a murine myeloma model, Mittelman et al.36 found that Epo induces tumour regression by promoting an effective antitumour immune response. Carvalho et al.37 suggested that, at least in a specific subset of renal cell carcinomas, an EpoR agonist may enhance the propensity of EpoR-positive tumour cells to undergo apoptosis. Pinto et al.38 reported that Epo mediates the expression of hepcidin, the principal iron regulatory hormone, in hepatocytes. Thus Epo may promote terminal differentiation as opposed to proliferation and tumour progression in these cells.
As indicated above, Epo-EpoR signalling may be detected in several tumour types and may promote tumour progression by different mechanisms, especially in highly vascularized tumour types. Therefore, it was relevant to test the role of Epo-EpoR signaling in HCC. The findings of this study revealed that EpoR mRNA and protein were found in both non-tumour and HCC liver samples and EpoR expression in both tissues was correlated with disease-free survival. It also explained why EpoR expression in HCC did not exceed EpoR expression in non-tumour liver tissue, as HCC generally does not have a central hypoxia as other tumour types. The most interesting finding in this study is the presence of EpoR in non-tumour liver tissue and its correlation with less-differentiated HCC and with decreased survival, probably because the expression of growth-regulatory cell surface receptors corresponds to a higher degree of tumour cell differentiation and therefore to a lower tumour grade. This finding may suggest the use of a non-tumour liver biopsy with EpoR expression quantification prior to HCC treatment in order to define the optimal therapeutic approach, depending on the probability of intra-hepatic tumour recurrence. In fact, there is currently a crucial need to identify surrogate markers of tumour aggressiveness in HCC. The expression of Epo-R protein in the non-tumour liver may prove to be a valuable tool in identifying patients at risk of intra-hepatic recurrence and thus, to indicate liver transplantation rather than a partial resection. Therefore, the results of this study may be of particular importance in HCC management.
In conclusion, expression of EpoR mRNA was demonstrated in both non-tumour cirrhotic liver and HCC. In the non-tumour cirrhotic liver, EpoR mRNA expression was associated negatively with tumour size and positively with the degree of differentiation and p53-staining intensity. Expression of EpoR mRNA in HCC was associated with tumour differentiation and p53 staining. Expression of EpoR mRNA in either cirrhotic liver or HCC was positively correlated with disease-free survival, and patients with a high level of EpoR mRNA expression in both cirrhotic liver and HCC had the longest disease-free survival. Tumour recurrence in patients with HCC was related to the expression of EpoR protein in non-malignant cirrhotic liver but not to the expression in HCC itself. It is suggested that high levels of EpoR mRNA and protein expression in HBV-related HCC correspond to high levels of tumour cell differentiation and p53 expression, which are favourable markers in disease-free survival.
Conflicts of interest
None declared.
References
- 1.Hardee ME, Arcasoy MO, Blackwell KL, Kirkpatrick JP, Dewhirst MW. Erythropoietin biology in cancer. Clin Cancer Res. 2006;12:332–339. doi: 10.1158/1078-0432.CCR-05-1771. [DOI] [PubMed] [Google Scholar]
- 2.Jelkmann W, Bohlius J, Hallek M, Sytkowski AJ. The erythropoietin receptor in normal and cancer tissues. Crit Rev Oncol Hematol. 2008;67:39–61. doi: 10.1016/j.critrevonc.2008.03.006. [DOI] [PubMed] [Google Scholar]
- 3.Ribatti D, Marzullo A, Gentile A, Longo V, Nico B, Vacca A, et al. Erythropoietin/erythropoietin-receptor system is involved in angiogenesis in human hepatocellular carcinoma. Histopathology. 2007;50:591–596. doi: 10.1111/j.1365-2559.2007.02654.x. [DOI] [PMC free article] [PubMed] [Google Scholar]
- 4.Udupa KB. Functional significance of erythropoietin receptor on tumor cells. World J Gastroenterol. 2006;12:7460–7462. doi: 10.3748/wjg.v12.i46.7460. [DOI] [PMC free article] [PubMed] [Google Scholar]
- 5.Arcasoy MO. The non-haematopoietic biological effects of erythropoietin. Br J Haematol. 2008;141:14–31. doi: 10.1111/j.1365-2141.2008.07014.x. [DOI] [PubMed] [Google Scholar]
- 6.Acs G, Acs P, Beckwith SM, Pitts RL, Clements E, Wong K, et al. Erythropoietin and erythropoietin receptor expression in human cancer. Cancer Res. 2001;61:3561–3565. [PubMed] [Google Scholar]
- 7.Acs G, Zhang PJ, Rebbeck TR, Acs P, Verma A. Immunohistochemical expression of erythropoietin and erythropoietin receptor in breast carcinoma. Cancer. 2002;95:969–981. doi: 10.1002/cncr.10787. [DOI] [PubMed] [Google Scholar]
- 8.Arcasoy MO, Amin K, Karayal AF, Chou SC, Raleigh JA, Varia MA, et al. Functional significance of erythropoietin receptor expression in breast cancer. Lab Invest. 2002;82:911–918. doi: 10.1097/01.lab.0000020415.72863.40. [DOI] [PubMed] [Google Scholar]
- 9.McBroom JW, Acs G, Rose GS, Krivak TC, Mohyeldin A, Verma A. Erythropoietin receptor function and expression in epithelial ovarian carcinoma. Gynecol Oncol. 2005;99:571–577. doi: 10.1016/j.ygyno.2005.06.038. [DOI] [PubMed] [Google Scholar]
- 10.Westenfelder C, Baranowski RL. Erythropoietin stimulates proliferation of human renal carcinoma cells. Kidney Int. 2000;58:647–657. doi: 10.1046/j.1523-1755.2000.00211.x. [DOI] [PubMed] [Google Scholar]
- 11.Feldman L, Wang Y, Rhim JS, Bhattacharya N, Loda M, Sytkowski AJ. Erythropoietin stimulates growth and STAT5 phosphorylation in human prostate epithelial and prostate cancer cells. Prostate. 2006;66:135–145. doi: 10.1002/pros.20310. [DOI] [PubMed] [Google Scholar]
- 12.Yasuda Y, Fujita Y, Matsuo T, Koinuma S, Hara S, Tazaki A, et al. Erythropoietin regulates tumour growth of human malignancies. Carcinogenesis. 2003;24:1021–1029. doi: 10.1093/carcin/bgg060. [DOI] [PubMed] [Google Scholar]
- 13.Mohyeldin A, Lu H, Dalgard C, Lai SY, Cohen N, Acs G, et al. Erythropoietin signaling promotes invasiveness of human head and neck squamous cell carcinoma. Neoplasia. 2005;7:537–543. doi: 10.1593/neo.04685. [DOI] [PMC free article] [PubMed] [Google Scholar]
- 14.Wollman Y, Westphal G, Blum M, Simantov R, Blumberg S, Peer G, et al. The effect of human recombinant erythropoietin on the growth of a human neuroblastoma cell line. Life Sci. 1996;59:315–322. doi: 10.1016/0024-3205(96)00300-1. [DOI] [PubMed] [Google Scholar]
- 15.Henke M, Mattern D, Pepe M, Bezay C, Weissenberger C, Werner M, et al. Do erythropoietin receptors on cancer cells explain unexpected clinical findings? J Clin Oncol. 2006;24:4708–4713. doi: 10.1200/JCO.2006.06.2737. [DOI] [PubMed] [Google Scholar]
- 16.Saintigny P, Besse B, Callard P, Vergnaud AC, Czernichow S, Colombat M, et al. Erythropoietin and erythropoietin receptor coexpression is associated with poor survival in stage I non-small cell lung cancer. Clin Cancer Res. 2007;13:4825–4831. doi: 10.1158/1078-0432.CCR-06-3061. [DOI] [PubMed] [Google Scholar]
- 17.Yang ZF, Poon RT. Vascular changes in hepatocellular carcinoma. Anat Rec (Hoboken) 2008;291:721–734. doi: 10.1002/ar.20668. [DOI] [PubMed] [Google Scholar]
- 18.Kayser K, Gabius HJ. Analysis of expression of erythropoietin-binding sites in human lung carcinoma by the biotinylated ligand. Zentralbl Pathol. 1992;138:266–270. [PubMed] [Google Scholar]
- 19.Sereno M, De Castro J, Belda-Iniesta C, Garcia-Cabezas MA, Cejas P, Casado E, et al. EPO-R expression patterns in resected gastric adenocarcinoma followed by adjuvant chemoradiation treatment. Pathol Oncol Res. 2009;15:1–10. doi: 10.1007/s12253-008-9118-9. [DOI] [PubMed] [Google Scholar]
- 20.Ribatti D, Marzullo A, Nico B, Crivellato E, Ria R, Vacca A. Erythropoietin as an angiogenic factor in gastric carcinoma. Histopathology. 2003;42:246–250. doi: 10.1046/j.1365-2559.2003.01581.x. [DOI] [PubMed] [Google Scholar]
- 21.Chabowska AM, Sulkowska M, Chabowski A, Wincewicz A, Koda M, Sulkowski S. Erythropoietin and erythropoietin receptor in colorectal cancer. Int J Surg Pathol. 2008;16:269–276. doi: 10.1177/1066896908315796. [DOI] [PubMed] [Google Scholar]
- 22.Acs G, Xu X, Chu C, Acs P, Verma A. Prognostic significance of erythropoietin expression in human endometrial carcinoma. Cancer. 2004;100:2376–2386. doi: 10.1002/cncr.20244. [DOI] [PubMed] [Google Scholar]
- 23.Lee YS, Vortmeyer AO, Lubensky IA, Vogel TW, Ikejiri B, Ferlicot S, et al. Coexpression of erythropoietin and erythropoietin receptor in von Hippel-Lindau disease-associated renal cysts and renal cell carcinoma. Clin Cancer Res. 2005;11:1059–1064. [PubMed] [Google Scholar]
- 24.Selzer E, Wacheck V, Kodym R, Schlagbauer-Wadl H, Schlegel W, Pehamberger H, et al. Erythropoietin receptor expression in human melanoma cells. Melanoma Res. 2000;10:421–426. doi: 10.1097/00008390-200010000-00003. [DOI] [PubMed] [Google Scholar]
- 25.Sinclair AM, Rogers N, Busse L, Archibeque I, Brown W, Kassner PD, et al. Erythropoietin receptor transcription is neither elevated nor predictive of surface expression in human tumour cells. Br J Cancer. 2008;98:1059–1067. doi: 10.1038/sj.bjc.6604220. [DOI] [PMC free article] [PubMed] [Google Scholar]
- 26.Ebert BL, Bunn HF. Regulation of the erythropoietin gene. Blood. 1999;94:1864–1877. [PubMed] [Google Scholar]
- 27.Papworth K, Bergh A, Grankvist K, Ljungberg B, Rasmuson T. Expression of erythropoietin and its receptor in human renal cell carcinoma. Tumour Biol. 2009;30:86–92. doi: 10.1159/000216844. [DOI] [PubMed] [Google Scholar]
- 28.Semenza GL. Hypoxia-inducible factor 1: master regulator of O2 homeostasis. Curr Opin Genet Dev. 1998;8:588–594. doi: 10.1016/s0959-437x(98)80016-6. [DOI] [PubMed] [Google Scholar]
- 29.Semenza GL. Hypoxia, clonal selection, and the role of HIF-1 in tumor progression. Crit Rev Biochem Mol Biol. 2000;35:71–103. doi: 10.1080/10409230091169186. [DOI] [PubMed] [Google Scholar]
- 30.Semenza GL. HIF-1: mediator of physiological and pathophysiological responses to hypoxia. J Appl Physiol. 2000;88:1474–1480. doi: 10.1152/jappl.2000.88.4.1474. [DOI] [PubMed] [Google Scholar]
- 31.Lester RD, Jo M, Campana WM, Gonias SL. Erythropoietin promotes MCF-7 breast cancer cell migration by an ERK/mitogen-activated protein kinase-dependent pathway and is primarily responsible for the increase in migration observed in hypoxia. J Biol Chem. 2005;280:39273–39277. doi: 10.1074/jbc.M509446200. [DOI] [PubMed] [Google Scholar]
- 32.Mirmohammadsadegh A, Marini A, Gustrau A, Delia D, Nambiar S, Hassan M, et al. Role of erythropoietin receptor expression in malignant melanoma. J Invest Dermatol. 2010;130:201–210. doi: 10.1038/jid.2009.162. [DOI] [PubMed] [Google Scholar]
- 33.Westphal G, Niederberger E, Blum C, Wollman Y, Knoch TA, Rebel W, et al. Erythropoietin and G-CSF receptors in human tumor cells: expression and aspects regarding functionality. Tumori. 2002;88:150–159. doi: 10.1177/030089160208800214. [DOI] [PubMed] [Google Scholar]
- 34.Farrell F, Lee A. The erythropoietin receptor and its expression in tumor cells and other tissues. Oncologist. 2004;9(Suppl. 5):18–30. doi: 10.1634/theoncologist.9-90005-18. [DOI] [PubMed] [Google Scholar]
- 35.Hoogsteen IJ, Peeters WJ, Marres HA, Rijken PF, Van Den Hoogen FJ, Van Der Kogel AJ, et al. Erythropoietin receptor is not a surrogate marker for tumor hypoxia and does not correlate with survival in head and neck squamous cell carcinomas. Radiother Oncol. 2005;76:213–218. doi: 10.1016/j.radonc.2005.06.030. [DOI] [PubMed] [Google Scholar]
- 36.Mittelman M, Neumann D, Peled A, Kanter P, Haran-Ghera N. Erythropoietin induces tumor regression and antitumor immune responses in murine myeloma models. Proc Natl Acad Sci U S A. 2001;98:5181–5186. doi: 10.1073/pnas.081275298. [DOI] [PMC free article] [PubMed] [Google Scholar]
- 37.Carvalho G, Lefaucheur C, Cherbonnier C, Metivier D, Chapel A, Pallardy M, et al. Chemosensitization by erythropoietin through inhibition of the NF-kappaB rescue pathway. Oncogene. 2005;24:737–745. doi: 10.1038/sj.onc.1208205. [DOI] [PubMed] [Google Scholar]
- 38.Pinto JP, Ribeiro S, Pontes H, Thowfeequ S, Tosh D, Carvalho F, et al. Erythropoietin mediates hepcidin expression in hepatocytes through EPOR signaling and regulation of C/EBPalpha. Blood. 2008;111:5727–5733. doi: 10.1182/blood-2007-08-106195. [DOI] [PMC free article] [PubMed] [Google Scholar]