

Abstract
Purpose: Stray neutron radiation is of concern after radiation therapy, especially in children, because of the high risk it might carry for secondary cancers. Several previous studies predicted the stray neutron exposure from proton therapy, mostly using Monte Carlo simulations. Promising attempts to develop analytical models have also been reported, but these were limited to only a few proton beam energies. The purpose of this study was to develop an analytical model to predict leakage neutron equivalent dose from passively scattered proton beams in the 100-250-MeV interval.
Methods: To develop and validate the analytical model, the authors used values of equivalent dose per therapeutic absorbed dose (H/D) predicted with Monte Carlo simulations. The authors also characterized the behavior of the mean neutron radiation-weighting factor, , as a function of depth in a water phantom and distance from the beam central axis.
Results: The simulated and analytical predictions agreed well. On average, the percentage difference between the analytical model and the Monte Carlo simulations was 10% for the energies and positions studied. The authors found that was highest at the shallowest depth and decreased with depth until around 10 cm, where it started to increase slowly with depth. This was consistent among all energies.
Conclusion: Simple analytical methods are promising alternatives to complex and slow Monte Carlo simulations to predict H/D values. The authors' results also provide improved understanding of the behavior of which strongly depends on depth, but is nearly independent of lateral distance from the beam central axis.
Keywords: proton therapy, neutron equivalent dose, analytical model, Monte Carlo calculation
INTRODUCTION
Stray radiation from neutrons is a major concern in proton therapy. Such neutron exposures could potentially increase the risk of secondary cancers after radiotherapy. This is especially important for pediatric patients. The Surveillance, Epidemiology and End Results (SEER) Center of the National Cancer Institute reports that the incidence of primary solid cancers is considerably higher in people who had undergone radiotherapy as children.1 Radiation may be implicated in the incidence of many of these cancers. Specifically, on average a child's excess absolute risk or EAR (per 10 000 person-years) of developing a new primary cancer after radiotherapy is 21.10, representing 2 times that of children not receiving radiotherapy (EAR = 10.30).1 This is of increasing concern because the five-year survival rate of pediatric cancer patients went from 61% in 1996 to 79% in 2002,2 meaning that the incidence of second cancers will likely be raised for several decades. Similar gains have been reported for adults; the five-year survival rate increased from 50% to 66% during the same period, and the ten-year survival rate is now 59%,2 which will likely result in similar increases in secondary cancers.
Stray external and internal neutrons are created by interactions of the proton beam with components of the treatment nozzle and the patient. The production of external neutrons depends on the proton therapy delivery technique, that is, whether beams are delivered by dynamic scanning or passive scattering. In passive delivery, the proton beam is spread laterally using a scattering foil and limited by a collimator. Proton-induced nuclear reactions with these and other devices in the treatment nozzle produce secondary particles, of which neutrons are of primary concern. In dynamic beam delivery, a small beam spot is magnetically swept across the target, and the energy is varied dynamically usually without the need for energy degraders.3 In dynamic beam delivery without collimators, the neutron exposure is from internal stray neutrons. Thus, regardless of the delivery method, neutron exposures are a potential concern.4
In general, passive delivery systems confer somewhat higher neutron dose exposures than dynamic systems, although a comparison of recent studies4, 5, 6, 7 and earlier studies8, 9 suggests that neutron exposures are decreasing over time as beam delivery techniques are improved. The study of stray external neutron exposures from passive systems is of paramount importance, as the overwhelming majority of patients receive passive treatments. In passive proton therapy, exposures from leakage neutrons are much larger than those from internal neutrons.10 Many other studies characterizing neutron doses in proton therapy present data from Monte Carlo simulations and measurements.5, 10, 11, 12, 13, 14, 15, 16, 17, 18
It is commonly assumed that replacing photon treatments with proton treatments will lower the risk of radiogenic second cancers.19 The literature contains no direct observational evidence to support this, such as radioepidemiologic studies that compare risk of secondary cancer incidence after advanced proton and photon radiotherapies. Currently, it is difficult to perform clinically realistic and complete studies of the risk of late effects because commercial radiotherapy treatment planning systems do not predict out-of-field neutron doses to the patient. At least two Monte Carlo-based research systems with this capability20, 21, 22, 23 have been used extensively for research studies on stray neutron doses, but they have not been commercialized, presumably because of the high degree of complexity and computational expense associated with the Monte Carlo method. A logical alternative approach would be to use an analytical dose algorithm that is simpler to implement and computationally less expensive than Monte Carlo method. Early attempts to model neutron exposures from proton therapy analytically were reported by Polf and Newhauser.11 Zheng et al.24 proposed an analytical model to predict neutron doses per therapeutic dose for a passive delivery system. This model was later redefined by Zhang et al.25 for a pristine 250-MeV proton beam; good agreement was found between the neutron doses predicted by the analytical model and Monte Carlo simulations. Anferov26 proposed an analytical model to predict neutron equivalent doses for proton energies of 100, 150, and 200 MeV. This model was also validated with Monte Carlo simulations and compared with measurements, with good agreement found among these. Together, these studies provided tantalizing early indications that analytical modeling methods may have potential in this application. However, the findings are limited by the fact that Zhang et al.25 and Zheng et al.24 only presented neutron doses due to a pristine 250-MeV proton beam and Anferov's26 nozzle was based on simplistic modeling beam of a beam delivery system that lacks clinical realism and did not account for neutron attenuation and scattering caused by media in proximity to the neutron sources.
The objective of our study was to develop an analytical model to predict neutron exposures over the entire interval of clinically relevant proton beam energies, i.e., from 100 to 250 MeV, with an accuracy of 10%. We also investigated the behavior in , the mean radiation weighting factor for neutrons used to convert absorbed dose to equivalent dose, as a function of position in a water phantom and with primary proton beam energy. We used Monte Carlo simulations of passively scattered treatment beams incident on a water-box phantom to generate the neutron dosimetry data used to train the analytical model and characterized variations in .
METHODS
We simulated the passive scattering system in use at The University of Texas MD Anderson Cancer Center. Simulations were carried out with Monte Carlo N-Particle eXtended Radiation Transport Code (MCNPX v.2.8).27 MCNPX has widely been used for the determination of neutron exposures and has been benchmarked against measurements for proton therapy.12, 28, 29, 30 The simulations modeled the passive scattering system's treatment nozzle and a water-box phantom (Fig. 1). The components of this nozzle have been described in Refs. 23 and 31. These simulations were for a medium-size treatment field (18 × 18 cm2 prior to final collimation) with a closed final collimator. Proton beams were simulated for mean energies of 100, 120, 140, 160, 180, 200, 225, and, 250 MeV at the entrance of the treatment nozzle. Neutron absorbed doses and neutron spectral fluences were simulated for pristine proton beams, i.e., without range modulation. The water phantom was 30 × 180 × 44 cm3 and had 100 spherical detecting volumes, each 1 cm in diameter. These detecting volumes were located at various lateral distances off the central axis (OAX) of the beam and at various depths along the central axis (CAX).
Figure 1.

Simulated water phantom with 100 spherical detecting volumes placed along the CAX and at 10 cm OAX, 40 cm OAX, and 80 cm OAX at the same depths. d represents the distance from the neutron effective source to the detecting volumes. d′ is the distance from the surface of the phantom to the detecting volumes. diso is the distance from the effective neutron source to isocenter. z is the depth in the phantom. Figure modified from Zhang et al. (Ref. 25).
The absorbed dose from secondary neutrons, Dn, deposited at each detecting volume was calculated with the energy deposition tally from MCNPX. The neutron equivalent dose, H, was then calculated according to the formula:
| (1) |
where is the mean radiation weighting factor for neutrons and was calculated according to an established method,32 or
| (2) |
where Φ is the neutron spectral fluence. The later were obtained from Monte Carlo simulations using the tally of track-length estimates of fluence. The energy-dependent weighting factor, wR, taken from ICRP Publication 92 (Ref. 32) was:
| (3) |
where En is the neutron energy.
The neutron equivalent dose at each detecting volume was normalized by the proton therapeutic absorbed dose, Dp, at isocenter from a 10 × 10 cm2 therapeutic proton beam. Isocenter coincided with the center of a 10-cm spread-out Bragg peak. The neutron equivalent dose was normalized by the therapeutic proton dose and is denoted by H/D.
Using H/D values obtained with the Monte Carlo simulation methods described above, we developed a new model that was inspired by the methods and promising results reported by Zhang et al.25 at 250 MeV. In particular, our model takes into account the contribution to H/D from intranuclear cascade neutrons, evaporation neutrons, epithermal neutrons (sometimes called 1/E neutrons), and thermal neutrons. The rationale for this approach was to increase accuracy by modeling the neutron energy dependence of the various physical processes governing H/D. In addition, our proposed model has an interval of applicability from 100 to 250 MeV proton energy.
The analytical model is given by:
| (4) |
where (H/D)iso is the neutron equivalent dose per therapeutic absorbed dose at isocenter. C1, C2, C3, and C4 apportion the H/D contributions from intranuclear cascade, evaporation, epithermal, and thermal neutrons, respectively. These are the main components of the neutron spectra obtained in the simulations performed in this work, shown in Fig. 2. The term (d/diso)−p represents the power law that governs the neutron dose falloff as a function of distance from the effective neutron source, which is independent of the proton beam energy.31 The term d represents the distance from the neutron source in the treatment nozzle to the detecting volume; and diso is the distance from the neutron source to isocenter (Fig. 1). The terms , and represent the attenuation of the neutrons in the water phantom. α1, α2, α3, and α4 denote the attenuation of intranuclear cascade, evaporation, epithermal, and thermal neutrons, respectively. d′iso is the distance from the phantom surface to the isocenter, and d′ is the distance from the phantom surface to the detecting volumes. The replenishment of lower energy neutrons at depth, a consequence of moderation of higher energy neutrons, is modeled implicitly by the use of the terms for attenuation in the phantom. The terms , and represent the lateral spread of intranuclear cascade, evaporation, epithermal, and thermal neutrons, respectively. The lateral distribution of neutrons is governed by σ1 for intranuclear cascade, σ2 for evaporation, σ3 for epithermal, and σ4 for thermal neutrons. z represents the position of the detecting volumes. Additional details have been given in Ref. 25.
Figure 2.

Normalized neutron energy spectra produced by 120-, 160-, 200-, and 250-MeV proton beams at a depth of 10 cm at CAX.
In this study, the analytical model was trained separately at each proton energy considered. Training was accomplished by fitting the H/D values from Monte Carlo simulations at all tally locations in the phantom to the H/D model in Eq. 4. A gradient search algorithm was used to iteratively fit all the parameters of the analytical model.33, 34
RESULTS
H/D values are plotted as a function of water depth at distances from the CAX (Fig. 3), at 10 cm OAX (Fig. 4), 40 cm OAX (Fig. 5), and 80 cm OAX (Fig. 6), including predictions from the analytical model and Monte Carlo simulations at 100, 160, 200, and 250 MeV. These figures reveal good agreement between the calculations and simulations. On average, the percent difference between the Monte Carlo calculation and the analytical model among all energies and positions was 10%. Figure 7 reveals good agreement between OAX profiles of H/D at a depth of 22 cm in the water phantom. The model parameters to apportion H/D contributions from intranuclear cascade (C1), evaporation (C2), epithermal (C3), and evaporation (C4) neutrons are listed in Table 1. The effective linear neutron attenuation coefficients for the different energy regimes of the neutron spectrum depend on neutron energy but are independent of the proton beam energy. The specific values found are presented in Table 1. The largest attenuation coefficient was found to be for thermal neutrons. In addition, the exponent governing the dose falloff of H/D for high-energy neutrons, p, had a value of 1 for all energies, which indicates that the neutron source behaves like a point source. The values of the lateral distribution of neutrons (σ1, σ2, σ3, and σ4), listed in Table 2, were also independent on the proton beam energy and were also found to have the highest value for thermal neutrons. This value probably was highest because the low-energy neutrons were emitted isotropically and propagated through the phantom in a matter similar to diffusion. High-energy neutrons, on the other hand, were emitted and scattered with forward-peaked angular distributions and did not exhibit diffusionlike propagation.
Figure 3.
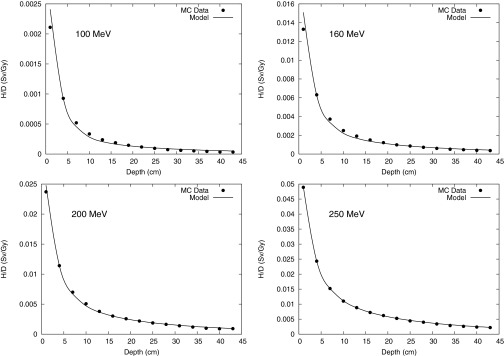
Monte Carlo calculation and analytical model prediction of neutron equivalent dose per therapeutic dose (H/D) values along the CAX at 100-, 160-, 200-, and 250-MeV proton energies.
Figure 4.
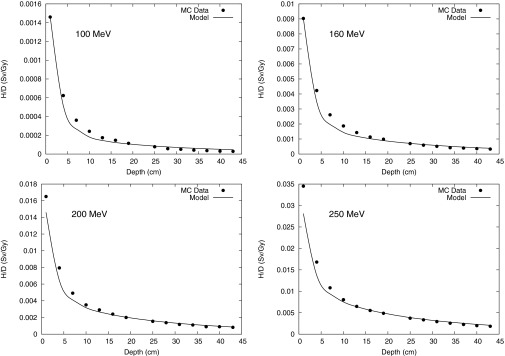
Monte Carlo calculation and analytical model prediction of neutron equivalent dose per therapeutic dose (H/D) values at 10 cm OAX at 100-, 160-, 200-, and 250-MeV proton energies.
Figure 5.
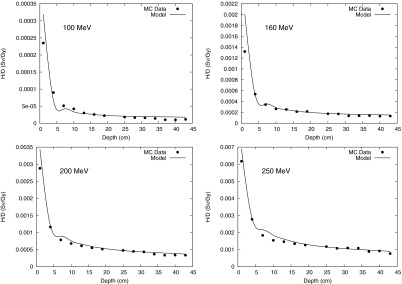
Monte Carlo calculation and analytical model prediction for neutron equivalent dose per therapeutic dose (H/D) values at 40 cm OAX at 100-, 160-, 200-, and 250-MeV proton energies.
Figure 6.
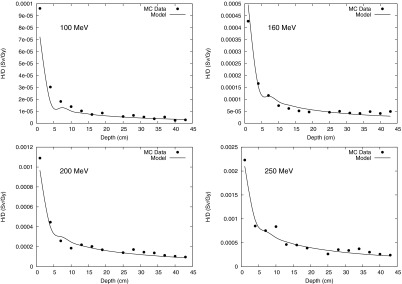
Monte Carlo calculation and analytical model prediction for neutron equivalent dose per therapeutic dose (H/D) values at 80 cm OAX at 100-, 160-, 200-, and 250-MeV proton energies.
Figure 7.
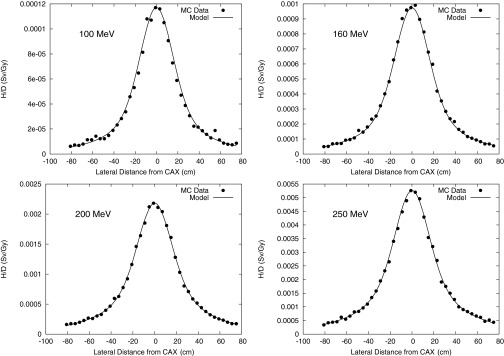
Monte Carlo calculation and analytical model prediction of the neutron equivalent dose per therapeutic dose (H/D) values at various OAX positions at 100-, 160-, 200-, and 250-MeV proton energies at a depth of 22 cm in the phantom.
Table 1.
Fitting parameters: H/D contributions from intranuclear cascade (C1), evaporation (C2), epithermal (C3), and thermal (C4) neutrons. Ep represents the proton beam energy. From Eq. 4.
| Ep (MeV) | C1 | C2 | C3 | C4 |
|---|---|---|---|---|
| 100 | 6.29 × 10⁻¹ | 4.51 × 10⁻² | 3.2 × 10⁻¹ | 5.52 × 10⁻³ |
| 120 | 6.20 × 10⁻¹ | 5.57 × 10⁻² | 3.2 × 10⁻¹ | 4.28 × 10⁻³ |
| 140 | 6.14 × 10⁻¹ | 6.23 × 10⁻² | 3.2 × 10⁻¹ | 4.01 × 10⁻³ |
| 160 | 6.14 × 10⁻¹ | 6.26 × 10⁻² | 3.2 × 10⁻¹ | 3.81 × 10⁻³ |
| 180 | 5.14 × 10⁻¹ | 1.35 × 10⁻¹ | 3.2 × 10⁻¹ | 3.19 × 10⁻³ |
| 200 | 5.47 × 10⁻¹ | 1.30 × 10⁻¹ | 3.2 × 10⁻¹ | 2.43 × 10⁻³ |
| 225 | 5.82 × 10⁻¹ | 1.85 × 10⁻¹ | 2.3 × 10⁻¹ | 2.49 × 10⁻³ |
| 250 | 5.43 × 10⁻¹ | 1.36 × 10⁻¹ | 3.2 × 10⁻¹ | 1.75 × 10⁻³ |
Table 2.
Fitting parameters: neutron attenuation (α1, α2, α3, and α4) and lateral distribution (σ1, σ2, σ3, and σ4) for the four neutron components. From Eq. 4.
| Fitting | α1 | α2 | α3 | α4 | σ1 | σ2 | σ3 | σ4 |
|---|---|---|---|---|---|---|---|---|
| parameter | (cm−1) | (cm−1) | (cm−1) | (cm−1) | (cm) | (cm) | (cm) | (cm) |
| Value | 0.01 | 0.013 | 0.033 | 0.33 | 16 | 400 | 4000 | 4000 |
Table 3 lists the average and maximum percentage differences between the H/D values calculated with Monte Carlo simulations and those predicted by the analytical model at CAX for all energies studied. The average percent difference at CAX ranged from 2.5% to 21.7%. The largest value was found for the 100-MeV proton energy, with the largest percentage difference occurring at a depth of 40 cm in the phantom. The largest average percent differences between the Monte Carlo calculation and the analytical model values were found mainly in two locations, at the shallowest depth and at the deepest depths. This pattern was mainly observed for the lower proton beam energies and for OAX distances. Table 4 lists the average percentage and maximum percentage differences observed at 40 cm OAX for each proton beam energy considered; the average percent difference ranged from 6.6% to 30%, with the maximum values occurring at shallow depths. This could be an indication that the model is overattenuating the low-energy neutron component for this energy. At 80 cm OAX, the average percentage difference was larger than at the other positions at all energies considered, and the maximum percentage difference occurred at depth deeper than 37 cm in the water phantom.
Table 3.
Average percentage difference, , and maximum percentage difference, , between H/D values calculated by Monte Carlo method and the analytical model along CAX. Ep denotes the proton beam energy, and z is the depth in the phantom.
| Ep (MeV) | (%) | (%) | z at (cm) |
|---|---|---|---|
| 100 | 21.7 | 62.5 | 40 |
| 120 | 15.5 | 42.0 | 40 |
| 140 | 11.4 | 30.6 | 40 |
| 160 | 9.0 | 18.0 | 40 |
| 180 | 6.9 | 15.5 | 1 |
| 200 | 4.9 | 17.3 | 37 |
| 225 | 5.8 | 12.9 | 1 |
| 250 | 2.5 | 9.9 | 34 |
Table 4.
Average percentage difference, , and maximum percentage difference, , between H/D values calculated by Monte Carlo methods and the analytical model at 40 cm OAX. Ep denotes the proton beam energy and z is the depth in the phantom.
| Ep (MeV) | (%) | (%) | z at (cm) |
|---|---|---|---|
| 100 | 30.0 | 81.7 | 40 |
| 120 | 26.0 | 58.9 | 37 |
| 140 | 14.8 | 51.7 | 1 |
| 160 | 12.3 | 51.8 | 1 |
| 180 | 6.6 | 19.7 | 1 |
| 200 | 9.0 | 19.3 | 1 |
| 225 | 7.4 | 27.6 | 1 |
| 250 | 8.4 | 19.0 | 10 |
In addition to calculating the H/D values, we calculated values as a function of location in the phantom. Figure 8 plots as a function of depth along and lateral to the CAX. was highest at the shallowest depth and decreased with depth until around 10 cm, where it started to increase slowly with depth. did not exhibit dependence on OAX distance.
Figure 8.
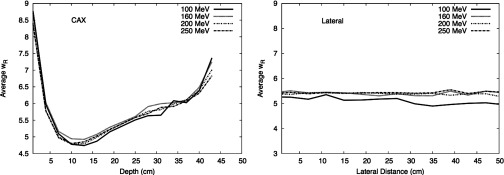
values for each detecting volume position along CAX and lateral to CAX for 100-, 160-, 200-, and 250-MeV proton energies. was calculated using the formalism from ICRP Publication 92 (Ref. 32) and the neutron spectral fluence calculated in our work.
The behavior of in the phantom was found to be very similar among the proton energies considered. The value was largest at the entrance of the water phantom, decreased until around a depth of 10 cm in the phantom, and increased beyond that depth. In addition, we found that the behavior of can be described with the following fit:
| (5) |
where a, b, and c are fitting parameters, x is the depth along CAX or OAX, and d is the depth corresponding to the minimum value of . Table 5 presents the fitting parameters for CAX, 10 cm OAX, 40 cm OAX, and 80 cm OAX.
Table 5.
Fitted values parameters for .
| Fitting parameters |
||||
|---|---|---|---|---|
| Position | a | b | c | d |
| CAX | 1.73 | 0.09 | 4.72 | 10.70 |
| 10 cm OAX | 1.91 | 0.12 | 4.18 | 8.56 |
| 40 cm OAX | 2.03 | 0.11 | 4.20 | 9.05 |
| 80 cm OAX | 1.73 | 0.09 | 4.66 | 10.43 |
DISCUSSION
We developed an analytical model to predict H/D for proton therapy at proton energies from 100 to 250 MeV. We also characterized the behavior of in a water phantom. In this study, we showed for the first time that it is possible to analytically model H/D for a passive beam delivery system over a wide range of proton beam energies. Two of the major strengths of this study were its inclusion of a detailed and highly realistic model of the treatment apparatus and the characterization of the behavior of the mean radiation weighting factor for neutrons as a function of position in a phantom. The analytical model of H/D takes into account the production, divergence, and attenuation of four neutron energy regimes as a function of depth and OAX distance in a water box phantom. This study's major qualitative finding is that it is possible to expand the interval of applicability of the analytical model to cover the entire energy interval of clinical relevance. In addition, we found that accurate modeling of H/D requires consideration of at least four distinct neutron energy regimes; this is an important finding because it leads to a physically realistic model in which the neutron attenuation and lateral distribution coefficients of the model depend on neutron energy but are independent of the proton beam energy. This independence is important because it simplifies the practical deployment of the model by reducing the number of free parameters. In contrast, the previous, more empirical approach by Zhang et al.25 used only two neutron energy regimes and was less physically realistic because the model parameters depended on both neutron and proton energies. Here we achieved good agreement between the analytical model and the Monte Carlo calculations, suggesting that an analytical model may provide an attractive alternative to the Monte Carlo method. In terms of the accuracy of the Monte Carlo calculation, measurements of H/D by our group have shown that neutron doses are within 30% of corresponding MCNPX predictions (paper in preparation). This finding is broadly consistent with what other studies have reported.11, 30 Tayama et al.12 also benchmarked MCNPX against measurements, and the percentage differences between their measurements and the Monte Carlo calculations were within 10%.
The neutron exposure values obtained in the current study are also consistent with what others have presented.4, 16, 17, 24, 25, 26, 35 Our H/D values show a clear dependence on distance from the effective neutron source and lateral distance from the CAX, confirming a similar finding from Zheng et al.24 Our findings have yielded interesting insights into neutron production in a passively scattered proton beam delivery system with a closed aperture. Specifically, the source was spatially distributed, and by considering four neutron energy regimes, we found that the largest contribution is due to intranuclear cascade neutrons (C1), followed by epithermal neutrons (C3). We noticed that the contribution from epithermal neutrons (C3) is approximately constant over all proton beam energies considered. We also noticed an apparently nonphysical “jump” in the values of C1 and C2 when going from 180 to 200 MeV; we attributed that to the Monte Carlo code's transition from using lookup tables of evaluated cross-section data to on-the-fly calculations of nuclear cross sections using high-energy nuclear interaction models.
Meanwhile, was found to be the largest at the entrance of the water phantom for all energies, which could be a result of the contribution of low- and high-energy neutrons produced by interactions between the beam and the treatment nozzle. As neutrons penetrated the phantom, hardening diminished the low-energy neutron component, and the higher-energy neutrons eventually predominated at greater depths, i.e., beyond about 10 cm in the phantom.
Our findings on the behavior of are also consistent with data from other studies. For instance, a study of a passive delivery system by Moyers et al.17 showed that low-energy neutrons predominate at the entrance of the phantom, with these neutrons’ contribution diminishing as depth increases. In addition based on the fitting of , we can see that the behavior of is almost independent of proton beam energy and position lateral of CAX (see Fig. 9).
Figure 9.
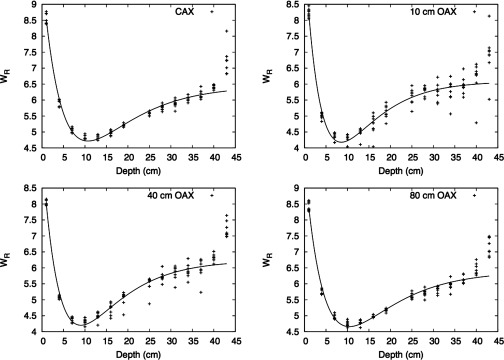
Fit for . The fit is presented as a function of depth at positions along CAX and at various OAX positions. Each type of symbol in the plot represents an energy. The plot includes all the energies at CAX and 10 40, and 80 cm OAX.
One of the limitations of this work is that we did not evaluate the model's performance in an anatomically realistic anthropomorphic phantom (with density heterogeneities, different material compositions, and irregular surfaces). However, this is not a serious limitation because the analytical model results in a water phantom are in reasonably good agreement with Monte Carlo simulations done using a model of an anthropomorphic phantom.25 Another limitation is that the method predicts only leakage exposures from only passive scattering treatment units. This, too, is not a serious limitation because most contemporary proton treatments are delivered with passively scattered beams. Therefore, developing such a model for a passive system is appropriate, as neutrons doses are higher in passive beam delivery systems than in dynamic systems.
Our findings will allow us to take the next step in developing a simple and computationally inexpensive algorithm to predict stray neutron exposures to patients who receive proton therapy. It appears that it will be feasible to model H/D with sufficient speed and accuracy for routine research and clinical applications. In fact, we speculate that our findings may encourage further development of analytical models and their implementation in research and commercial treatment planning systems. Our study adds to the small but growing body of evidence suggesting an analytical modeling approach may provide an acceptable alternative to full-blown Monte Carlo simulations of stray radiation. This capability will be important for avoiding late radiation effects from proton therapy.
Future work should attempt to extend this analytical model to accommodate patient-specific anatomical phantoms, i.e., based on computed tomography images. In addition, this model should be evaluated for its performance in conditions other than interaction between a pristine proton beam and a closed aperture. Attempts should also be made to apply this model to the neutrons produced during passive scattering and dynamic beam delivery. We have begun investigating practical aspects of implementing the analytical algorithm described here in a four-dimensional research treatment planning system (paper in preparation). That study aims to test the feasibility of the algorithm, explore the effects of tissue heterogeneity and irregular surface contours, and obtain timing information.
Finally, this work was done for the specific treatment nozzle characteristics of our institution. Although other passive systems use components similar to the ones simulated here, the specific nozzle designs and the H/D data are not available for general use, and therefore training of this model will need to be called out for each type of treatment nozzle. Nevertheless, our work suggests that analytical modeling of H/D should be applicable for use with other passive system designs.
CONCLUSIONS
In this study, we extended the useful range of applicability of an analytical model to predict H/D values from 100- to 250-MeV proton beam energy. Good agreement was found between the model and predictions by Monte Carlo simulations. In addition, we characterized the variations in in a water phantom, revealing strong dependency on depth in water but no dependency on distance from the CAX or proton beam energy. The results obtained in this work suggest it may be possible to develop an analytical model to be used routinely in clinical treatment planning systems.
ACKNOWLEDGMENTS
The authors gratefully acknowledge Ms. Kathryn Carnes for assistance in preparing this paper. This work was funded in part by a grant to Northern Illinois University through a Department of Defense subcontract (Award No. W81XWH-08-1-0205), as well as by the National Cancer Institute (Award No. 1 R01 CA13146301A1), the Sowell-Huggins Scholarship, and The University of Texas Graduate School of Biomedical Science President's Research Scholarship.
References
- Inskip P. D., Ries L. A. G., Cohen R. J., and Curtis R. E., “Chapter 18: New maligancies following childhood cancer,” New Malignancies Among Cancer Survivors: SEER Cancer Registries, 1973–2000 (National Cancer Institute, Bethesda, MD, 2006). [Google Scholar]
- Fraumeni J. F., Curtis R. E., Edwards A. C., and Tucker M. A., “Chapter 1: Introduction,” New Malignancies Among Cancer Survivors: SEER Cancer Registries, 1973–2000 (National Cancer Institute, Bethesda, MD, 2006). [Google Scholar]
- The International Commission on Radiation Units and Measurements, “Prescribing, recording, and reporting proton-beam therapy,” ICRU Report No. 78 (ICRU Publications, Bethesda, MD, 2007).
- Newhauser W. D., Fontenot J. D., Mahajan A., Kornguth D., Stovall M., Zheng Y., Taddei P. J., Mirkovic D., Mohan R., Cox J. D., and Woo S., “The risk of developing a second cancer after receiving craniospinal proton irradiation,” Phys. Med. Biol. 54, 2277–2291 (2009). 10.1088/0031-9155/54/8/002 [DOI] [PMC free article] [PubMed] [Google Scholar]
- Hecksel D., Sandison G. A., Farr J. B., and Edwards A. C., “Scattered neutron dose equivalent from an active scanning proton beam delivery system,” Australas. Phys. Eng. Sci. Med. 30, 326–330 (2007). [PubMed] [Google Scholar]
- Clasie B., Wroe A., Kooy H., Depauw N., Flanz J., Paganetti H., and Rosenfeld A., “Assessment of out-of-field absorbed dose and equivalent dose in proton fields,” Med. Phys. 37, 311–321 (2010). 10.1118/1.3271390 [DOI] [PMC free article] [PubMed] [Google Scholar]
- Perez-Andujar A., P. M.DelucaJr., Thornton A. F., Fitzek M., Hecksel D., and Farr J., “Microdosimetric measurements for meutron-absorbed dose determination during proton therapy,” Radiat. Prot. Dosim. 151(2), 365–373 (2012). 10.1093/rpd/ncs002 [DOI] [PMC free article] [PubMed] [Google Scholar]
- Yan X., Titt U., Koehler A. M., and Newhauser W. D., “Measurements of neutron dose equivalent to proton therapy patients outside of the proton radiation field.,” Nucl. Instrum. Methods Phys. Res. A 476, 429–434 (2002). 10.1016/S0168-9002(01)01483-8 [DOI] [Google Scholar]
- Schneider U., Agosteo S., Pedroni E., and Besserer J., “Secondary neutron dose during proton therapy using spot scanning,” Int. J. Radiat. Oncol., Biol., Phys. 53, 244–251 (2002). 10.1016/S0360-3016(01)02826-7 [DOI] [PubMed] [Google Scholar]
- Newhauser W. D., Titt U., Dexheimer D., Yan X., and Nill S., “Neutron shielding verification measurements and simulations for a 235-MeV proton therapy center,” Nucl. Instrum. Methods Phys. Res. A 476, 80–84 (2002). 10.1016/S0168-9002(01)01400-0 [DOI] [Google Scholar]
- Polf J. C. and Newhauser W. D., “Calculations of neutron dose equivalent exposures from range-modulated proton therapy beams,” Phys. Med. Biol. 50, 3859–3873 (2005). 10.1088/0031-9155/50/16/014 [DOI] [PubMed] [Google Scholar]
- Tayama R., Fujita Y., Tadokoro M., Fujimaki H., Sakae T., and Terunuma T., “Measurement of neutron dose distribution for a passive scattering nozzle at the Proton Medical Research Center (PMRC),” Nucl. Instrum. Methods Phys. Res. A 564, 532–536 (2006). 10.1016/j.nima.2006.04.028 [DOI] [Google Scholar]
- Perez-Andujar A., Newhauser W. D., and Deluca P. M., “Neutron production from beam-modifying devices in a modern double scattering proton therapy beam delivery system,” Phys. Med. Biol. 54, 993–1008 (2009). 10.1088/0031-9155/54/4/012 [DOI] [PMC free article] [PubMed] [Google Scholar]
- Fontenot J., Taddei P., Zheng Y., Mirkovic D., Jordan T., and Newhauser W., “Equivalent dose and effective dose from stray radiation during passively scattered proton radiotherapy for prostate cancer,” Phys. Med. Biol. 53, 1677–1688 (2008). 10.1088/0031-9155/53/6/012 [DOI] [PubMed] [Google Scholar]
- Wroe A., Rosenfeld A., and Schulte R., “Out-of-field dose equivalents delivered by proton therapy of prostate cancer,” Med. Phys. 34, 3449–3456 (2007). 10.1118/1.2759839 [DOI] [PubMed] [Google Scholar]
- Yonai S., Matsufuji N., Kanai T., Matsui Y., Matsushita K., Yamashita H., Numano M., Sakae T., Terunuma T., Nishio T., Kohno R., and Akagi T., “Measurement of neutron ambient dose equivalent in passive carbon-ion and proton radiotherapies,” Med. Phys. 35, 4782–4792 (2008). 10.1118/1.2989019 [DOI] [PubMed] [Google Scholar]
- Moyers M. F., Benton E. R., Ghebremedhin A., and Coutrakon G., “Leakage and scatter radiation from a double scattering based proton beamline,” Med. Phys. 35, 128–144 (2008). 10.1118/1.2805086 [DOI] [PubMed] [Google Scholar]
- Bues M., Newhauser W. D., Titt U., and Smith A. R., “Therapeutic step and shoot proton beam spot-scanning with a multi-leaf collimator: A Monte Carlo study,” Radiat. Prot. Dosim. 115, 164–169 (2005). 10.1093/rpd/nci259 [DOI] [PubMed] [Google Scholar]
- Merchant T. E., “Proton beam therapy in pediatric oncology,” Cancer J. 15, 298–305 (2009). 10.1097/PPO.0b013e3181b6d4b7 [DOI] [PubMed] [Google Scholar]
- Jiang H., Wang B., Xu X. G., Suit H. D., and Paganetti H., “Simulation of organ-specific patient effective dose due to secondary neutrons in proton radiation treatment,” Phys. Med. Biol. 50, 4337–4353 (2005). 10.1088/0031-9155/50/18/007 [DOI] [PubMed] [Google Scholar]
- Newhauser W. D., Zheng Y., Taddei P. J., Mirkovic D., Fontenot J., Giebeler A., Zhang R., Titt U., and Mohan R., “Monte Carlo proton radiation therapy planning calculations,” Trans. Am. Nucl. Soc. 99, 63–64 (2008). [Google Scholar]
- Koch N. and Newhauser W. D., “Virtual commissioning of an ocular treatment planning system,” Radiat. Prot. Dosim. 115, 159–163 (2005). 10.1093/rpd/nci224 [DOI] [PubMed] [Google Scholar]
- Newhauser W., Fontenot J., Zheng Y., Polf J., Titt U., Koch N., Zhang X., and Mohan R., “Monte Carlo simulations for configuring and testing an analytical proton dose-calculation algorithm,” Phys. Med. Biol. 52, 4569–4584 (2007). 10.1088/0031-9155/52/15/014 [DOI] [PubMed] [Google Scholar]
- Zheng Y. S., Newhauser W., Klein E., and Low D., “Monte Carlo simulation of the neutron spectral fluence and dose equivalent for use in shielding a proton therapy vault,” Phys. Med. Biol. 54, 6943–6957 (2009). 10.1088/0031-9155/54/22/013 [DOI] [PMC free article] [PubMed] [Google Scholar]
- Zhang R., Perez-Andujar A., Fontenot J. D., Taddei P. J., and Newhauser W. D., “An analytic model of neutron ambient dose equivalent and equivalent dose for proton radiotherapy,” Phys. Med. Biol. 55, 6975–6985 (2010). 10.1088/0031-9155/55/23/S01 [DOI] [PMC free article] [PubMed] [Google Scholar]
- Anferov V., “Analytic estimates of secondary neutron dose in proton therapy,” Phys. Med. Biol. 55, 7509–7522 (2010). 10.1088/0031-9155/55/24/008 [DOI] [PubMed] [Google Scholar]
- Pelowitz D. B., MCNPX User's Manual Version 2.5 (Los Alamos National Laboratory, Los Alamos, NM, 2005). [Google Scholar]
- Herault J., Iborra N., Serrano B., and Chauvel P., “Monte Carlo simulation of a protontherapy platform devoted to ocular melanoma,” Med. Phys. 32, 910–919 (2005). 10.1118/1.1871392 [DOI] [PubMed] [Google Scholar]
- Koch N., Newhauser W. D., Titt U., Gombos D., Coombes K., and Starkschall G., “Monte Carlo calculations and measurements of absorbed dose per monitor unit for the treatment of uveal melanoma with proton therapy,” Phys. Med. Biol. 53, 1581–1594 (2008). 10.1088/0031-9155/53/6/005 [DOI] [PMC free article] [PubMed] [Google Scholar]
- Fontenot J. D., Newhauser W. D., and Titt U., “Design tools for proton therapy nozzles based on the double-scattering foil technique,” Radiat. Prot. Dosim. 116, 211–215 (2005). 10.1093/rpd/nci229 [DOI] [PubMed] [Google Scholar]
- Zheng Y., Newhauser W. D., Fontenot J., Taddei P., and Mohan R., “Monte Carlo study of neutron dose equivalent during passive scattering proton therapy,” Phys. Med. Biol. 52, 4481–4496 (2007). 10.1088/0031-9155/52/15/008 [DOI] [PubMed] [Google Scholar]
- ICRP, “ICRP Publication 92: Relative Biological Effectiveness (RBE), Quality Factor (Q), and Radiation Weighting Factor (wR)” (International Commission on Radiological Protection, Bethesda, MD, 2003). [DOI] [PubMed]
- Lasdon L. S., Waren A. D., Jain A., and Ratner M., “Design and testing of a generalized reduced gradient code for nonlinear programming,” ACM ACM Trans. Math. Softw. 4, 34–49 (1978). 10.1145/355769.355773 [DOI] [Google Scholar]
- Press W. H., Flannery B. P., Teukolsky S. A., and Vatterling W. T., Numerical Recipes in C (Cambridge University Press, New York, 1992). [Google Scholar]
- Kaderka R., Schardt D., Durante M., Berger T., Ramm U., Licher J., and La Tessa C., “Out-of-field dose measurements in a water phantom using different radiotherapy modalities,” Phys. Med. Biol. 57, 5059–5074 (2012). 10.1088/0031-9155/57/16/5059 [DOI] [PubMed] [Google Scholar]