

Abstract
For a parasite evolving in a spatially structured environment, an evolutionarily advantageous strategy may be to reduce its transmission rate or infectivity. We demonstrate this empirically using bacteriophage (phage) from an evolution experiment where spatial structure was maintained over 550 phage generations on agar plates. We found that a single substitution in the major capsid protein led to slower adsorption of phage to host cells with no change in lysis time or burst size. Plaques formed by phage isolates containing this mutation were not only larger but also contained more phage per unit area. Using a spatially explicit, individual-based model, we showed that when there is a trade-off between adsorption and diffusion (i.e. less ‘sticky’ phage diffuse further), slow adsorption can maximize plaque size, plaque density and overall productivity. These findings suggest that less infective pathogens may have an advantage in spatially structured populations, even when well-mixed models predict that they will not.
Keywords: spatial structure, bacteriophages, evolution, adsorption
1. Introduction
Spatial structure plays an important role in shaping the ecological and evolutionary dynamics of many natural populations [1,2]. A number of theoretical and experimental studies have shown that conditions of restricted migration and/or limited dispersal lead to localized competition, increased diversity and slower adaptation through selective sweeps [3–5]. An understanding of how structure affects these dynamics is vital in making predictions about the evolution and spread of pathogens and has important implications for human health.
Classical infectious disease theory based on mass-action models predicts that a parasite will evolve to maximize its basic reproductive ratio R0 (the number of secondary infections resulting from a single infected individual in a population of susceptibles) [6]. This fitness measure is dependent on a number of factors, including parasite infectivity and virulence, host recovery rate and density of susceptible hosts. There is now a large body of theoretical work which shows that spatial structure significantly impacts the evolution of parasite life-history traits and affects predictions of disease spread (e.g. [7–11]). In a simulation study using a spatial SIR model (where S = susceptible, I = infective, R = removed), Wei & Krone [11] showed that the fate of a mutant in a structured environment depends on a ratio of infectivity to virulence that is different from predictions for a well-mixed environment. Rand et al. [10] used a generic host–pathogen model and showed that while infectivity evolves to the maximum possible value in a well-mixed system, it reaches a critical, finite value in a spatially structured world. Similar results were found with lattice-based SIR models by Boots, Haraguchi and Sasaki [7,9]. One intuitive explanation provided by these authors was that low infectivity leads to an increase in the local density of susceptible hosts, while high infectivity strains rapidly exploit local susceptibles causing infected individuals to ‘self-shade’ by surrounding themselves with other infected individuals [7,9].
However, evidence of such phenotypic evolution owing to spatial structure in natural and experimentally evolved populations has been relatively scarce, aside from a few recent exceptions. Boots & Mealor [12] tested the theory of reduced infectivity in spatial structure using an insect larval virus where hosts move through a medium whose viscosity was experimentally controlled. They found that the infectivity of the virus was the lowest in the most viscous environment (highest degree of spatial structuring). Kerr and co-workers [13] used a robotic liquid-handling system to control migration rate between wells in a 96-well plate to simulate a metapopulation structure and found that restricted migration favours less competitive or ‘prudent’ parasites that are characterized by lower infectivity and virulence.
Bacteriophages (phages) are useful systems for observing the dynamics of adaptation through experimental evolution, and many parallels can be drawn between phage evolution and disease evolution [14]. For example, measures of the rate of (irreversible) adsorption of phage to the surface of host cells [15] can be considered analogous to pathogen infectivity (the rate at which susceptible hosts becomes infected) [13]. We can therefore use phages as model systems to investigate the effects of changes in life-history traits on parasite fitness. When provided with an unlimited supply of hosts, phage fitness is determined completely by three phenotypes: adsorption rate, burst size and lysis time [16]. When mixed with host cells growing as a lawn on agar plates, lytic phages produce clearings called plaques, which serve as models for population growth in a spatially structured environment [17,18]. Plaque size and the concentration of phage within the plaque (which we call plaque density) can be used as measures of phage fitness [19,20], and we can therefore link changes in life-history parameters, such as adsorption rate, lysis time and burst size to fitness, to determine what phenotypes (if any) are optimal in a spatially structured environment [21,22]. Using sequence data, we can also attempt to find the genetic basis of phenotypic changes by comparing sequences of ancestral and derived strains [23,24].
In this work, we investigate the effect of spatial structure on the evolution of pathogen life-history traits with a joint theoretical–experimental approach using a lytic phage of Escherichia coli. Sampling from a phage population that had been spatially evolved by serial passaging on agar plates for over 500 generations, we first determined the phenotypic components of fitness in selected isolates. We found that isolates with a particular single amino acid change in the major capsid protein F showed significantly slower adsorption with no change in lysis time and burst size, and these isolates had significantly higher fitness on plates. This substitution was found at high frequency in multiple replicate-evolved populations, suggesting that it is adaptive. We then used a mathematical model to examine whether slower adsorption alone can lead to higher fitness in a spatial setting, and what trade-offs (e.g. between adsorption and diffusion) and ecological factors (e.g. density of susceptible hosts) may be associated with these phenotypic changes, which appear to have a relatively simple genetic basis. Finally, we discuss the implications of these results in the context of disease evolution.
2. Material and methods
(a). Strains and culture conditions
We used a strain of phage ID11 [25] (GenBank accession no. AY751298.1), a G4-like single-stranded DNA virus from the family Microviridae, with a genome 5577 nt long encoding 11 genes. The host bacterium used was E. coli C, obtained from Holly Wichman (University of Idaho, Moscow). All phage assays were performed at 33°C, which is optimal for ID11 with E. coli C [26]. At this temperature, ID11 forms visible plaques after approximately 3 h of incubation.
The phage strains analysed in this work were obtained from the endpoint of an experiment where an ancestral strain of ID11 (labelled Anc, see the electronic supplementary material) was evolved by serial passaging on agar plates for 50 transfers, which corresponds to approximately 550 phage generations. The derived strains (labelled Iso1 and Iso2) were obtained by sampling a small square region from one of the replicate-evolved populations, selecting single plaques and looking for a specific mutation in protein F (F378; table 1), which was detected at high frequency in the evolved population. Iso1 had this substitution alone, whereas Iso2 was found to have two mutations in F (F378 and F184). We also assayed the subpopulation from which the samples were obtained (labelled Pop) to determine the ‘averaged’ phenotypes and fitness of the phage population sampled from the square. More details about culture conditions, sequencing and the evolution experiment from which the derived strains were obtained can be found in the electronic supplementary material.
Table 1.
Bacteriophage strains assayed.
| strains | nt posa | nt changeb | gene | positionc | aa changed |
|---|---|---|---|---|---|
| Anc | ancestral ID11 strain | ||||
| Iso1 | 3734 | a → g | F | 378 | K → E |
| Iso2 | 3734 | a → g | F | 378 | K → E |
| 3152 | a → g | F | 184 | T → A | |
| Pop | population from square 3C, plate ST-1 | ||||
Substitutions are identified by their aposition in the ID11 genome binitial and final nucleotide using the genome of wild-type ID11 (GenBank AY751298.1) as a reference; clocation of change in amino acid sequence; damino acid change. (See the electronic supplementary material for more details about strains and sequencing.)
(b). Phenotypic assays
To investigate the phenotypic effects of the mutations, we performed assays to measure adsorption rate, lysis curve, plaque size and plaque density. The two isolates (Iso1 and Iso2), the population from the square (Pop) and the ancestor (Anc) were assayed in parallel. All assays were replicated between three and seven times and error bars in all figures represent ±1 s.e.m.
(i). Adsorption rate assay
To determine differences in adsorption between the different strains, approximately 5 × 10⁵ phage particles were added to an Erlenmeyer flask containing 10 ml of prewarmed (to 33°C) phage lysogeny broth (LB) with approximately 2 × 10⁸ colony forming units ml−1 of E. coli C in a shaking water bath at 200 r.p.m. After adding phage (t = 0), samples of approximately 600 μl were drawn at t = 30 s, 1 min 30 s and 2 min 30 s using 1 ml sterile disposable syringes and immediately passed through a sterile 0.2 μm cellulose acetate filter (VWR International, Radnor, PA, USA) to separate unattached phage from cells and adsorbed phage. The filtrate was plated using standard techniques (see the electronic supplementary material) to determine the number of unadsorbed phage in the solution.
(ii). Lysis curve
Phage were pre-adsorbed to cells by adding 106 phage to 1 ml of CaCl2-supplemented LB broth containing approximately 2 × 10⁸ cells at 14°C and incubating for 1 h. After 1 h, adsorbed phage were pelletted with cells by centrifuging the mixture at 13 000 r.p.m. for 5 min in a cold room. The pellet was re-suspended in 1 ml of cold LB broth and added to 9 ml of broth that had been prewarmed to 33°C in a shaking water bath at 200 r.p.m., causing synchronized ejection [27] of phage DNA (t = 0). Samples were drawn at t = 5, 8, 10, 13, 15, 17, 20, 25, 30, 35 and 40 min and plated immediately. The phage concentration at each time point was divided by the starting concentration and plotted against elapsed time. The curve shows an initial rise corresponding to the start of lysis, a plateau that indicates the end of lysis and the second rise corresponding to the start of lysis events from the second round of infections.
(iii). Plaque size
Plaque size was determined by plating phage using dilutions that produced between 10 and 30 plaques per plate and taking digital photographs after 6 h of incubation at 33°C. The dilution was chosen to minimize the number of overlapping plaques and a longer incubation period was chosen so that plaques were large and clear enough to be analysed. Images were analysed using the ImageJ software [28] with the ABSnake plug-in [29]. Images were contrast-corrected and converted to greyscale before applying the plug-in on non-overlapping plaques; the ABSnake plug-in performs semi-automatic edge detection to trace individual plaque boundaries. The diameter for each plaque was computed using the measured area of the plaque, and then converted from pixels to mm by using the outer diameter of the Petri dish to determine the scale for each image. The plaques were sorted by diameter and the 20 largest plaques for each line were used in the analysis.
(iv). Plaque density
We use the term plaque density to refer to the concentration of phage within a small circular region within a single plaque (similar to plaque productivity in [30]). Phage were plated using dilutions that produced between 10 and 50 plaques per plate. After incubating the plates at 33°C for 3 h, agar plugs were pulled from the centres of non-overlapping plaques using a Pasteur pipette with an inner diameter of approximately 1 mm (Fisher Scientific). Plugs were dropped into 750 µl of LB broth containing three to four drops of chloroform. Cell debris was removed by centrifuging the mixture at 13 000 r.p.m. for 4 min and extracting the supernatant. After sitting overnight at 4°C to allow titres to stabilize, samples of the supernatant were drawn and plated using appropriate dilutions to determine phage titre in plaque forming units (PFU) per millilitre. This concentration provides an estimate of the number of viable phage within the area sampled in the plaque.
(c). Mathematical model
We have developed a spatially explicit, individual-based stochastic model that incorporates key aspects of phage and host life cycles, to examine how changes in phage phenotypes affect fitness. Our model belongs to a class of models known as interacting particle systems or asynchronously updated probabilistic cellular automata [1,31]. Simulations were run on a 200 × 200 grid of sites; each site on the grid can be empty or occupied by a single bacterial host cell and/or one or more phage. A host cell can be in one of the following states: uninfected (susceptible to infection by phage), infected or lysed. The state of the host cell and the population of phage at a site change probabilistically according to rates of various life-cycle events, such as adsorption (attachment), lysis and host cell division. These rates determine the ‘wait time’ at the site (the time taken for the site to change its state) which is a random variable whose mean is equal to reciprocal of the corresponding rate.
Phage are either ‘free’ (phage that have not yet infected a host cell) or ‘replicating’ (phage that have infected a cell and are undergoing replication within a host cell). When free phage are present at a site occupied by a susceptible cell, the cell becomes infected at a rate that depends on the attachment time of the phage, i.e. the total time taken for a phage to successfully infect the host cell (irreversible adsorption). If an attachment event does not occur, free phage at the focal site are distributed randomly within a 3 × 3 neighbourhood using a two-dimensional truncated, discretized Gaussian kernel, i.e. the number of phage at a site with coordinates (x,y) relative to the focal site is given by PfocalG(x,y), where Pfocal is the number of phage currently at the focal site and G(x,y) is given by
| 2.1 |
with σ = 1.2. This simulates the diffusion of phage (cells are assumed to be immobile) and also incorporates an attachment–diffusion trade-off. Free phage are ‘lost’ when they attempt to attach to host cells that have already been infected by another phage particle or when they attach to lysed cells (cell debris following lysis). For the purposes of this work, we ignored superinfection. Multiple cycles of phage diffusion, infection of cells and lysis lead to the formation of a plaque (see the electronic supplementary material, figure S3).
After a length of time defined as the latent period or lysis time (L), the infected cell lyses and progeny phage are scattered within a 3 × 3 neighbourhood of the focal site to begin new infection cycles or diffuse across the grid. At each lysis event, the burst size (B) is determined using the equation
| 2.2 |
where E represents the end of the eclipse period (the earliest time that viable phage progeny are seen within the infected cell). This linear relationship between burst size and lysis time was described by Wang et al. [21] and has been subsequently used in a number of phage models [14,22,23]. We assume that the number of intracellular phage cannot increase indefinitely [21,23] and that there is a maximum possible burst size of 200 progeny per infected cell. This maximum was an estimate based on observations of our lysis time/burst size assays, where we found that our ID11 strains had mean burst sizes of about 110 with s.e. of approximately 10 for n = 6 replicate assays per strain.
Uninfected host cells undergo division at a rate that depends on the doubling time of the host. This rate is scaled according to the number of vacant sites within a 5 × 5 neighbourhood of the focal site to simulate local Monod-like density dependence [32], so that cells which are surrounded by more vacant sites divide faster. Daughter cells are placed in the immediate neighbourhood of the focal site and division is suppressed if all sites in the neighbourhood are occupied. For simplicity, we assume that infected cells do not undergo normal cell division. We also assume the following: infected cells do not lyse during eclipse; mutations that occur in the phage during the incubation period do not significantly affect life-history parameters in the model; the host does not become resistant to phage infection; and the effect of multiple infection of a single host is negligible.
Simulations start with a single infected cell at the centre of the grid. The remaining sites contain uninfected cells and vacant sites, depending on the starting host density (varied as described below). Sites are updated in random order according to the rules described above, and the simulation runs for approximately 7 × 10⁶ time steps, to simulate an incubation of 3 h (see the electronic supplementary material). Cell and phage populations are recorded every 40 000 simulation steps to track population dynamics and the size of the plaque formed is determined at the end of the simulation. The model was developed in R [33] and simulations were run five times for each parameter combination. R-scripts for the model can be downloaded from http://dx.doi.org/10.6084/m9.figshare.745810.
(d). Simulation set-up and parameters
To determine whether a difference in attachment alone can lead to increases in fitness, we used the model to simulate the growth of a single plaque on the grid. Parameters used in the simulation were either obtained from experiments or were estimates based on other similar phages, for example φX174. Lysis time (L) was drawn from a truncated normal distribution between Lmin = 14 min and Lmax = 20 min with a mean of 17 min and s.d. 1 min. These values were obtained from the lysis curves of Anc, Iso1 and Iso2, based on the start of lysis, the beginning of the plateau and the midpoint of these two values (figure 1b). Eclipse (E) was drawn from a normal distribution with mean of 11.3 min and s.d. 0.7 min. This was an estimate obtained from the observation that the closely related phage φX174 spends approximately 70% of its latent period (the time between adsorption and lysis) in eclipse [34]. At each lysis event, the burst size (B) was determined using equation (2.2), and the constant of proportionality R was drawn from a normal distribution whose mean and standard deviation were chosen such that the average burst size obtained was between 100 and 120. This corresponds to the approximate start of the plateaus in the lysis curves. The adsorption rate, expressed as a probability of attachment of phage when a site contains free phage and cells or debris, was varied between patt = 0.025 and 0.75; and the starting density of the host (H) was varied between 0.1 and 1 (representing the fraction of total grid sites occupied by uninfected host cells at the start of the simulation). To decouple the effects of host density from host population growth, the simulations were performed with static (no host cell division) and dynamic (uninfected cells divide at a rate of three doublings per hour) host populations.
Figure 1.

(a) Evolved phage (Iso1, Iso2 and Pop) adsorb more slowly than the ancestor (Anc). (b) No significant differences in lysis profiles for the isolates, but the evolved population appears to start lysis later than the ancestor and reaches a lower end population by t = 40 min.
3. Results
(a). Evolved phage adsorb more slowly than the ancestor
In the adsorption assays, we found that when ancestral phage were mixed with host cells at low multiplicities of infection (more than 1000 cells per phage), more than 70% (0.73 ± 0.02) of phage had adsorbed to the host 30 s after mixing host cells and phage (figure 1a). In comparison, only approximately 53% of evolved phage (0.54 ± 0.06 for Iso1 and 0.53 ± 0.03 for Iso2) had adsorbed at that time. At later time points, these values were similar for the ancestor and mutants but the initial differences are significant (Iso1: Welch's t4.78 = 3.11, p = 0.028; Iso2: t6.82 = 5.76, p < 0.001). The pooled population (Pop) showed an intermediate fraction adsorbed at t = 30 s (0.65 ± 0.03, t6.10 = 1.96, p = 0.097 compared with Anc) suggesting the presence of both fast and slow adsorbers in the pool. Differences in adsorption rate computed using the method of Crill et al. [35] showed the same trends (see the electronic supplementary material).
(b). No significant differences in lysis curves
Lysis curves of evolved phage were compared against the ancestor by looking at PFU per millilitre at each time point relative to the starting concentration (figure 1b). No significant differences were found when the lysis curves of Iso1 and Iso2 were compared time point by time point against Anc (not significant at the 0.05 level). With Pop, the differences were found to be significant at t = 15 min and at t = 35 min (K–S test: D = 0.833, p = 0.048 at both time points). These differences suggest that lysis in Pop starts later (15.26 ± 0.10 min for Pop versus 14.04 ± 0.26 min for Anc) and reaches a lower end concentration by t = 40 min (3982 ± 700 PFU ml−1 relative to start for Pop versus 7397 ± 1410 PFU ml−1 for Anc). This again points to the presence of phenotypic diversity in the evolved population.
(c). Plaques produced by evolved phage are larger and contain more phage than those of the ancestor
Plaque diameters of Iso1, Iso2 and Pop were larger than those of the ancestor by approximately 0.3 mm (figure 2a; Anc: 6.65 ± 0.01 mm; Iso 1: 6.90 ± 0.05 mm; Iso2: 6.78 ± 0.03 mm; Pop: 6.87 ± 0.05 mm), and these differences were significant at the 0.05 level (K–S test: D = 0.75, 0.70 and 0.65 for Iso1, Iso2 and Pop, respectively). In addition, plugs pulled from plaques of Iso1, Iso2 and Pop contained more than twice as many PFU per millilitre than plugs pulled from ancestral plaques (figure 2b; Iso1: Welch's t9.16 = −3.97, p = 0.003; Iso 2: t8.70 = −4.11, p = 0.003; Pop: t8.96 = −3.50, p = 0.007).
Figure 2.
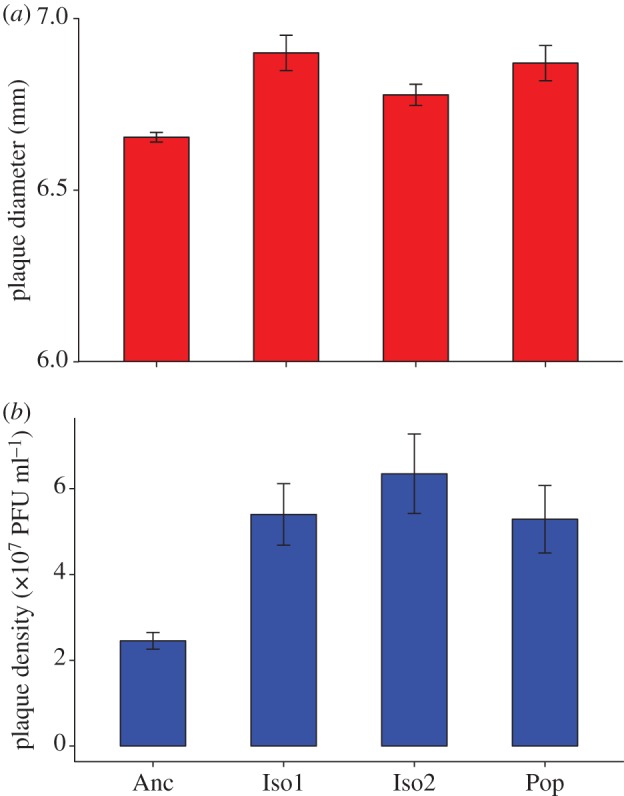
(a) Plaques of Iso1, Iso2 and Pop were larger than those of the ancestor by approximately 0.3 mm and these differences were significant at the 0.05 level. (b) In addition, plugs pulled from plaques of Iso1, Iso2 and Pop contained more than twice as many PFU per millilitre than plugs pulled from ancestral plaques. (Online version in colour.)
(d). Optimal adsorption rate and trade-offs between plaque size and productivity depend on host density
The mathematical model was used to investigate the following: (i) whether a reduction in adsorption rate (expressed as probability of attachment, patt) can lead to increased fitness; (ii) whether there is an optimal adsorption rate; and (iii) whether this optimum depends on ecological factors, such as host density (H) and growth of the host population. This was done by varying patt, H and host doublings per hour and determining plaque size and plaque density. Our simulations show (figure 3) that at high and intermediate host density (H = 1 and 0.5), large plaques are obtained at relatively low patt (less than or equal to 0.075); above this point, plaque size is a decreasing function of patt. When hosts are rare (H = 0.1), the trend is reversed and an increase in patt leads to an increase in plaque size with a maximum around patt = 0.2. However, at both low and high host densities, low attachment probability maximizes plaque density. In these simulations, the population of uninfected cells was kept constant in order to separate the effects of different host densities. In a dynamic host population where uninfected host cells were allowed to divide, the curves converge (see the electronic supplementary material, figure S2) but in all cases, relatively low patt (between 0.05 and 0.075) are optimal for maximizing plaque size, plaque density and overall productivity.
Figure 3.

Simulation results: optimal adsorption rate and trade-offs between (a) plaque size, (b) plaque density and (c) overall productivity depend on host density. At high and intermediate host density (density = 1 and 0.5), reducing probability of attachment (patt) leads to an increase in plaque size. When hosts are rare (density = 0.1), an increase in patt leads to an increase in plaque size with the maximum around patt = 0.2. However, at both low and high host densities, slow adsorption maximizes plaque density.
4. Discussion
Phages such as φX174 and ID11 are ideal model organisms for asking broad questions about the evolution of pathogens and for studying the interplay between ecological and evolutionary dynamics [24]. Their genomes are small and well characterized [25] and this provides us with the luxury of being able to map genotype to phenotype to fitness, which is difficult in other organisms [23]. In this study, we found that isolates obtained from a population of phage evolved on surfaces for over 500 generations that have a single point mutation in the major capsid protein (F378) of ID11 have significantly slower adsorption but no difference in lysis timing or burst size. The fact that this particular mutation was detected at high frequency in multiple spatial locations and multiple replicate lines in the evolved population (see the electronic supplementary material) suggests that it is adaptive. Substitutions in the major capsid protein F have been seen in other experimental evolution studies with φX174 [36,37]. Mutations in F, particularly those that occur at protein–protein interfaces have been found to affect capsid stability, which can in turn affect host recognition and virion assembly [35,38,39], but the mechanism by which the mutations we isolated might change adsorption rate is still unclear.
We explored the fitness consequences of this mutation in a spatially structured environment by measuring the size and density of plaques relative to the ancestor. Isolates bearing this mutation produced larger plaques that also had more phage per unit area. This is consistent with the findings of Gallet et al. [30] who constructed isogenic strains of phage λ that differed in adsorption rate, lysis timing and virion morphology and examined the effects of these parameters on plaque formation. They found that increased adsorption rate had a negative impact on plaque size and productivity, and existing models of plaque growth (e.g. [18,22,30]) were unable to explain these results. Furthermore, in our evolution experiment (see the electronic supplementary material), phage populations were bottlenecked at each transfer by stamping a subpopulation onto naive hosts using a sterile 384 pin replicate picker. Hence, we hypothesize that, in order to survive the spatial bottleneck, phage should have either reached high frequency or should have spread across the plate to increase the probability of being transferred. As a result, a mutation that simultaneously confers both traits, i.e. an increase in the ability to spread across a larger spatial region and an increase in the number of progeny per unit area, is likely to be strongly selected for.
To determine whether a reduction in adsorption alone can improve fitness, we ran simulations using an individual-based spatial model and showed that relatively slow adsorption can maximize plaque size, plaque density and overall productivity. Our simulation results showed that the deleterious effects of rapid infection are most pronounced when host density is high (figure 3). In a well-mixed system, higher rates of (irreversible) adsorption mean faster infection of susceptible host cells, provided the population of hosts exceeds the phage population. In a spatially structured environment, however, local host densities come into play and, as our results suggest, trade-offs between adsorption and diffusion become important.
We can put these findings in the broader context of pathogen evolution by noting that measures of phage adsorption are similar to measures of pathogen infectivity [13]. Why might reduced infectivity be beneficial to a pathogen in a spatially structured environment? Viewing pathogens as exploiters of host patches, one can use optimal foraging theory [40,41] to examine trade-offs involved in the evolution of pathogen traits. Optimal foraging theory has been previously used to understand the evolution of virulence (see, for example, [21,42,43] and a review in [44]). By increasing virulence, pathogens reduce their patch residence time and do not maximize the fitness gain from their current patch but may stand to benefit in the long term by moving to and exploiting more productive patches. We can use similar ideas to develop a hypothesis for the fitness benefits of slow adsorption in spatially structured phage populations that takes resource (host) density into account. Like a forager moving from patch to patch, phage released from a cell during lysis diffuse across the bacterial lawn and compete with other phage to initiate new rounds of infection [44]. The density of the lawn (local host abundance) determines the relative risks, benefits and costs of staying in the current location versus diffusing to hosts that are further away. Rapid adsorption strains spend more time in their current location and face competition for nearby cells, whereas slow adsorbers return to the dispersal stage after unsuccessful adsorption events and delay competition by diffusing to cells that are further away. When hosts are abundant, rapid adsorption comes at a net cost because nearby cells are more likely to be already surrounded by phage, while cells further away are more likely to be uninfected. Hence, when hosts are abundant, it is beneficial to delay infection. Conversely, when hosts are scarce, the benefits of competing for a nearby resource outweigh the costs of travelling in search of new patches.
If reduced infectivity is viewed as an altruistic trait (as it comes at the cost of forgoing reproduction and benefits other nearby individuals), then social evolutionary theory predicts [45] that there will be an increase in patch/local population density owing to increased productivity by altruists. This is seen in the increase in plaque density and end population seen in our empirical and simulation results. Models describing interacting patches containing related individuals [46] have predicted that the increased competition between relatives in spatially structured populations will cancel the selective advantage provided by altruism. The fact that reduced infectivity leads to an increase in dispersal may help in alleviating the competitive effects of altruism, as noted in [47].
The mutations we isolated had no significant effect on lysis time or burst size. This was expected, because lysis in ID11 and other φX- or G4-like phages is mediated by gene E and is tied to host cell division [48,49]. However, the fact that our pooled population (Pop, figure 1b) showed a slightly delayed start of lysis suggests that there may be other mutants at lower frequency that have longer latent periods. There have been many studies on the optimization of lysis time, but these have primarily involved phage that use the more well-understood holin–endolysin system of lysis characteristic of tailed phages [50,51]. Mutations in gene E have been found to occur less frequently than mutations in F [24] (suggesting that the lysis mechanism is highly conserved) but regulatory substitutions that lead to changes in lysis time (possibly by affecting cell division) have been seen in related phages [52].
The effect of the second mutation in F (F184) is unclear. Iso2, which contains this substitution in addition to F378, had similar adsorption and lysis curves and produced plaques that were slightly smaller than those of Iso1. It arose much later in the evolution experiment and very likely on a genome already bearing the earlier substitution F378. All isolates containing the mutant at position F184 also contained the one at F378 (D. Ally, V. R. Wiss, G. E. Deckert, D. Green, P. Roychoudhury, H. A. Wichman, C. J. Brown & S. M. Krone 2012, unpublished data).
A potentially important difference between the model simulations and the experiments is the absence of co-infection in the former and its likely presence in the latter [53]. In the simulations, we assumed that all surplus (co-infecting) phage in a cell are effectively lost, and that this provides a benefit to phage that diffuse further towards ‘available’ hosts. The fact that we see the same trend of fitness being optimized at low infectivity suggests that infectivity is a phenotype that could experience strong selective forces in a surface-associated population of pathogens; other aspects of the dynamics, for example co-infection, might play a lesser role. This is a topic that warrants further study.
In summary, we have provided empirical evidence for the evolution of reduced infectivity in a population of phage that have been evolved to grow in a spatially structured environment. We showed that a phage can increase its fitness in a structured environment by reducing adsorption rate, with no changes in lysis time or burst size, and that host density plays a role in determining the optimal infectivity.
Acknowledgements
We thank Holly Wichman, Celeste Brown, Ben Kerr, Rustom Antia, Dan Weinreich and the Phage Group at the University of Idaho for ideas and helpful discussion. We also thank two anonymous reviewers whose comments greatly helped in improving the manuscript.
Funding statement
Financial support for this work was provided by NIH/NCRR grant no. P20RR16448. The simulations were performed using the IBEST Computational Resource Core (NIH/NCRR P20RR16448 and P20RR016454). P.R. received a BCB Fellowship from the Institute of Bioinformatics and Evolutionary Studies at the University of Idaho.
References
- 1.Durrett R, Levin S. 1994. The importance of being discrete (and spatial). Theor. Popul. Biol. 46, 363–394 (doi:10.1006/tpbi.1994.1032) [Google Scholar]
- 2.Rohani P, Lewis TJ, Grunbaum D, Ruxton GD. 1997. Spatial self-organisation in ecology: pretty patterns or robust reality? Trends Ecol. Evol. 12, 70–74 (doi:10.1016/S0169-5347(96)20103-X) [DOI] [PubMed] [Google Scholar]
- 3.Perfeito L, Pereira MI, Campos PR, Gordo I. 2008. The effect of spatial structure on adaptation in Escherichia coli. Biol. Lett. 4, 57–59 (doi:10.1098/rsbl.2007.0481) [DOI] [PMC free article] [PubMed] [Google Scholar]
- 4.Kerr B, Riley M, Feldman M, Bohannan B. 2002. Local dispersal promotes biodiversity in a real-life game of rock–paper–scissors. Nature 418, 171–174 (doi:10.1038/nature00823) [DOI] [PubMed] [Google Scholar]
- 5.Habets MG, Czaran T, Hoekstra RF, de Visser JA. 2007. Spatial structure inhibits the rate of invasion of beneficial mutations in asexual populations. Proc. R. Soc. B 274, 2139–2143 (doi:10.1098/rspb.2007.0529) [DOI] [PMC free article] [PubMed] [Google Scholar]
- 6.May RM, Anderson RM. 1983. Epidemiology and genetics in the coevolution of parasites and hosts. Proc. R. Soc. Lond. B 219, 281–313 (doi:10.1098/rspb.1983.0075) [DOI] [PubMed] [Google Scholar]
- 7.Boots M, Sasaki A. 1999. ‘Small worlds’ and the evolution of virulence: infection occurs locally and at a distance. Proc. R. Soc. Lond. B 266, 1933–1938 (doi:10.1098/rspb.1999.0869) [DOI] [PMC free article] [PubMed] [Google Scholar]
- 8.Keeling MJ. 1999. The effects of local spatial structure on epidemiological invasions. Proc. R. Soc. Lond. B 266, 859–867 (doi:10.1098/rspb.1999.0716) [DOI] [PMC free article] [PubMed] [Google Scholar]
- 9.Haraguchi Y, Sasaki A. 2000. The evolution of parasite virulence and transmission rate in a spatially structured population. J. Theor. Biol. 203, 85–96 (doi:10.1006/jtbi.1999.1065) [DOI] [PubMed] [Google Scholar]
- 10.Rand DA, Keeling M, Wilson HB. 1995. Invasion, stability and evolution to criticality in spatially extended, artificial host–pathogen ecologies. Proc. R. Soc. Lond. B 259, 55–63 (doi:10.1098/rspb.1995.0009) [Google Scholar]
- 11.Wei W, Krone SM. 2005. Spatial invasion by a mutant pathogen. J. Theor. Biol. 236, 335–348 (doi:10.1016/j.jtbi.2005.03.016) [DOI] [PMC free article] [PubMed] [Google Scholar]
- 12.Boots M, Mealor M. 2007. Local interactions select for lower pathogen infectivity. Science 315, 1284–1286 (doi:10.1126/science.1137126) [DOI] [PubMed] [Google Scholar]
- 13.Eshelman CM, Vouk R, Stewart JL, Halsne E, Lindsey HA, Schneider S, Gualu M, Dean AM, Kerr B. 2010. Unrestricted migration favours virulent pathogens in experimental metapopulations: evolutionary genetics of a rapacious life history. Phil. Trans. R. Soc. B 365, 2503–2513 (doi:10.1098/rstb.2010.0066) [DOI] [PMC free article] [PubMed] [Google Scholar]
- 14.Bull JJ. 2006. Optimality models of phage life history and parallels in disease evolution. J. Theor. Biol. 241, 928–938 (doi:10.1016/j.jtbi.2006.01.027) [DOI] [PubMed] [Google Scholar]
- 15.Adams MH. 1959. Bacteriophages. New York, NY: Inter-Science Publishers [Google Scholar]
- 16.Bull JJ, Heineman RH, Wilke CO. 2011. The phenotype-fitness map in experimental evolution of phages. PLoS ONE 6, e27796 (doi:10.1371/journal.pone.0027796) [DOI] [PMC free article] [PubMed] [Google Scholar]
- 17.Abedon ST, Culler RR. 2007. Bacteriophage evolution given spatial constraint. J. Theor. Biol. 248, 111–119 (doi:10.1016/j.jtbi.2007.02.014) [DOI] [PubMed] [Google Scholar]
- 18.Yin J, McCaskill J. 1992. Replication of viruses in a growing plaque: a reaction–diffusion model. Biophys. J. 61, 1540–1549 (doi:10.1016/S0006-3495(92)81958-6) [DOI] [PMC free article] [PubMed] [Google Scholar]
- 19.Burch CL, Chao L. 2004. Epistasis and its relationship to canalization in the RNA virus φ6. Genetics 167, 559–567 (doi:10.1534/genetics.103.021196) [DOI] [PMC free article] [PubMed] [Google Scholar]
- 20.Poon A, Chao L. 2005. The rate of compensatory mutation in the DNA bacteriophage φX174. Genetics 170, 989–999 (doi:10.1534/genetics.104.039438) [DOI] [PMC free article] [PubMed] [Google Scholar]
- 21.Wang I, Dykhuizen D, Slobodkin L. 1996. The evolution of phage lysis timing. Evol. Ecol. 10, 545–558 (doi:10.1007/BF01237884) [Google Scholar]
- 22.Abedon ST, Culler RR. 2007. Optimizing bacteriophage plaque fecundity. J. Theor. Biol. 249, 582–592 (doi:10.1016/j.jtbi.2007.08.006) [DOI] [PubMed] [Google Scholar]
- 23.Bull JJ, Pfennig DW, Wang IN. 2004. Genetic details, optimization and phage life histories. Trends Ecol. Evol. 19, 76–82 (doi:10.1016/j.tree.2003.10.008) [DOI] [PubMed] [Google Scholar]
- 24.Wichman HA, Brown CJ. 2010. Experimental evolution of viruses: Microviridae as a model system. Phil. Trans. R. Soc. B 365, 2495–2501 (doi:10.1098/rstb.2010.0053) [DOI] [PMC free article] [PubMed] [Google Scholar]
- 25.Rokyta DR, Burch CL, Caudle SB, Wichman HA. 2006. Horizontal gene transfer and the evolution of microvirid coliphage genomes. J. Bacteriol. 188, 1134–1142 (doi:10.1128/JB.188.3.1134-1142.2006) [DOI] [PMC free article] [PubMed] [Google Scholar]
- 26.Knies JL, Kingsolver JG, Burch CL. 2009. Hotter is better and broader: thermal sensitivity of fitness in a population of bacteriophages. Am. Nat. 173, 419–430 (doi:10.1086/597224) [DOI] [PubMed] [Google Scholar]
- 27.Newbold JE, Sinsheimer RL. 1970. The process of infection with bacteriophage φX174. XXXII. Early steps in the infection process: attachment, eclipse and DNA penetration. J. Mol. Biol. 49, 49–66 (doi:10.1016/0022-2836(70)90375-X) [DOI] [PubMed] [Google Scholar]
- 28.Schneider CA, Rasband WS, Eliceiri KW. 2012. NIH Image to ImageJ: 25 years of image analysis. Nat. Methods 9, 671–675 (doi:10.1038/nmeth.2089) [DOI] [PMC free article] [PubMed] [Google Scholar]
- 29.Andrey P, Boudier T. 2006. Adaptive active contours (snakes) for the segmentation of complex structures in biological images. In ImageJ user and developer conference, Luxembourg. See http://imagejdocu.tudor.lu/doku.php?id=plugin:segmentation:active_contour:start
- 30.Gallet R, Kannoly S, Wang I-N. 2011. Effects of bacteriophage traits on plaque formation. BMC Microbiol. 11, 181 (doi:10.1186/1471-2180-11-181) [DOI] [PMC free article] [PubMed] [Google Scholar]
- 31.Krone S. 2004. Spatial models: stochastic and deterministic. Math. Comput. Model 40, 393–409 (doi:10.1016/j.mcm.2003.09.037) [Google Scholar]
- 32.Monod J. 1949. The growth of bacterial cultures. Annu. Rev. Microbiol. 3, 371–394 (doi:10.1146/annurev.mi.03.100149.002103) [Google Scholar]
- 33.R Development Core Team 2013. R: a language and environment for statistical computing. Vienna, Austria: R Foundation for Statistical Computing [Google Scholar]
- 34.Brown C, Stancik A, Roychoudhury P, Krone S. 2013. Adaptive regulatory substitutions affect multiple stages in the life cycle of the bacteriophage φX174. BMC Evol. Biol. 13, 66 (doi:10.1186/1471-2148-13-66) [DOI] [PMC free article] [PubMed] [Google Scholar]
- 35.Crill W, Wichman H, Bull J. 2000. Evolutionary reversals during viral adaptation to alternating hosts. Genetics 154, 27–37 [DOI] [PMC free article] [PubMed] [Google Scholar]
- 36.Wichman H, Badgett M, Scott L, Boulianne C, Bull J. 1999. Different trajectories of parallel evolution during viral adaptation. Science 285, 422–424 (doi:10.1126/science.285.5426.422) [DOI] [PubMed] [Google Scholar]
- 37.Bull JJ, Badgett MR, Wichman HA, Huelsenbeck JP, Hillis DM, Gulati A, Ho C, Molineux IJ. 1997. Exceptional convergent evolution in a virus. Genetics 147, 1497–1507 [DOI] [PMC free article] [PubMed] [Google Scholar]
- 38.Lee K, Miller C, Nagel A, Wichman H, Joyce P, Ytreberg F. 2011. First-step mutations for adaptation at elevated temperature increase capsid stability in a virus. PLoS ONE 6, e25640 (doi:10.1371/journal.pone.0025640) [DOI] [PMC free article] [PubMed] [Google Scholar]
- 39.Pepin KM, Domsic J, McKenna R. 2008. Genomic evolution in a virus under specific selection for host recognition. Infect. Genet. Evol. 8, 825–834 (doi:10.1016/j.meegid.2008.08.008) [DOI] [PubMed] [Google Scholar]
- 40.MacArthur RH, Pianka ER. 1966. On optimal use of a patchy environment. Am. Nat. 100, 603–609 (doi:10.1086/282454) [Google Scholar]
- 41.Charnov EL. 1976. Optimal foraging, the marginal value theorem. Theor. Popul. Biol. 9, 129–136 (doi:10.1016/0040-5809(76)90040-X) [DOI] [PubMed] [Google Scholar]
- 42.Heineman RH, Springman R, Bull JJ. 2008. Optimal foraging by bacteriophages through host avoidance. Am. Nat. 171, E149–E157 (doi:10.1086/528962) [DOI] [PubMed] [Google Scholar]
- 43.Guyader S, Burch CL. 2008. Optimal foraging predicts the ecology but not the evolution of host specialization in bacteriophages. PLoS ONE 3, e1946 (doi:10.1371/journal.pone.0001946) [DOI] [PMC free article] [PubMed] [Google Scholar]
- 44.Nahum J, Kerr B. 2008. Optimal foraging: a bird in the hand released. Curr. Biol. 18, R385–R386 (doi:10.1016/j.cub.2008.02.072) [DOI] [PubMed] [Google Scholar]
- 45.West SA, Pen I, Griffin AS. 2002. Cooperation and competition between relatives. Science 296, 72–75 (doi:10.1126/science.1065507) [DOI] [PubMed] [Google Scholar]
- 46.Taylor PD. 1992. Inclusive fitness in a homogeneous environment. Proc. R. Soc. Lond. B 249, 299–302 (doi:10.1098/rspb.1992.0118) [Google Scholar]
- 47.Alizon S, Taylor P. 2008. Empty sites can promote altruistic behavior. Evolution 62, 1335–1344 (doi:10.1111/j.1558-5646.2008.00369.x) [DOI] [PubMed] [Google Scholar]
- 48.Bernhardt T, Roof W, Young R. 2000. Genetic evidence that the bacteriophage φX174 lysis protein inhibits cell wall synthesis. Proc. Natl Acad. Sci. USA 97, 4297–4302 (doi:10.1073/pnas.97.8.4297) [DOI] [PMC free article] [PubMed] [Google Scholar]
- 49.Young R, Wang I-N, Roof W. 2000. Phages will out: strategies of host cell lysis. Trends Microbiol. 8, 120–128 (doi:10.1016/S0966-842X(00)01705-4) [DOI] [PubMed] [Google Scholar]
- 50.Heineman RH, Bull JJ. 2007. Testing optimality with experimental evolution: lysis time in a bacteriophage. Evolution 61, 1695–1709 (doi:10.1111/j.1558-5646.2007.00132.x) [DOI] [PMC free article] [PubMed] [Google Scholar]
- 51.Wang IN. 2006. Lysis timing and bacteriophage fitness. Genetics 172, 17–26 (doi:10.1534/genetics.105.045922) [DOI] [PMC free article] [PubMed] [Google Scholar]
- 52.Brown CJ, Zhao L, Evans KJ, Ally D, Stancik AD. 2010. Positive selection at high temperature reduces gene transcription in the bacteriophage φX174. BMC Evol. Biol. 10, 378 (doi:10.1186/1471-2148-10-378) [DOI] [PMC free article] [PubMed] [Google Scholar]
- 53.Turner P, Duffy S. 2008. Evolutionary ecology of multiple phage adsorption and infection. In Bacteriophage ecology: population growth, evolution, and impact of bacterial viruses (ed. Abedon S.), pp. 195–216 Cambridge, UK: Cambridge University Press [Google Scholar]