

Abstract
The stability and dynamics of synapses rely on tight regulation of the synaptic proteome. Shank proteins, encoded by the three genes Shank1, Shank2 and Shank3 are scaffold molecules in the postsynaptic density of excitatory neurons that contribute to activity-dependent neuronal signalling. Mutations in the Shank genes are associated with neurological diseases. Using state-of-the-art technologies, we investigated the levels of expression of the Shank family messenger RNAs (mRNAs) within the synaptic neuropil of the rat hippocampus. We detected all three Shank transcripts in the neuropil of CA1 pyramidal neurons. We found Shank1 to be the most abundantly expressed among the three Shank mRNA homologues. We also examined the turnover of Shank mRNAs and predict the half-lives of Shank1, Shank2 and Shank3 mRNAs to be 18–28 h. Using 3′-end sequencing, we identified novel 3′ ends for the Shank1 and Shank2 3′ untranslated regions (3′ UTRs) that may contribute to the diversity of alternative polyadenylation (APA) for the Shank transcripts. Our findings consolidate the view that the Shank molecules play a central role at the postsynaptic density. This study may shed light on synaptopathologies associated with disruption of local protein synthesis, perhaps linked to mutations in mRNA 3′ UTRs or inappropriate 3′ end processing.
Keywords: Shank mRNA, hippocampus, 3′ untranslated region, synaptic neuropil, alternative polyadenylation
1. Introduction
In the central nervous system, neuronal activity induces local changes modifying the composition, form and strength of synapses. These processes are thought to be essential for learning and memory. It is now well established that some forms of neuronal plasticity are based on dynamic modifications of the synaptic proteome through local delivery of messenger RNA (mRNA) to synapses and local protein synthesis [1–3]. Recently, more than 2500 mRNA species were shown to populate the dendritic compartment of hippocampal neurons [4]. Among these, previously identified mRNAs coding for the Shank family of scaffolding proteins (alternative names: ProSAP, CortBP, Spank, Synamon and SSTRIP) were detected. Shank proteins are a major component of the postsynaptic density of excitatory neurons [5,6]. Via multiple protein–protein binding domains, the Shank proteins interact with other scaffold molecules and cross-link glutamatergic receptor complexes and the actin-based cytoskeleton [6–8]. Members of the Shank family are involved in the recruitment and clustering of neurotransmitter receptors at postsynaptic densities and further regulate synaptic activity by promoting the maturation and enlargement of dendritic spines [9].
Recent studies of several neurodevelopmental disorders point to a potential disruption of molecular pathways controlling synaptic signalling [10,11]. The central role of Shank scaffolds at postsynaptic densities targets them as candidate genes to study synaptic plasticity [12]. Studies of Shank mouse knockout models have revealed altered synaptic signalling, such as reduced AMPA-mediated basal synaptic transmission in the hippocampus [13], altered NMDA-receptor signalling [14,15] and reduced hippocampal long-term potentiation (LTP) [16]. Deficiencies in the Shank genes have been implicated in diseases [17]. Indeed, mutations in all three Shank genes have been associated with neurodevelopmental and neuropsychiatric disorders, such as autism spectrum disorders (ASD) and schizophrenia [18–21]. Shank knockout mice also exhibit impairments in social behaviour and communication [14–16,22,23].
Previous studies have revealed that the mRNAs coding for the Shank proteins are widely expressed near synapses in the mammalian brain. Using in situ hybridization with radioactive or digoxigenin-labelled probes, Shank1 as well as Shank3 mRNA (but not Shank2) were detected in the molecular layers of rat hippocampus [24,25]. Dendritic localization of mRNAs is dependent on trans-acting factors that usually bind distinct sites within the UTRs of transcripts [26]. While the 5′ UTR is generally involved in modulating translation initiation [27], the 3′ UTR is often associated with the regulation of mRNA trafficking, stability and translational regulation [28]. 3′ UTRs sometimes contain ‘zip-codes’ that are targeted by mRNA-binding proteins or microRNAs (miRNAs) to fine-tune gene expression. In addition, alternative polyadenylation (APA) can dramatically change the landscape of regulatory motifs within an mRNA 3′ UTR. By creating 3′ UTRs of different length, APA can influence mRNA stability, translocation and translation efficiency [29].
Despite the prominent role of Shank scaffolds at postsynaptic densities and their contribution to neuronal activity, little is known about the biology and diversity of Shank mRNAs. Thus, we examined the localization, expression levels and the stability of the three Shank mRNA isoforms in CA1 pyramidal neurons using high-resolution imaging and quantitative real-time PCR. Further, we performed 3′-end sequencing to investigate APA and expression levels of Shank mRNA 3′ UTRs in two distinct neuronal compartments.
2. Material and methods
(a). High-resolution in situ hybridization and immunostaining
Dissociated hippocampal neurons were prepared and maintained as previously described [30]. We performed in situ hybridization using the QuantiGene (QG) ViewRNA kit from Panomics as previously described [4,31]. In brief, cultured neurons (DIV 19) were fixed for 30 min at room temperature using a 4% paraformaldehyde solution (4% paraformaldehyde, 5.4% glucose, 0.01 M sodium metaperiodate in lysine-phosphate buffer). After completion of in situ hybridization protocol, cells were incubated in blocking buffer (4% goat serum in 1× PBS) for 1 h. Thereafter, neurons were immunostained using standard methods [30]. Dendrites were stained using an anti-MAP2 antibody (Millipore M9942, 1 : 1000) and nuclei were stained for 2 min with DAPI. Subsequently, z-stack images were acquired using a Zeiss LSM780 confocal microscope with 1024 × 1024 pixel resolution. Dendrites were straightened using ImageJ.
For in situ hybridization in sections, 500 µm hippocampal slices from four week old rat were processed as previously described [4]. Slices were cryosectioned at 7 µm thickness. In situ hybridization was performed as described above for hippocampal neurons with an additional washing step after adding in situ probes. Slices were incubated with the primary antibody anti-MAP2 (Millipore M9942, 1 : 1000) for 3 h at room temperature. The CA1 region was imaged by obtaining a z-stack spanning the entire thickness of the slice. For visualization purposes, in all presented images, the channels representing mRNA signal were converted to binary images and puncta were dilated once. The genomic locations of in situ probes are listed in the electronic supplementary material, table S1.
Quantification of mRNA signal in hippocampal slices was done using MetaMorph software. The channels corresponding to mRNA and MAP2 signal were separated and processed with a low-pass filter. The double average intensity of the MAP2 channel was thresholded (exclusively) to obtain a mask around the MAP2 signal. The image was converted to a binary image and the signal was eroded once by two pixels. This mask was subtracted from the RNA channel to obtain only those mRNA puncta localized within dendrites. The integrated intensity of the RNA channel was calculated over all stacks and divided by the sum of the MAP2 integrated intensity (using an inclusive threshold).
(b). Tissue microdissection and RNA isolation
Hippocampal slices (500 μm) from male adult rat (four weeks) were prepared as previously described [30]. From 25 slices, CA1 cell bodies and the neuropil were microdissected manually as described by Cajigas et al. [4]. Total RNA and protein were extracted using Trizol (Invitrogen) following the manufacturer's recommendations.
(c). Immunoblotting
Protein pellets from microdissected somata and neuropil samples were lysed in LDS sample buffer and NuPAGE detergent solution (Invitrogen). Twenty microlitres of each sample were run on an SDS PAGE (4–12% Bis-Tris gel) for 80 min at 130 V. Samples were blotted on a PVDF membrane. The membrane was blocked for 1 h at room temperature using an Odyssey blocking buffer. Subsequently, the membrane was incubated with primary antibodies against Neuronal Nuclei (NeuN) (Millipore MAB377, 1 : 500) and β-actin (Sigma A5316, 1 : 5000) overnight at 4°C in Odyssey blocking buffer/PBS–Tween 0.1% (1 : 1). After washing, secondary antibodies were incubated for 1 h at room temperature. The image was acquired by an Odyssey Infrared imager (Licor).
(d). Quantitative real-time PCR
RNA was treated with DNaseI and cleaned using RNeasy MinElute clean-up kit (Qiagen). Five hundred nanograms of RNA was reverse-transcribed using the QuantiTect Reverse Transcription kit (Qiagen). qRT-PCR was performed using SYBR Green (Applied Biosystems). Reaction set-up and cycling parameters were those recommended by the QuantiTect primer assays. The following QuantiTect primer assays were used: Shank1 (QT00183351), Shank2 (QT02350509), Shank3 (QT01568812), Arc (QT00373086) and Gapdh (QT00199633). The qRT-PCR was run on a StepOnePlus real-time PCR system (Applied Biosystems). mRNA half-lives were calculated from an exponential curve that was fitted to the time points obtained.
(e). Treatment of cells with transcription inhibitors
Hippocampal neurons were plated at density of 400 000 cells in a 60 mm Petri dish and treated with a cocktail of actinomycin D (8 µM), 5,6-dichloro-1-β-d-ribofuranosylbenzimidazole (DRB; 100 µM) and Triptolede (1 µM) in DMSO for 0, 1, 2, 4 and 20 h. Cells were harvested at each time point and RNA was isolated using Trizol (Invitrogen) following the manufacturer's recommendations.
(f). Digital analysis of gene expression using nCounter nanostring
Each mRNA was detected by two probes of 50 nucleotide length: a target-specific capture probe and a reporter probe linked to a fluorescent barcode [32]. Probe sequences are listed in the electronic supplementary material, table S2. All probes were designed against the coding region. One hundred nanograms of total RNA (DnaseI treated and cleaned using RNeasy MinElute kit (Qiagen)) was used for probe hybridization. Data were processed by the nCounter Digital Analyzer as described in [4].
(g). 3′-end sequencing
A 3′ fragment cDNA library was prepared by GATC Biotech AG and deep RNA-sequencing was performed using an Illumina HiSeq 2000. Total RNA was fragmented by sonication. Poly dT primers were used to extract polyA-containing fragments. After gel separation, fragments with of size 300–500 nt were used for ligation of sequencing adapters. Single reads were of length 101 nt and were aligned to the rat genome (assembly March 2012/rn5) using Bowtie [33]. Consecutive A or T mismatches on the genome during alignment were interpreted as a sign for polyA-containing reads and further used for identification of cleavage sites. Identification of polyA signal hexamers (PSHs) and prediction of 3′ UTR isoforms was done using custom-written Perl scripts. For visualization, the UCSC Genome Browser was used [34].
3. Results
(a). Shank mRNA isoforms are differentially expressed in the synaptic neuropil
To visualize dendritic localization of Shank mRNA isoforms in pyramidal neurons, we applied high-resolution fluorescence in situ hybridization in combination with confocal microscopy. We used probe sets that were directed against the coding sequences of Shank1, Shank2 and Shank3 mRNAs (see electronic supplementary material, figure S1b). We were able to detect all three Shank mRNAs in the neuropil layer of the CA1 region of hippocampal slices. Control experiments, using a sense probe, showed a substantially reduced signal (figure 1). Quantification of in situ hybridization signal indicated highest dendritic expression of Shank1 mRNA followed by Shank3 mRNA and a weaker, though clearly detectable level of Shank2 mRNA (see electronic supplementary material, figure S1a).
Figure 1.
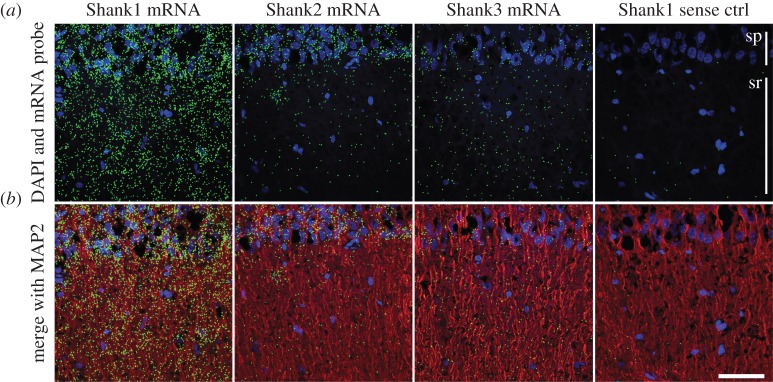
Shank mRNA isoforms are expressed in the synaptic neuropil. In situ hybridization was performed on rat hippocampal slices. The nuclei were stained with DAPI (blue) and the dendrites were immunostained with an anti-MAP2 antibody (red). Shown is the CA1 region. (a) Overlay of the DAPI and mRNA channels. (b) Merge of all three channels. In situ hybridization was done using antisense probes directed against Shank1, Shank2 and Shank3 and a sense control probe against Shank1 (from left to right). For visualization purposes, the mRNA signal was dilated once. Slice thickness, 7 µm. Scale bar, 50 µm. sp, Stratum pyramidale; sr, stratum radiatum.
(b). Quantification of Shank mRNA isoform expression within different cellular compartments
To test the abundance of the different Shank mRNA isoforms in distinct cellular compartments, we microdissected hippocampal slices to separate cell bodies of principal neurons from the synaptic neuropil which is enriched with dendrites and axons ([35]; figure 2a). To confirm the quality of our microdissections, we quantified the amount of a neuron-specific transcription factor in microdissected slices. While the somatic layer contained the transcription factor ‘NeuN’, the neuropil was de-enriched for NeuN (figure 2b). We then used qRT-PCR to analyse the relative expression levels of the Shank mRNA isoforms. In both the somatic and neuropil compartments, Shank1 mRNA showed the highest relative expression followed by Shank3 and an even weaker expression level of Shank2 mRNA. All transcripts showed higher expression levels in the neuropil compared with somata (figure 2c). To further validate this result, we performed digital quantification of Shank mRNAs using the nCounter Nanostring technology that allows highly sensitive and precise profiling of individual mRNA molecules without amplification [32]. Consistent with our qRT-PCR data, we observed the most counts for Shank1 mRNA, followed by Shank3 (approx. threefold less) and the fewest counts for Shank2 mRNA. Again, the three Shank mRNA isoforms showed higher expression in the dendritic compartment compared with the somatic layer (figure 2d).
Figure 2.

Differential expression within cellular compartments and stability of Shank mRNAs. (a) Photograph of a representative hippocampal slice (thickness 500 µm) used for microdissection to obtain RNA and protein from somata (red dashed box) and the neuropil (blue dashed box). Scale bar, 1 mm. (b) Western blot on somata and neuropil samples using an antibody against the neuron-specific transcription factor NeuN. β-Actin was used as a loading control. (c) Bar graph showing the relative expression values for Shank transcripts determined by qRT-PCR. Values are normalized to Gapdh. Values are the mean of three technical replicates. (d) Bar graph showing the number of Shank mRNA counts in 100 ng of RNA using nCounter Nanostring technology. Values are the mean of two biological replicates. (e) Bar graph of mRNA stability. Expression values for the Shank mRNAs and Arc mRNA are calculated relative to Gapdh determined by qRT-PCR (after treatment with transcription inhibitors). The control sample (time point 0) was normalized to unity and treated samples are shown as proportion of control. Values are the mean of three technical replicates. (f) Table showing estimated half-lives of mRNAs. Error bars in all panels (c,d,e) indicate the standard error of the mean.
(c). Stability of Shank mRNA isoforms in hippocampal neurons
To assess whether the differential expression levels of the three Shank transcripts observed above may be the result of major differences in mRNA stability/turnover, we examined the mRNA half-lives of the Shank mRNA isoforms. Dissociated hippocampal neurons were treated with a transcription inhibitor cocktail (see §2e) and RNA was harvested at different time points (0–20 h post treatment). As a read-out, we used qRT-PCR, and then calculated the mRNA levels at different times following the onset of transcription inhibition. We compared the mRNA levels of the three Shank family members to each other and to the Arc mRNA, an established short-lived neuronal mRNA [36]. While Arc mRNA levels declined quickly (t1/2 = 0.7 h), as expected, we did not observe major differences in mRNA stability between the Shank family members. We estimated their half-lives to be in the range 18–28 h.
(d). Novel Shank family 3′ UTR isoforms revealed by 3′-end sequencing
We next performed 3′-end sequencing to investigate the potential diversity and expression of Shank mRNA 3′ UTRs within the somata and neuropil compartments. Fragments with lengths of 300–500 bases near a polyA tail were deep sequenced. Peaks of base coverage were used to represent the position and expression of 3′ ends in 3′ UTRs and to predict Shank family 3′ UTR isoforms (figure 3). Based on the total read distribution, Shank1 and Shank3 3′ UTRs showed similar high expression levels while Shank2 expression was nearly 10-fold decreased. We identified two types of canonical polyadenylation hexamer signals (PHSs) within the 3′ UTRs of Shank mRNAs. For Shank1, we found a previously non-annotated 3′ end that terminates 176 base pairs (bp) downstream of the non-RefSeq-annotated mRNA AY461452 (not displayed) [24]. Further, we identified two previously non-annotated 3′ ends for Shank2 containing the canonical PHS AAUAAA and its most common variant AUUAAA. One novel isoform is 360 bp shorter than the RefSeq-annotated isoforms NM_133441/NM_133440, whereas the second new isoform is 1553 bp longer than the longest annotated Shank2 3′ UTR. In addition, we confirmed the Shank2 RefSeq-annotated 3′ UTR isoforms (NM_133441/NM_133440) as well as the annotated Shank3 isoform (NM_021670). A summary of predicted 3′ ends is displayed in the electronic supplementary material, table S3. To further compare Shank mRNA 3′ UTR expression between the subcellular compartments, we applied a normalization procedure to our dataset as described in [37]. The normalized peak distribution displayed a nearly twofold higher expression of all detected Shank 3′ UTRs in the dendritic compartment compared with that in somata, pointing to an enrichment of Shank family molecules in the synaptic neuropil (figure 3 and electronic supplementary material, tables S4–S6).
Figure 3.

3′-End sequencing of Shank 3′ UTR isoforms. Genome browser view of 3′-end sequencing coverage mapped to Shank mRNAs. Sequencing conducted on somata (dark grey) and neuropil (light grey) layers of hippocampal CA1 region is shown. Horizontal axes represent the genomic coordinates and the vertical axes show the number of reads. Peaks of base coverage represent the position and expression of 3′ ends in 3′ UTR isoforms and determine the prediction of isoforms. PSHs were identified and labelled. For comparison, RefSeq annotation is displayed. Total sequencing reads are shown in the top tracks (black). Middle and bottom tracks display normalized sequencing coverage within the two compartments. Note the differences in the vertical axis scale showing a 10-fold lower Shank2 3′ UTR expression.
(e). Dendritic localization of the long Shank1 3′ UTR
To validate the expression and dendritic localization of the long Shank1 3′ UTR detected by 3′-end sequencing, we used a custom-made in situ hybridization probe designed to target the 3′ end of Shank1 3′ UTR. We performed fluorescence high-resolution in situ hybridization in cultured hippocampal neurons with in situ probes against Shank1 coding sequence or the 3′ UTR (figure 4a). We observed a fraction of co-localized puncta in the somata as well as the dendrites (figure 4b). However, especially in dendrites, we also detected CDS- and UTR-unique particles.
Figure 4.

Co-localization of Shank1 CDS and the long 3′ UTR in cultured hippocampal neurons. (a) Diagram showing a simplified structure of Shank1 mRNA and the position of in situ hybridization probes against Shank1 CDS (green) and the 3′ UTR (magenta). (b) Upper panels, in situ hybridization was performed on DIV19 hippocampal neurons using antisense probes targeting the Shank1 CDS (green) and the 3′ end of the Shank1 3′ UTR (magenta). The dendrites were immunostained using an anti-MAP2 antibody (red). Channels were separated and images were merged in the upper right panel. White puncta indicate co-localization. Scale bar, 50 µm. Bottom left panels, a magnification of the somatic RNA signal (white box). Bottom right panels, a representative dendrite (white box) was straightened and presented at higher magnification. White arrowheads point to co-localization events. Scale bars, 10 µm. For visualization purposes, the mRNA signal was dilated once.
4. Discussion
The establishment and maintenance of synaptic networks is essential for normal brain function. Shank family members modulate activity of excitatory synapses by organizing postsynaptic signalling complexes [24,38]. Here, we used state-of-the-art technologies to investigate the localization, expression and APA of Shank mRNA isoforms. We focused on the CA1 region as synapses in this area are known to express several forms of synaptic plasticity, including LTP [39–42]. While the somatic layer of CA1 (stratum pyramidale) consist mainly of principal cell bodies, the neuropil layer (stratum radiatum) contains dendrites and axons of principal cells as well as glia and interneurons [4,35]. Taking into consideration the cell heterogeneity of the neuropil, we used both tissue microdissection and high-resolution imaging to show distinct dendritic localization of Shank family mRNAs.
The dendritic localization of Shank mRNAs was previously studied using detection tools, for example radio- and digoxigenin-labelled probes [24,25,43]. For instance, Boeckers et al. [24,44] have described the age-dependent differential distribution of Shank mRNAs at various stages of developing rat brain with the presence of all three Shank mRNAs in the hippocampus detected postnatally. In this study, we used high-resolution fluorescence in situ hybridization to image and quantify the expression of the three Shank family mRNAs in the neuropil of rat hippocampal slices at the age of four weeks when mature synapses have formed. We found Shank1 mRNA to be the most abundant transcript followed by expression of Shank3 mRNA, confirming previous studies [6,24]. However, in contrast to these studies that did not detect Shank2 mRNA in the molecular layers of the hippocampus, we found Shank2 mRNA was indeed present. To validate these findings and to assess the expression of Shank transcripts within different cellular compartments, we applied qRT-PCR and nCounterNanostring on the same amount of total RNA from somata and neuropil. We confirmed our previous observation showing the following mRNA expression trend: Shank1 > Shank3 > Shank2. Additionally, we found all three transcripts enriched in the neuropil compared with somata (when each compartment was normalized to total RNA content), implicating local translation as an important source of Shank protein at the synapse.
Although in situ hybridization and Nanostring are direct methods to measure gene expression, these techniques only measure Shank mRNA levels at steady state, not accounting for potential mRNA turnover through mRNA degradation. We thus examined the stability of Shank mRNAs by treating primary hippocampal neurons with a cocktail of three transcription inhibitors (actinomycin D, DRB and Triptolede). We compared the half-lives of the three Shank mRNAs to those of Arc, an immediate-early gene. While Arc mRNA showed a fast turnover rate, we estimated the half-lives of three Shank mRNAs to be 18–28 h in our experimental conditions.
The stability, translation and subcellular translocation of neuronal mRNAs can be affected by APA producing diverse mRNA isoforms [45]. When APA occurs downstream of a stop codon, it results in 3′ UTRs with different lengths [46]. Recently, extensive lengthening of 3′ UTRs has been reported in the brain of mouse and human [47]. Fast advancing technology, for instance deep sequencing, has enabled the study of APA by overcoming the limitations of microarrays or cDNA/expressed sequence tag (EST) library preparations [29]. Thus, we examined APA of Shank mRNAs in different neuronal compartments of the rat hippocampus using 3′-end sequencing. We detected previously non-annotated PAS for Shank1 and Shank2 mRNAs, including two novel tandem 3′ UTRs for Shank2. A broad collection of cDNA/EST data indicate that more than 30% of mammalian genes contain APA sites [48]. Indeed, numerous rat ESTs mapping to the genomic location of our novel Shank1 and Shank2 3′ UTRs were detected, confirming their expression (see electronic supplementary material, table S7). Our 3′-end sequencing data further support our previous finding that the three Shank mRNAs are enriched in the synaptic neuropil by showing a substantially higher number of reads mapping to the Shank 3′ ends in the neuropil compared with somata.
Shank1 mRNA is localized to distal dendrites in the hippocampus via a dendritic targeting element (DTE) within its 3′ UTR [24]. We validated the usage of the ‘long’ Shank1 3′ UTR by performing fluorescence in situ hybridization targeting Shank1 CDS and the 3′ end Shank1 3′ UTR simultaneously. We observed numerous co-localized particles, however, we also detected several CDS- and UTR-unique puncta. While detection of CDS-unique particles could indicate the usage of an alternative UTR isoform (not detected in our 3′-end sequencing) or less efficient hybridization of the UTR probe compared with the CDS probe, UTR-unique Shank particles might indicate an individual source of transcripts. Recently, Mercer et al. [49] have provided in silico and experimental evidence that numerous 3′ UTRs in human, mouse and fly are also expressed separately from their protein-coding sequence, probably generated by post-transcriptional cleavage. This suggests that there may be trans-acting genetic information embedded in the 3′ UTR of Shank1 mRNA.
Taken together, this study supports the idea that dendritically localized Shank mRNAs can serve the cell as a local pool to provide synapses with scaffold proteins upon modulation of excitatory synapse function during activity-dependent plasticity. Alternative polyadenlyation affects the properties of an mRNA 3′ UTR by causing a loss or gain of regulatory motifs and/or miRNA-binding sites [50]. The functional consequences of differential 3′ UTRs usage and regulation, however, remain poorly understood. Recent studies have highlighted mutations in 3′ UTRs as a potential cause of pathologies [51,52]. Finally, this study expands our current knowledge of Shank mRNA 3′ UTR diversity and can serve as a basis for translational and biomedical research in targeting the potential mechanisms that cause disruption of Shank genes in neurological disease.
Acknowledgements
We thank Ina Bartnik and Nicole Fuerst for the preparation of cultured hippocampal neurons, Belquis Nassim-Assir and Philipp Berg with assistance in preparing hippocampal cryosections. We thank Mona Khan and Peter Mombaerts for assistance and use of their nCounter system. We are grateful to Schuman Lab members for comments on the manuscript.
Funding statement
The project was financially supported by an ERC advanced investigator grant to E.M.S.
References
- 1.Cajigas IJ, Will T, Schuman EM. 2010. Protein homeostasis and synaptic plasticity. EMBO J. 29, 2746–2752 (doi:10.1038/emboj.2010.173) [DOI] [PMC free article] [PubMed] [Google Scholar]
- 2.Martin KC, Ephrussi A. 2009. mRNA localization: gene expression in the spatial dimension. Cell 136, 719–730 (doi:10.1016/j.cell.2009.01.044) [DOI] [PMC free article] [PubMed] [Google Scholar]
- 3.Sutton MA, Schuman EM. 2006. Dendritic protein synthesis, synaptic plasticity, and memory. Cell 127, 49–58 (doi:10.1016/j.cell.2006.09.014) [DOI] [PubMed] [Google Scholar]
- 4.Cajigas IJ, Tushev G, Will TJ, tom Dieck S, Fuerst N, Schuman EM. 2012. The local transcriptome in the synaptic neuropil revealed by deep sequencing and high-resolution imaging. Neuron 74, 453–466 (doi:10.1016/j.neuron.2012.02.036) [DOI] [PMC free article] [PubMed] [Google Scholar]
- 5.Kim E, Sheng M. 2004. PDZ domain proteins of synapses. Nat. Rev. Neurosci. 5, 771–781 (doi:10.1038/nrn1517) [DOI] [PubMed] [Google Scholar]
- 6.Lim S, Naisbitt S, Yoon J, Hwang JI, Suh PG, Sheng M, Kim E. 1999. Characterization of the Shank family of synaptic proteins. Multiple genes, alternative splicing, and differential expression in brain and development. J. Biol. Chem. 274, 29 510–29 518 (doi:10.1074/jbc.274.41.29510) [DOI] [PubMed] [Google Scholar]
- 7.Boeckers TM, Bockmann J, Kreutz MR, Gundelfinger ED. 2002. ProSAP/Shank proteins: a family of higher order organizing molecules of the postsynaptic density with an emerging role in human neurological disease. J. Neurochem. 81, 903–910 (doi:10.1046/j.1471-4159.2002.00931.x) [DOI] [PubMed] [Google Scholar]
- 8.Sheng M, Kim E. 2000. The Shank family of scaffold proteins. J. Cell Sci. 113, 1851–1856 [DOI] [PubMed] [Google Scholar]
- 9.Roussignol G, Ango F, Romorini S, Tu JC, Sala C, Worley PF, Bockaert J, Fagni L. 2005. Shank expression is sufficient to induce functional dendritic spine synapses in aspiny neurons. J. Neurosci. 25, 3560–3570 (doi:10.1523/JNEUROSCI.4354-04.2005) [DOI] [PMC free article] [PubMed] [Google Scholar]
- 10.Kelleher RJ, 3rd, Bear MF. 2008. The autistic neuron: troubled translation? Cell 135, 401–406 (doi:10.1016/j.cell.2008.10.017) [DOI] [PubMed] [Google Scholar]
- 11.Zoghbi HY. 2003. Postnatal neurodevelopmental disorders: meeting at the synapse? Science 302, 826–830 (doi:10.1126/science.1089071) [DOI] [PubMed] [Google Scholar]
- 12.Kreienkamp HJ. 2008. Scaffolding proteins at the postsynaptic density: Shank as the architectural framework. Handb. Exp. Pharmacol. 365–380 (doi:10.1007/978-3-540-72843-6_15) [DOI] [PubMed] [Google Scholar]
- 13.Bozdagi O, et al. 2010. Haploinsufficiency of the autism-associated Shank3 gene leads to deficits in synaptic function, social interaction, and social communication. Mol. Autism 1, 15 (doi:10.1186/2040-2392-1-15) [DOI] [PMC free article] [PubMed] [Google Scholar]
- 14.Schmeisser MJ, et al. 2012. Autistic-like behaviours and hyperactivity in mice lacking ProSAP1/Shank2. Nature 486, 256–260 (doi:10.1038/nature11015) [DOI] [PubMed] [Google Scholar]
- 15.Won H, et al. 2012. Autistic-like social behaviour in Shank2-mutant mice improved by restoring NMDA receptor function. Nature 486, 261–265 (doi:10.1038/nature11208) [DOI] [PubMed] [Google Scholar]
- 16.Peca J, Feliciano C, Ting JT, Wang W, Wells MF, Venkatraman TN, Lascola CD, Fu Z, Feng G. 2011. Shank3 mutant mice display autistic-like behaviours and striatal dysfunction. Nature 472, 437–442 (doi:10.1038/nature09965) [DOI] [PMC free article] [PubMed] [Google Scholar]
- 17.Grabrucker AM, Schmeisser MJ, Schoen M, Boeckers TM. 2011. Postsynaptic ProSAP/Shank scaffolds in the cross-hair of synaptopathies. Trends Cell Biol. 21, 594–603 (doi:10.1016/j.tcb.2011.07.003) [DOI] [PubMed] [Google Scholar]
- 18.Berkel S, et al. 2010. Mutations in the SHANK2 synaptic scaffolding gene in autism spectrum disorder and mental retardation. Nat. Genet. 42, 489–491 (doi:10.1038/ng.589) [DOI] [PubMed] [Google Scholar]
- 19.Durand CM, et al. 2007. Mutations in the gene encoding the synaptic scaffolding protein SHANK3 are associated with autism spectrum disorders. Nat. Genet. 39, 25–27 (doi:10.1038/ng1933) [DOI] [PMC free article] [PubMed] [Google Scholar]
- 20.Gauthier J, et al. 2010. De novo mutations in the gene encoding the synaptic scaffolding protein SHANK3 in patients ascertained for schizophrenia. Proc. Natl Acad. Sci. USA 107, 7863–7868 (doi:10.1073/pnas.0906232107) [DOI] [PMC free article] [PubMed] [Google Scholar]
- 21.Sato D, et al. 2012. SHANK1 deletions in males with autism spectrum disorder. Am. J. Hum. Genet. 90, 879–887 (doi:10.1016/j.ajhg.2012.03.017) [DOI] [PMC free article] [PubMed] [Google Scholar]
- 22.Hung AY, et al. 2008. Smaller dendritic spines, weaker synaptic transmission, but enhanced spatial learning in mice lacking Shank1. J. Neurosci. 28, 1697–1708 (doi:10.1523/JNEUROSCI.3032-07.2008) [DOI] [PMC free article] [PubMed] [Google Scholar]
- 23.Jiang YH, Ehlers MD. 2013. Modeling autism by SHANK gene mutations in mice. Neuron 78, 8–27 (doi:10.1016/j.neuron.2013.03.016) [DOI] [PMC free article] [PubMed] [Google Scholar]
- 24.Böckers TM, Segger-Junius M, Iglauer P, Bockmann J, Gundelfinger ED, Kreutz MR, Richter D, Kindler S, Kreienkamp HJ. 2004. Differential expression and dendritic transcript localization of Shank family members: identification of a dendritic targeting element in the 3′ untranslated region of Shank1 mRNA. Mol. Cell Neurosci. 26, 182–190 (doi:10.1016/j.mcn.2004.01.009) [DOI] [PubMed] [Google Scholar]
- 25.Zitzer H, Honck HH, Bachner D, Richter D, Kreienkamp HJ. 1999. Somatostatin receptor interacting protein defines a novel family of multidomain proteins present in human and rodent brain. J. Biol. Chem. 274, 32 997–33 001 (doi:10.1074/jbc.274.46.32997) [DOI] [PubMed] [Google Scholar]
- 26.Mignone F, Gissi C, Liuni S, Pesole G. 2002. Untranslated regions of mRNAs. Genome Biol. 3, REVIEWS0004. [DOI] [PMC free article] [PubMed] [Google Scholar]
- 27.Sonenberg N, Hinnebusch AG. 2009. Regulation of translation initiation in eukaryotes: mechanisms and biological targets. Cell 136, 731–745 (doi:10.1016/j.cell.2009.01.042) [DOI] [PMC free article] [PubMed] [Google Scholar]
- 28.Andreassi C, Riccio A. 2009. To localize or not to localize: mRNA fate is in 3′ UTR ends. Trends Cell Biol. 19, 465–474 (doi:10.1016/j.tcb.2009.06.001) [DOI] [PubMed] [Google Scholar]
- 29.Sun Y, Fu Y, Li Y, Xu A. 2012. Genome-wide alternative polyadenylation in animals: insights from high-throughput technologies. J. Mol. Cell Biol. 4, 352–361 (doi:10.1093/jmcb/mjs041) [DOI] [PubMed] [Google Scholar]
- 30.Aakalu G, Smith WB, Nguyen N, Jiang C, Schuman EM. 2001. Dynamic visualization of local protein synthesis in hippocampal neurons. Neuron 30, 489–502 (doi:10.1016/S0896-6273(01)00295-1) [DOI] [PubMed] [Google Scholar]
- 31.Taylor AM, Dieterich DC, Ito HT, Kim SA, Schuman EM. 2010. Microfluidic local perfusion chambers for the visualization and manipulation of synapses. Neuron 66, 57–68 (doi:10.1016/j.neuron.2010.03.022) [DOI] [PMC free article] [PubMed] [Google Scholar]
- 32.Geiss GK, et al. 2008. Direct multiplexed measurement of gene expression with color-coded probe pairs. Nat. Biotechnol. 26, 317–325 (doi:10.1038/nbt1385) [DOI] [PubMed] [Google Scholar]
- 33.Langmead B, Trapnell C, Pop M, Salzberg SL. 2009. Ultrafast and memory-efficient alignment of short DNA sequences to the human genome. Genome Biol. 10, R25 (doi:10.1186/gb-2009-10-3-r25) [DOI] [PMC free article] [PubMed] [Google Scholar]
- 34.Kent WJ, Sugnet CW, Furey TS, Roskin KM, Pringle TH, Zahler AM, Haussler D. 2002. The human genome browser at UCSC. Genome Res. 12, 996–1006 (doi:10.1101/gr.229102) [DOI] [PMC free article] [PubMed] [Google Scholar]
- 35.Mishchenko Y, Hu T, Spacek J, Mendenhall J, Harris KM, Chklovskii DB. 2010. Ultrastructural analysis of hippocampal neuropil from the connectomics perspective. Neuron 67, 1009–1020 (doi:10.1016/j.neuron.2010.08.014) [DOI] [PMC free article] [PubMed] [Google Scholar]
- 36.Rao VR, Pintchovski SA, Chin J, Peebles CL, Mitra S, Finkbeiner S. 2006. AMPA receptors regulate transcription of the plasticity-related immediate-early gene Arc. Nat. Neurosci. 9, 887–895 (doi:10.1038/nn1708) [DOI] [PubMed] [Google Scholar]
- 37.Anders S, Huber W. 2010. Differential expression analysis for sequence count data. Genome Biol. 11, R106 (doi:10.1186/gb-2010-11-10-r106) [DOI] [PMC free article] [PubMed] [Google Scholar]
- 38.Ebert DH, Greenberg ME. 2013. Activity-dependent neuronal signalling and autism spectrum disorder. Nature 493, 327–337 (doi:10.1038/nature11860) [DOI] [PMC free article] [PubMed] [Google Scholar]
- 39.Dieterich DC, Link AJ, Graumann J, Tirrell DA, Schuman EM. 2006. Selective identification of newly synthesized proteins in mammalian cells using bioorthogonal noncanonical amino acid tagging (BONCAT). Proc. Natl Acad. Sci. USA 103, 9482–9487 (doi:10.1073/pnas.0601637103) [DOI] [PMC free article] [PubMed] [Google Scholar]
- 40.Huber KM, Kayser MS, Bear MF. 2000. Role for rapid dendritic protein synthesis in hippocampal mGluR-dependent long-term depression. Science 288, 1254–1257 (doi:10.1126/science.288.5469.1254) [DOI] [PubMed] [Google Scholar]
- 41.Kang H, Schuman EM. 1996. A requirement for local protein synthesis in neurotrophin-induced hippocampal synaptic plasticity. Science 273, 1402–1406 (doi:10.1126/science.273.5280.1402) [DOI] [PubMed] [Google Scholar]
- 42.Remondes M, Schuman EM. 2003. Molecular mechanisms contributing to long-lasting synaptic plasticity at the temporoammonic-CA1 synapse. Learn. Mem. 10, 247–252 (doi:10.1101/lm.59103) [DOI] [PMC free article] [PubMed] [Google Scholar]
- 43.Falley K, et al. 2009. Shank1 mRNA: dendritic transport by kinesin and translational control by the 5′ untranslated region. Traffic 10, 844–857 (doi:10.1111/j.1600-0854.2009.00912.x) [DOI] [PubMed] [Google Scholar]
- 44.Boeckers TM, et al. 1999. Proline-rich synapse-associated protein-1/cortactin binding protein 1 (ProSAP1/CortBP1) is a PDZ-domain protein highly enriched in the postsynaptic density. J. Neurosci. 19, 6506–6518 [DOI] [PMC free article] [PubMed] [Google Scholar]
- 45.Flavell SW, Kim TK, Gray JM, Harmin DA, Hemberg M, Hong EJ, Markenscoff-Papadimitriou E, Bear DM, Greenberg ME. 2008. Genome-wide analysis of MEF2 transcriptional program reveals synaptic target genes and neuronal activity-dependent polyadenylation site selection. Neuron 60, 1022–1038 (doi:10.1016/j.neuron.2008.11.029) [DOI] [PMC free article] [PubMed] [Google Scholar]
- 46.Di Giammartino DC, Nishida K, Manley JL. 2011. Mechanisms and consequences of alternative polyadenylation. Mol. Cell 43, 853–866 (doi:10.1016/j.molcel.2011.08.017) [DOI] [PMC free article] [PubMed] [Google Scholar]
- 47.Miura P, Shenker S, Andreu-Agullo C, Westholm JO, Lai EC. 2013. Widespread and extensive lengthening of 3′ UTRs in the mammalian brain. Genome Res. 23, 812–825 (doi:10.1101/gr.146886.112) [DOI] [PMC free article] [PubMed] [Google Scholar]
- 48.Tian B, Hu J, Zhang H, Lutz CS. 2005. A large-scale analysis of mRNA polyadenylation of human and mouse genes. Nucleic Acids Res. 33, 201–212 (doi:10.1093/nar/gki158) [DOI] [PMC free article] [PubMed] [Google Scholar]
- 49.Mercer TR, et al. 2011. Expression of distinct RNAs from 3′ untranslated regions. Nucleic Acids Res. 39, 2393–2403 (doi:10.1093/nar/gkq1158) [DOI] [PMC free article] [PubMed] [Google Scholar]
- 50.Sandberg R, Neilson JR, Sarma A, Sharp PA, Burge CB. 2008. Proliferating cells express mRNAs with shortened 3′ untranslated regions and fewer microRNA target sites. Science 320, 1643–1647 (doi:10.1126/science.1155390) [DOI] [PMC free article] [PubMed] [Google Scholar]
- 51.Arnold M, Ellwanger DC, Hartsperger ML, Pfeufer A, Stumpflen V. 2012. Cis-acting polymorphisms affect complex traits through modifications of microRNA regulation pathways. PLoS ONE 7, e36694 (doi:10.1371/journal.pone.0036694) [DOI] [PMC free article] [PubMed] [Google Scholar]
- 52.Halvorsen M, Martin JS, Broadaway S, Laederach A. 2010. Disease-associated mutations that alter the RNA structural ensemble. PLoS Genet. 6, e1001074 (doi:10.1371/journal.pgen.1001074) [DOI] [PMC free article] [PubMed] [Google Scholar]