Abstract
High throughput microarray analysis has great potential in scientific research, disease diagnosis, and drug discovery. A major hurdle toward high throughput microarray analysis is the time and effort needed to accurately locate gene spots in microarray images. An automatic microarray image processor will allow accurate and efficient determination of spot locations and sizes so that gene expression information can be reliably extracted in a high throughput manner. Current microarray image processing tools require intensive manual operations in addition to the input of grid parameters to correctly and accurately identify gene spots. This work developed a method, herein called auto-spot, to automate the spot identification process. Through a series of correlation and convolution operations, as well as pixel manipulations, this method makes spot identification an automatic and accurate process. Testing with real microarray images has demonstrated that this method is capable of automatically extracting subgrids from microarray images and determining spot locations and sizes within each subgrid, regardless of variations in array patterns and background noises. With this method, we are one step closer to the goal of high throughput microarray analysis.
Introduction
Microarray analysis is a widely used technology in genetic-related fields and has been applied in areas ranging from cancer research to pest control. Now scientists can design special microarrays for various purposes, such as cancer research [1], mitochondrial function [2], chromosomal abnormalities [3], and artery diseases [4]. As microarray technology progressed, high-throughput microarray analysis has become a powerful approach for scientific research and disease diagnosis [5]. For example, high-throughput microarray analysis is being developed in identifying molecular targets of brain disorders [6], drug discovery, toxicology, stem cell research [7], cancer research [8], molecular diagnosis [9], functional proteomics [10], and biological system analysis [11].
Many improvements have been devoted to achieving high-throughput microarray analysis, including the areas of sequencing, third dimension, experimental protocol, image capture, and image processing. Among these areas of improvement, microarray image processing is a key step for a successful high-throughput microarray analysis. This step determines the quality of microarray data, which is fundamental to all later analysis such as gene clustering and pathway derivation.
Scientists use microarrays to study gene expression levels and to sequence genomes. By putting DNA in an array on the microarray chip, scientists create an orderly formation of spots. Each spot contains thousands of identical molecules, consisting of DNA, cDNA or oligonucleotides. Microarray images capture the intensity information of these spots. Through image processing, one can obtain accurate intensity information of these spots, from which gene expression levels are studied. Due to a variety of production sources, microarray chips are produced with different densities, different spot sizes, and different arrangement patterns. The spot intensities reflect quantity levels and have a wide range of values. Further complicating the analysis, a microarray image is often misaligned and rotated to a varying degree. In addition, background due to noise and contamination can directly affect the accuracy of spot detection and measurement.
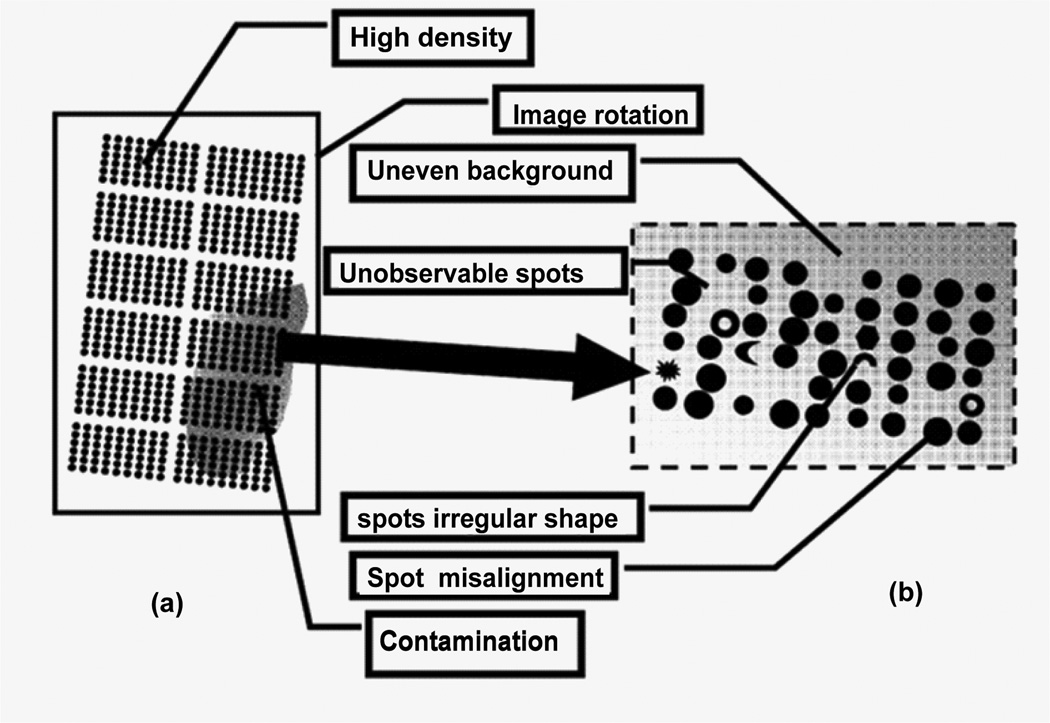
Figure 1 shows typical difficulties in microarray image processing. These include: 1) spot misalignment, where spots are offset from their intended location; 2) image rotation, which is unwanted rotation of microarray grids; 3) unobservable spots, where large ranges of intensities make some spots hard to detect; 4) uneven background due to noise; 5) contamination on microarray slides; 6) high spot density; and 7) irregular spot shapes and sizes. In addition, microarrays from different vendors have different formats, often requiring special information from vendors to perform a successful image analysis.
Figure 1.
Typical complications in microarray image processing. Panel (a) shows a microarray image layout, which has rows and columns of subgrids. Panel (b) shows a subgrid, which contains rows and columns of gene spots.
Even with microarray format information from vendors, much human input is needed to accurately determine the locations and sizes of many spots in a microarray image. Current microarray image analysis software more or less needs microarray parameters, such as numbers of row and columns and distances between spots. Ma n u a l adjustment of microarray grids is often required for a successful microarray image processing. The grid circles enclosing spots may be too small, resulting in the loss of data, or be too large, resulting overlapping with neighboring spots. The grid circles could also be completely off the spot, distracted by unwanted splotches on the chip. Consequently, human input is needed to correct these inaccuracies in spot detection and measurement. This takes up many hours of repetitive and tedious adjustments, making microarray technology, which is meant to expedite scientific investigations, much less efficient.
There are existing software tools available for microarray image analysis such as ScanAlyze (by M.B. Eisen, http://www.eisenlab.org/ eisen/) and TIGR Spotfinder [12] (www.tigr.org/software/tm4/). However, they require intensive manual operations to accurately identify spots and measure intensities.
There have been numerous attempts to automate the image processing procedures since the emergence of the microarray technology [13–31]. However, these methods usually rely on either specific array formatting information or human input, and are not available in most commonly used microarray analysis software.
The most recent and up to date work for automatic image processing is by Rueda and Rezaeian [31]. They use radon transform to determine rotation and use horizontal and vertical histograms to identify rows and columns. This discrete approach may be inaccurate in determining the rotation angle and does not address non-rectangular spot arrays.
This work developed a method called the auto-spot method to automate the process of analyzing microarray images. This method is unique in the way to map spot locations through a combination of correlation and convolution operations. The method is able to locate subgrids within a microarray image and to identify spot regions regardless of array patterns, rotational angles, and margin sizes. To demonstrate the performance of this method, in the results and discussion section, we applied the method, as well as two available softwares, ScanAlyze and Spotfinder, to microarray images of different arrangements.
Method
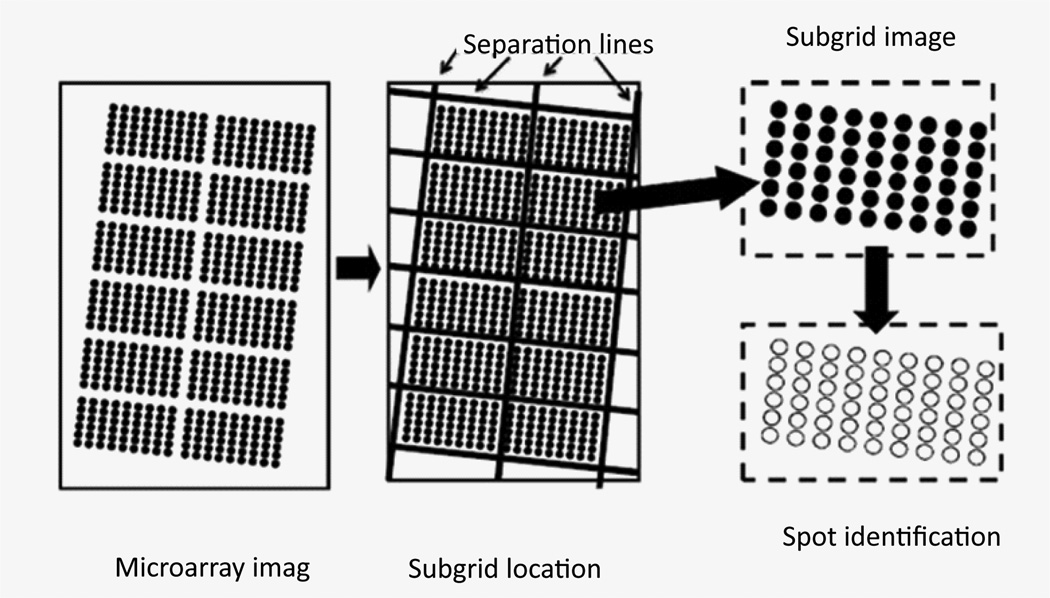
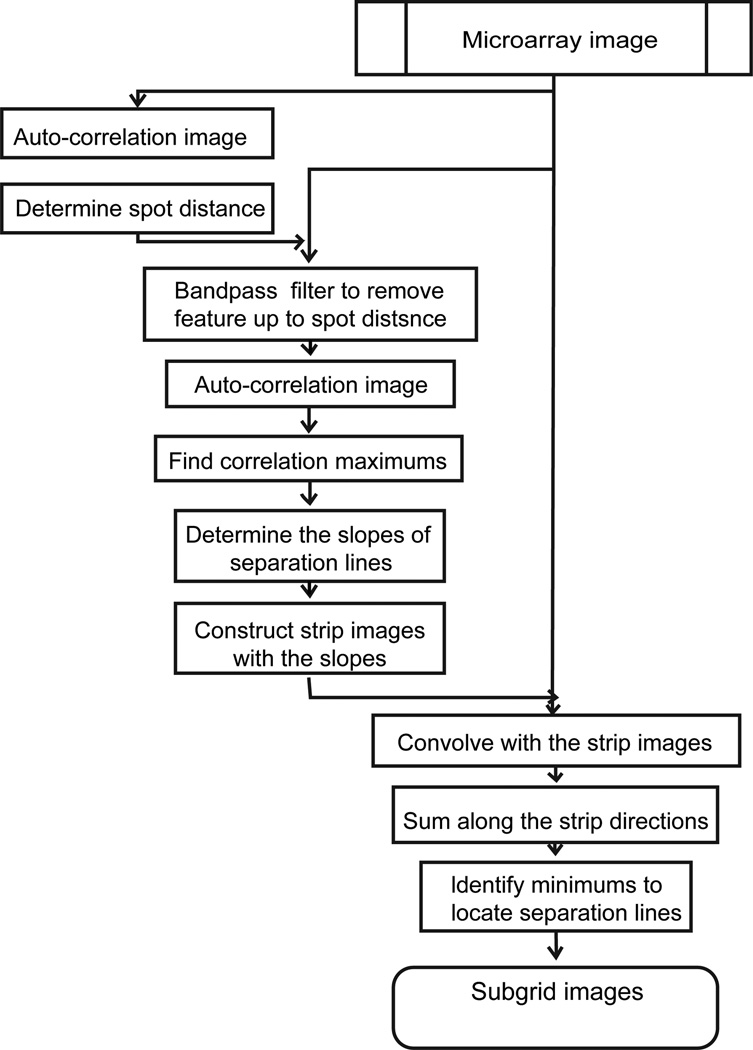
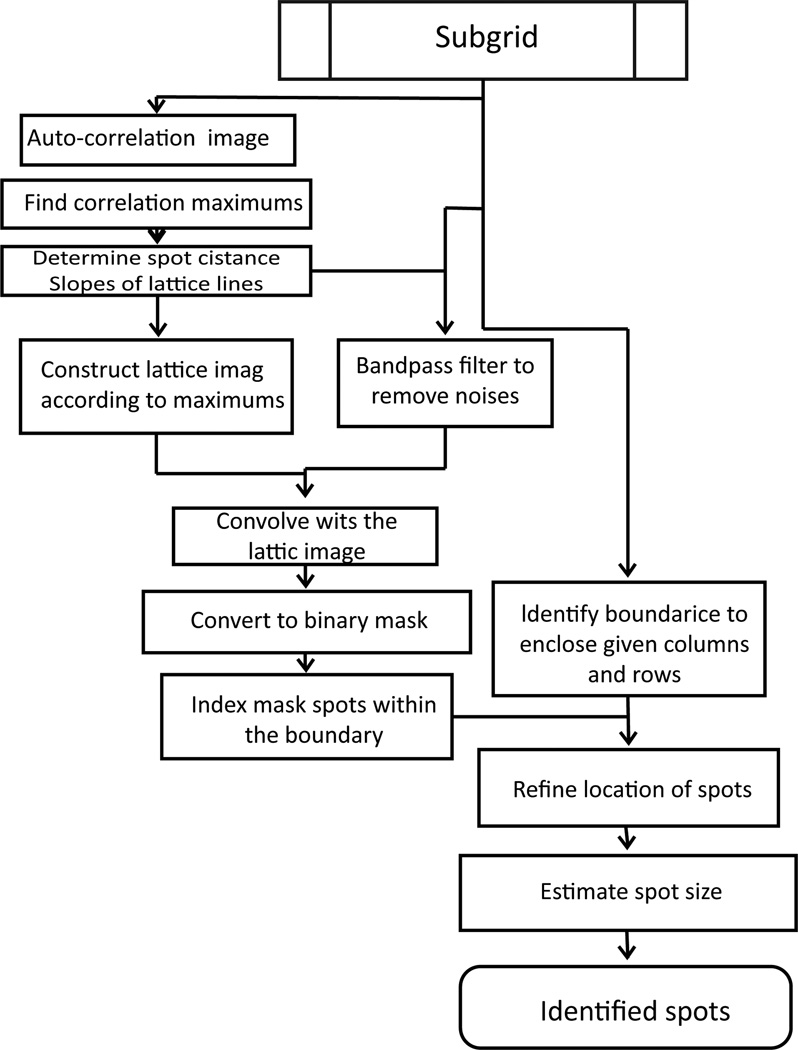
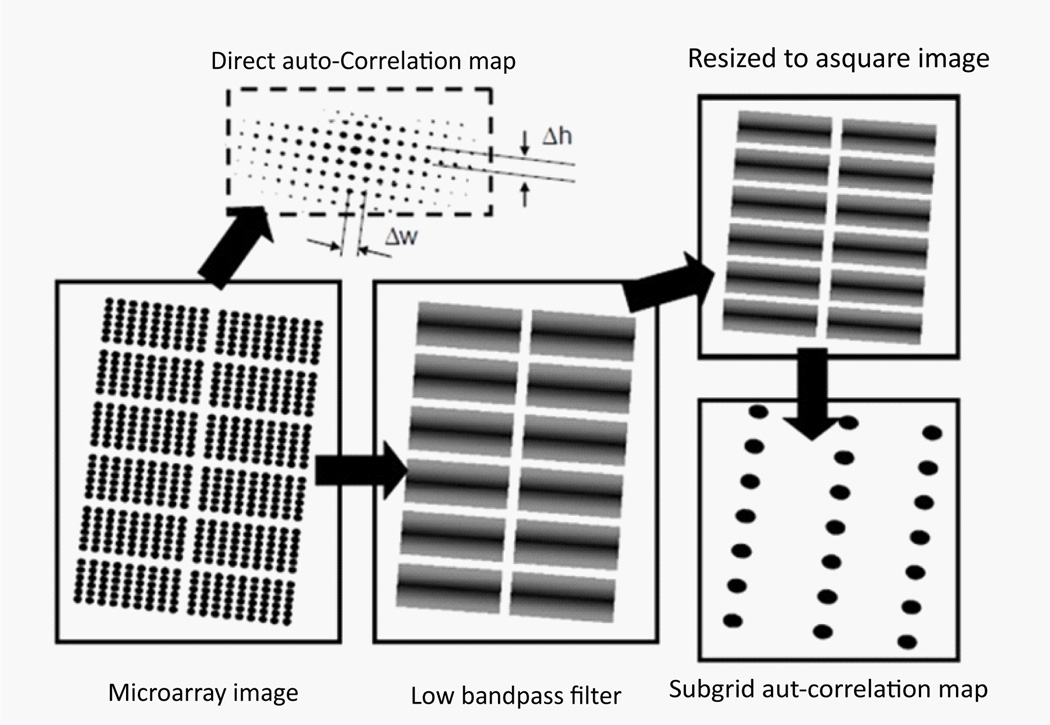
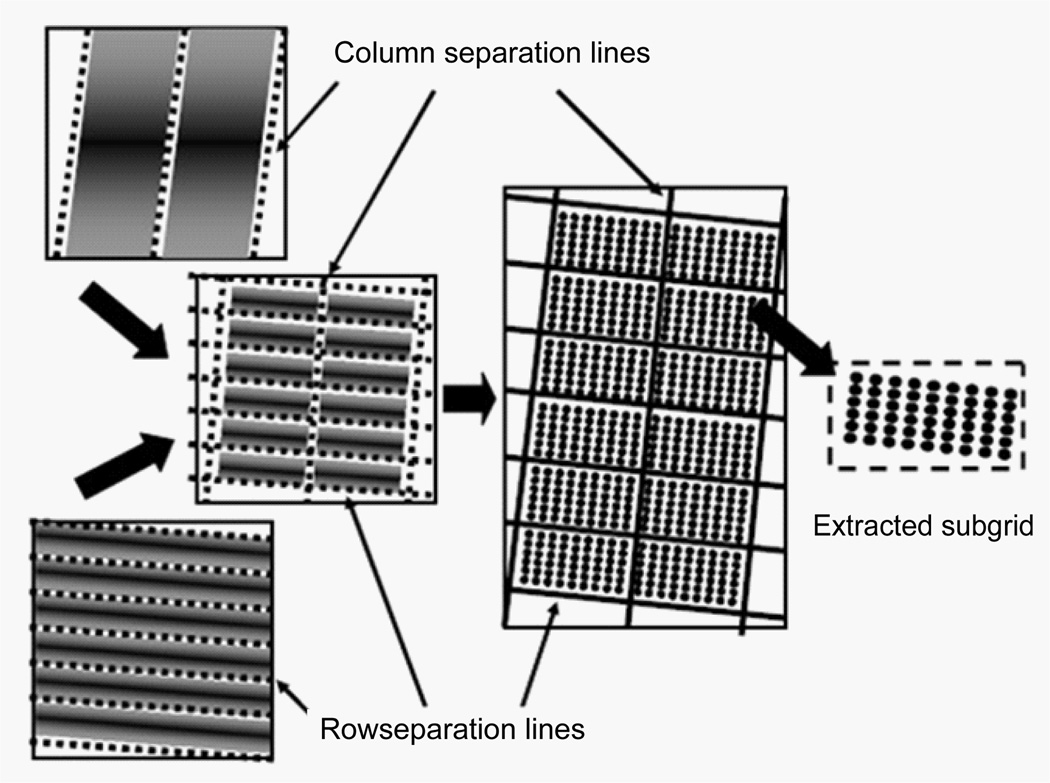
Microarray gene spots are often grouped into subgrids and each microarray chip contains columns and rows of subgrids. An automatic processing method for microarray analysis needs to be able to separate subgrids in a microarray image from one another and to identify spots within each subgrid image. This work presents a method herein called auto-spot to automatically process microarray images. Figure 2 shows the image processing procedures of this method. The auto-spot method processes a microarray image in two procedures. First, it extracts subgrids from an image; and second, it identifies spots within each subgrid image. Figure 3 shows a flow chart depicting steps for extracting subgrids, and Figure 4 shows a flow chart of the steps for identifying spots. In the following subsections, these two procedures are described separately.
Figure 2.
The microarray image processing of the auto-spot method. First, a microarray image is separated into subgrids by identifying separation lines. Then, subgrids are processed to identify gene spots.
Figure 3.
Flowchart forsubgridextraction.
Figure 4.
Flowchart for spotidentification.
Subgrid extraction
A microarray image has subgrids in rows and columns. However, where the rows and columns are, and how much the image has been rotated, need be decided before subgrids can be separated from one another. The auto-spot method locates subgrids by determining the separation lines that separate subgrids into rows and columns. The subgrids are then extracted from the enclosed region of these separation lines. The steps in this subgrid location process are explained in detail below.
Calculate the auto-correlation map of a microarray image
First, estimate the average distances between the maximums, Δ w in horizontal and Δh in vertical, in the auto-correlation map of the microarray image. The microarray image is then filtered with a band-pass filter to remove structure features of the size max {Δ w, Δ h} or less. For the convenience of correlation function calculations, the microarray image may be resized to a square with a side length being a power of two. After the filtering, the main structure features of the image are the subgrids. The auto-correlation map of the filtered image contains the arrangement information of the subgrids. The maximums in the subgrid auto-correlation map represent the arrangement of the subgrids and are used to calculate the slops of the separation lines (Figure 5).
Figure 5.
The subgrid auto-correlation map of microarray images. The maximums in the subgrid auto-correlation map reflect the relative positions of the subgrids.
Construct strip images of rows and columns
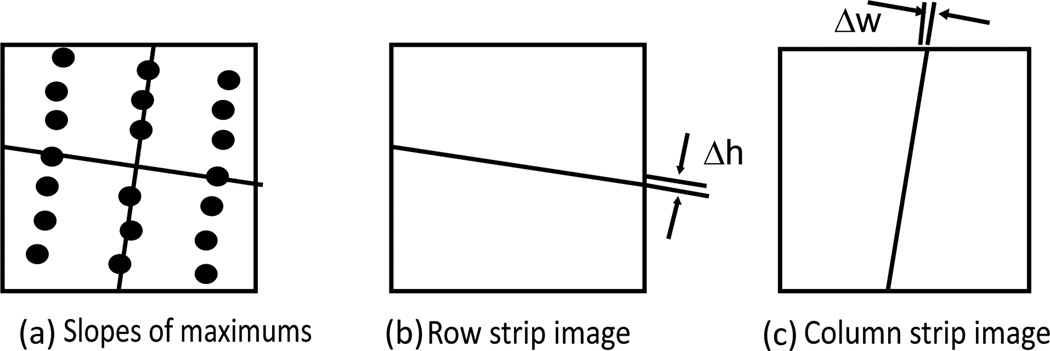
The slopes of the rows and columns are calculated from the maximums in the subgrid auto-correlation image obtained above. Identify the near vertical maximums from above and below the origin and the near horizontal maximums from the right and left of the origin. The slopes are calculated in the following way (Figure 6):
| (1a) |
| (1b) |
Figure 6.
(a) Slopes of the rows and columns calculated from the maximums; (b) the row strip image; and (c) the column strip image.
Here, nw ,nh are the numbers of maximums along the row and column separation lines. The variables, kw, kh are the slopes of the row and column separation lines. Please note that the slope of the column separation line kh is calculated usingx;against y as shown in equation (1b) to avoid overflow for vertical lines. Using the slopes, a row strip image and a column strip image can be created as shown in Figure 6. These strip images are images of the same size as the original image. Their pixel values are one in a strip region and zero otherwise. The strip has a defined slop and width. The width of the strip is set to Δw and Δh for the column strip and the row strip, respectively. The purpose of these strip images is to enhance the contrast between spot regions and non-spot regions through convolution, as explained in the next step.
Locate separation lines from the strip convolution images
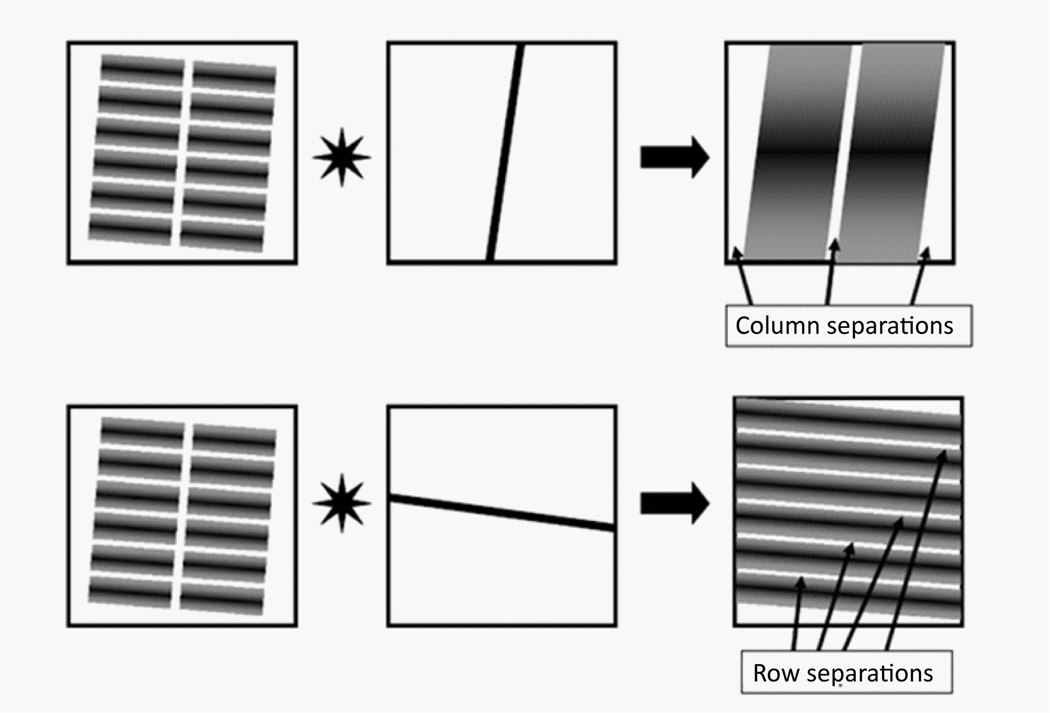
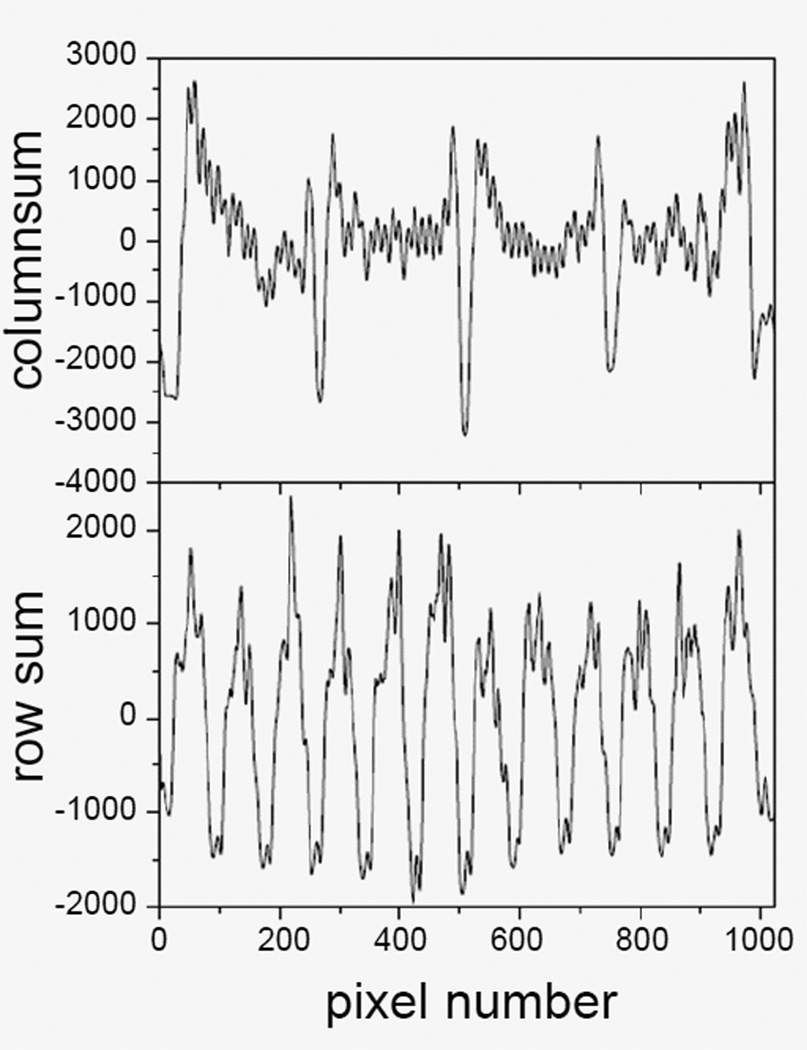
Convolve the band-pass filtered image obtained in step 1.1 with the row and column strip images obtained in step 1.2 to make the separation region stand out (Figure 7). The strip convolution makes spot region overlap except the separation between subgrids, so that the separation between subgrids have minimum intensities, which are apparent in the intensity sums along the row or column slopes (Figure 8). By identifying the minimums, the equations of separation lines, equations. (2a) and (2b) can be defined for each separation.
| (2a) |
| (2b) |
Figure 7.
Convolution withcorrelation-derivedstripstoenhancethecontrastofseparationsbetween subgrids.
Figure 8.
Sum of intensities along the column slope (top panel) and row slope (bottom panel) at different positions. Separation positions can be clearly identified from the minimums.
Where bhj, bwi define the location of the separation lines. Between the separation lines are the subgrids to be extracted for spot identification.
Extract subgrids from the region enclosed by the separation lines
The separation lines are scaled back to the original microarray image size to separate subgrids. Subgrids between these separation lines are extracted from the image to identify spots in the next procedure (Figure 9).
Figure 9.
Thesubgrids are extracted from the regions enclosed by the separation lines.
Spot identification
Once subgrids are extracted, spots are to be identified within subgrids. The flow chart of the spot identification procedure has been shown in Figure 4. The concept is that within a subgrid, spots are arranged in a single pattern. Spot locations match the pattern everywhere, regardless of actual spot intensities. Therefore, spot locations can be determined once the pattern is known. The accurate spot locations are refined with spot intensities. The boundary of the spot array is determined by spot intensities. Within the boundary, spot sizes and locations are refined with pixel values. By following the pattern, no spot will miss within the boundary. The details of the spot identification procedure are described as the following steps.
Array pattern extraction
For convenience, each subgrid is resized to a square with a side length being a power of two. Calculate the autocorrelation image and find all maximums in the correlation image (Figure 10). The auto-correlation image reflects the array pattern but has inconvenient maximum values. The center peak is extremely high and peaks distant from the origin are blurring due to noises and printing distortion. A lattice image based on the locations of the maximums is constructed with peak heights exponentially decaying from the origin. The decay function of the following form is used to reduce effects of long-range distortions:
| (3) |
Figure 10.
Processing a subgrid image to obtain a grid lattice map. The grid lattice map describes the spot distribution pattern.
The decay distance is set to a fraction of the subgrid size
Spot location map
The subgrid image is convolved with the lattice image obtained from step 2.1 to produce a spot location map that shows the ideal spot positions throughout the map (Figure 11). A convolution with the lattice image enhances the intensities of positions that are on the lattice pattern. All positions belong to the lattice pattern are maximums in the spot location map and are identified by finding the maximums.
Figure 11.
Convolve the subgrid image with the lattice map to produce the spot location map.
Boundary determination
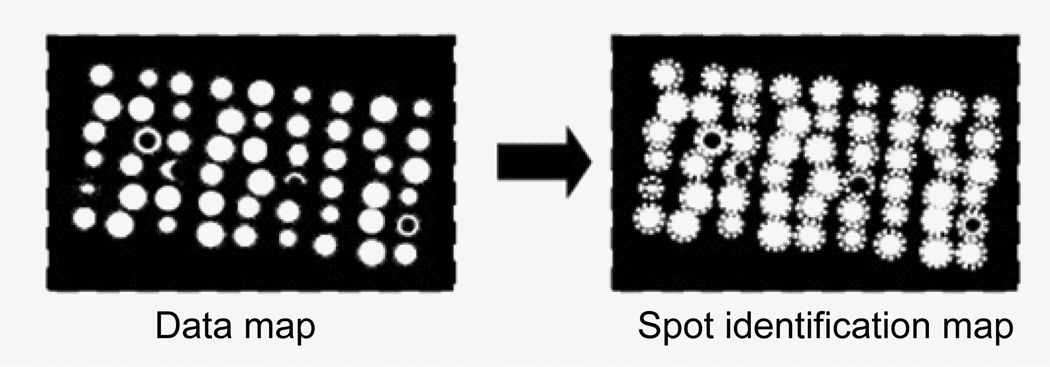
The intensities at the spot locations are sum up in rows and columns. The sums within the boundary are significantly higher than the sums outside the boundaries. Therefore, the boundary locations can be defined at the place where the sum increases significantly. The spots within the boundaries are data spots (Figure 12).
Figure 12.
Determine the boundary rows and columns based on intensity sums in rows and columns. The subgrid image within the boundary is the data map.
Location refinement and size determination
For each data spot, calculate the center of intensity around the ideal location by the following equations (Figure 13),
| (4a) |
| (4b) |
Figure 13.
Spot location refinement and size determination.
The spot size can be fixed to be a certain percentage (e.g., 80%) of the grid size, which is defined by the distance between the neighboring spots. It can also be variable and determined by the number of pixels with intensities above the mean intensity,
Here, N(Ii > Ī ), is the number of pixels that have intensity higher than average intensity of the spot region, where rg is the radius in pixels. The values of xg, yg, and rg, represent the location and size of the spot to be identified.
Once the locations and sizes of spots are determined, it is straightforward to extract the intensity information of the spots. As to the processing of intensities and related them to gene functions are the topics of many studies and are not discussed here.
Program Design
The auto-spot method is developed based on a popular image processing program: ImageJ [32,33]. ImageJ provides many image processing related functions, such as band-pass filter, correlation, convolution, access and manipulation of pixel values, etc. By utilizing these functions of ImageJ, this development can focus on concepts and ideas. ImageJ also provides utilities for macro script writing and debugging that makes it very convenient for programming and testing. It is planned to implement the auto-spot method to program R (http://www.r-project.org/) so that many people in the microarray analysis community can access this method.
Result and Discussion
The auto-spot method presented in this work is for high throughput microarray image processing. This method’s capability of automatically gridding can be demonstrated using real microarray images. For objective examinations and demonstrations, it is recommended to use public microarray images to apply the method. There are many such microarray images available from the microarray community. In this work, the microarray images from the Stanford microarray database (SMD) at www.smd.stanford.edu were downloaded and used to examine this method and to compare it with other methods. Due to the space limitation, only two images with different microarray spot patterns are examined in this report. One has a rectangular array pattern, and the other has a hexagonal array pattern.
For the purpose of comparison, the results from two widely used microarray image processing softwares, ScanAlyze version 2.51 (by M.B. Eisen, http://www.eisenlab.org/eisen/) and TIGR Spotfinder version 3.2.1 [12], are presented. Both of the programs are freely available and well documented. ScanAlyze and TIGR Spotfinder are valuable software tools and have been used in many microarray studies. They have many more functions in addition to gridding microarray images. In the comparisons reported here, we only focus on spot identification. Due to the space limitation and availability, as well as cost, other software tools are not compared. Further comparisons with other software tools will be reported in future studies.
Global transcriptional profiling microarray (SMD ID: 20385)
This image represents a typical microarray spot layout with a rectangular array pattern. We chose this image is because it contains most features of microarray images, such as a tilted layout, contamination, high noises, etc.
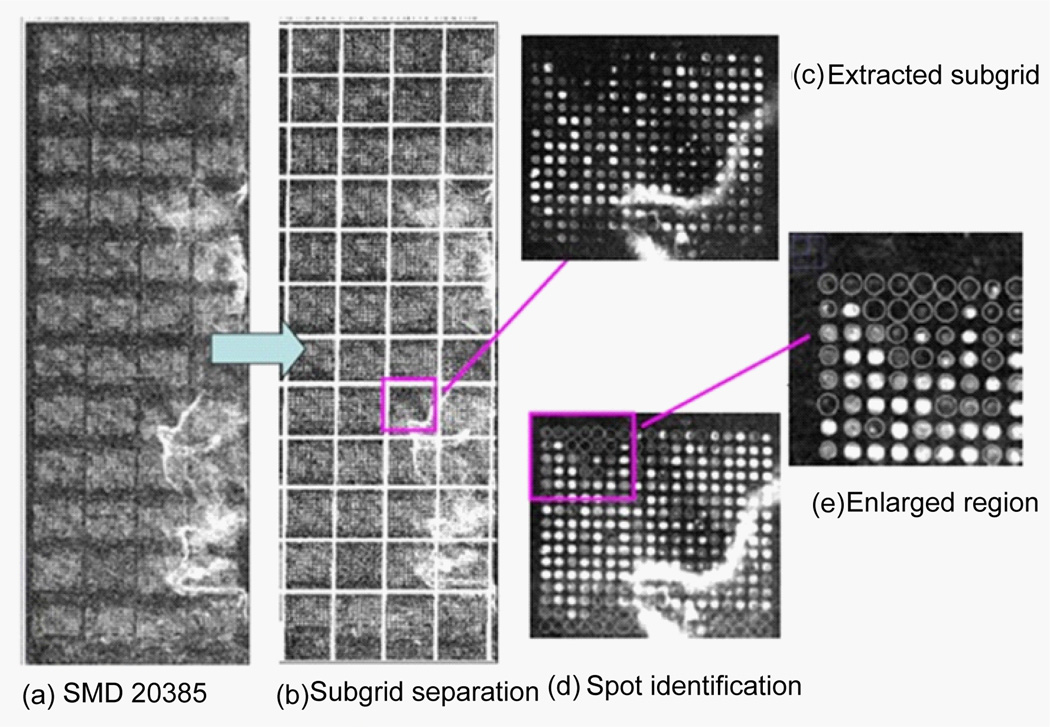
Figure 14 shows the image of SMD 20385 (panel (a)) and the results of the subgridding (panels (b) and (c)) and the spot identification (panels (d) and (e)) with the auto-spot method. As can be seen from panel (a), the SMD 20385 image tilts toward its right. It is noisy and has contaminations. Panel (b) shows the separation lines produced with the auto-spot method. It is clear that the separation lines are positioned perfectly to separate rows and columns. The separation lines tilt the same way as the subgrid layout to correctly enclose the subgrids. Panel (c) shows a subgrid extracted from the region enclosed by the separation lines. Panel (d) shows the result of the spot identification. The spots are marked by circles, whose sizes correspond to the spot sizes. For clarity, an enlarged portion of the spot identification is shown in panel (e). The locations and sizes of the circles agree well with the spots in the image. Some weak spots have large circles, because spot size is determined by the distribution of pixel values, not by the absolute values of pixels.
Figure 14.
(a) Microarray image of SMD20385 channel 1 downloaded from smd.stanford.edu. This image contains 4×12 subgrids. Each subgrid contains spots in a rectangular pattern. (b) The separation lines obtained with the auto-spot method are shown as white lines. (c) A subgrid extracted using the separation lines. (d) The spots identification result. White circles represent the locations and sizes of the spots. (e) An enlarged portion of the spot identification result.
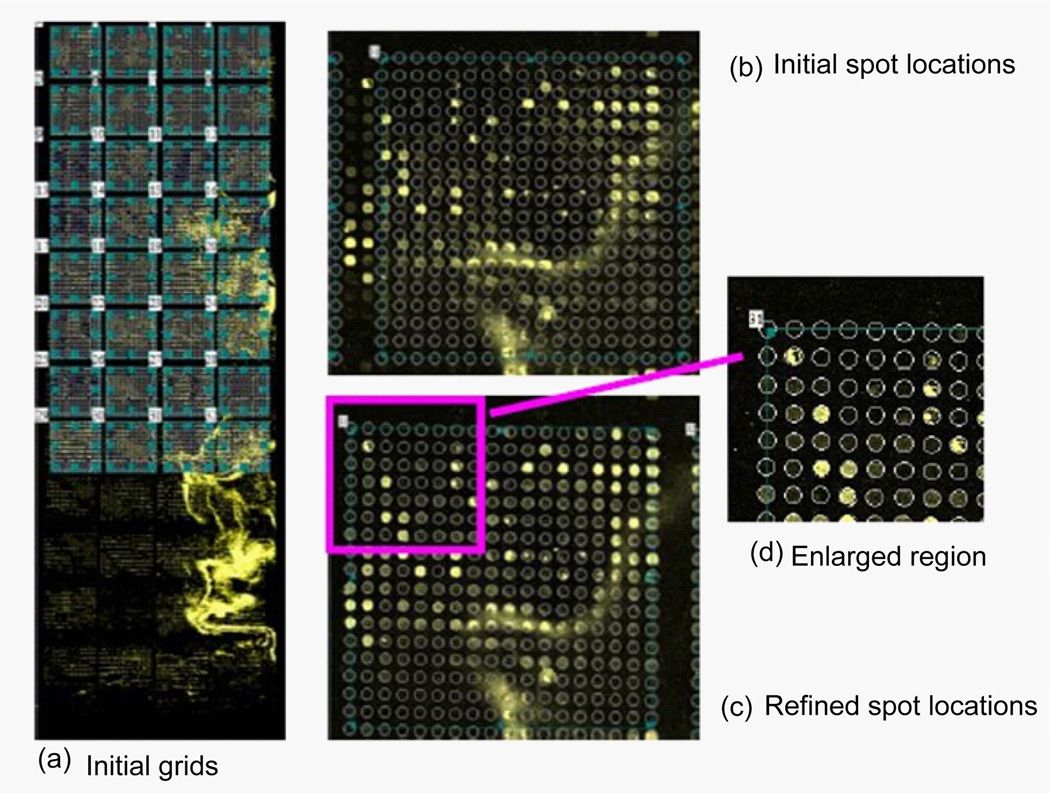
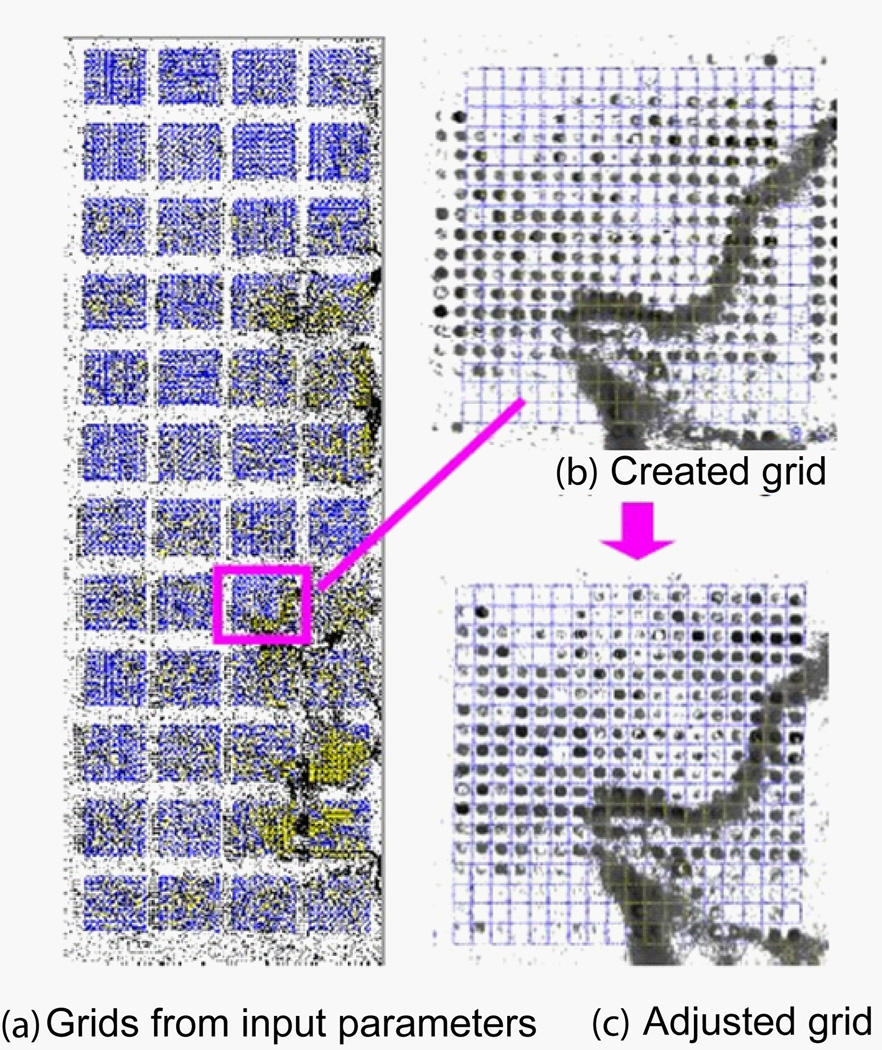
As a comparison, we show the results from ScanAlyze and Spotfinder. Figure 15 shows the result of ScanAlyze. To use ScanAlyze to grid a microarray image, one must create a new grid if an existing grid is not available. To create a new grid, one must input a series of microarray parameters, such as number of rows and columns, spot resolution inx;and y direction, spot width and height, pin spaces inx;and y directions, and the number of subgrids to generate. Table 1 lists the microarray parameters used to create the initial grids.
Figure 15.
Gridding result with ScanAlyze for SMD20385. (a) 32 generated subgrids with input parameters listed in Table 1. (b) An enlarged view of the generated subgrid. (c) After resizing, moving, tilting, and refining, the grids match well with the spots. (d) An enlarged region of panel (c).
Table 1.
InputparametersforthetwomicroarrayimagestocreateinitialgridsforScanAlyzeandSpotfinder.
Figure 15 (a) shows a generated grid with parameters shown in Table 1. Only 32 subgrids are created because that is the maximum number of subgrids allowed by ScanAlyze. Initial grids often mismatch the spots in microarray images due to a variation in actual parameters, printing errors, as well as image tilting. Figure15 (b) shows an enlarged initial grid, from which one canclearly see the significant mismatches between grid circles and the spots. The mismatch is corrected manually with mouse by dragging the grid to the location and resizing to match the subgrids. The match is further improved by pressing repeatedly a refine button. Figure 15(c) shows the final gridding result. An enlarged portion is shown in Figure 15 (d). As can be seen the circles match the spots very well.
With Spotfinder, a grid can also be created and refined. Figure 16 (a) shows the grid created with the parameters listed in Table 1. Spotfinder permits defining the numbers of pins in the x and y directions so all subgrids can be generated at once. Again, initially generated grids mismatch the spots significantly, as shown in Figure 16 (b). Each grid must be individually moved, resized, tilted, and adjusted to produce the final grids that match well with the spots, as shown in Figure 16(c).
Figure 16.
Gridding result with Spotfinder for SMD20385. (a) 4×12 generated subgrids with input parameters listed in Table 1. (b) An enlarged view of the generated subgrid. (c) After resizing, moving, tilting, and adjusting, the grids match well with the spots.
For microarray images of this type, the auto-spot method, as well as ScanAlyze and Spotfinder, work well to locate spots. However, the need to input initial parameters and the intensive manual operations with ScanAlyze and Spotfinder makes the auto-spot method a much more efficient choice over other methods.
Human lung fibroblast mock microarray (SMD ID: 69028)
This microarray image represents another category of images wherein spots are arranged in a hexagonal pattern to maximize the density in a gene chip. This pattern causes difficulties for general purposed gridding methods that assume spots arranged in a rectangular pattern.
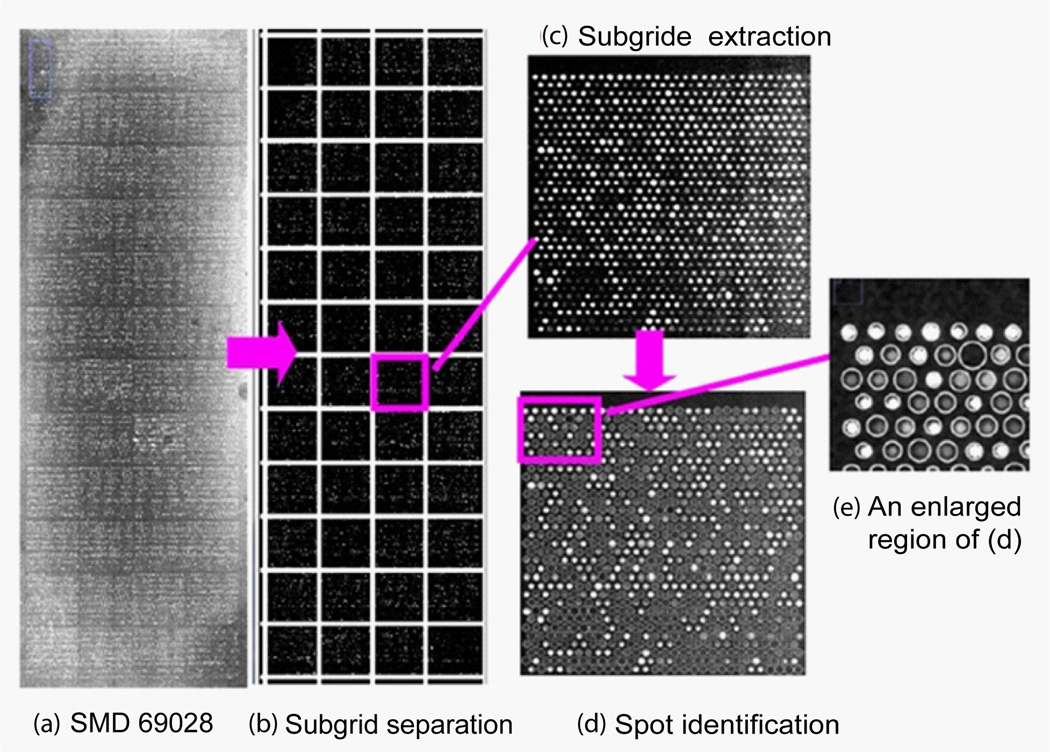
Figure 17 shows the microarray image of SMD69028 and the processing results with the auto- spot method. This image has 4×12 subgrids and each subgrid has 29×32 spots. The separation lines generated by the auto-spot method for columns and rows are shown as white lines in Figure 17 (b). Figure 17(c) shows a subgrid with 29×32 spots. After spot identification, all spots are identified, enclosed with circles of corresponding sizes, shown in Figure 17 (d). An enlarged part of the result is shown in Figure 17 (e). Clearly, the locations and sizes identified agree well with the spots. Again, the sizes are determined by the distribution of pixel values, not by their absolute values. Therefore, weak spots are not necessarily small in size.
Figure 17.
(a) Microarray image of SMD69028 channel 1 downloaded from smd.stanford.edu. This image contains 4×12 subgrids. (b) The separation lines for columns and rows are produced with the auto-spot method and are shown as white overlay lines. (c) A subgrid extracted from the image, where spots are arranged in hexagonal pattern. (d) The spot identification result with the auto-spot method. The white circles indicate the locations and sizes of the spots. (e) An enlarged region of the spot identification result.
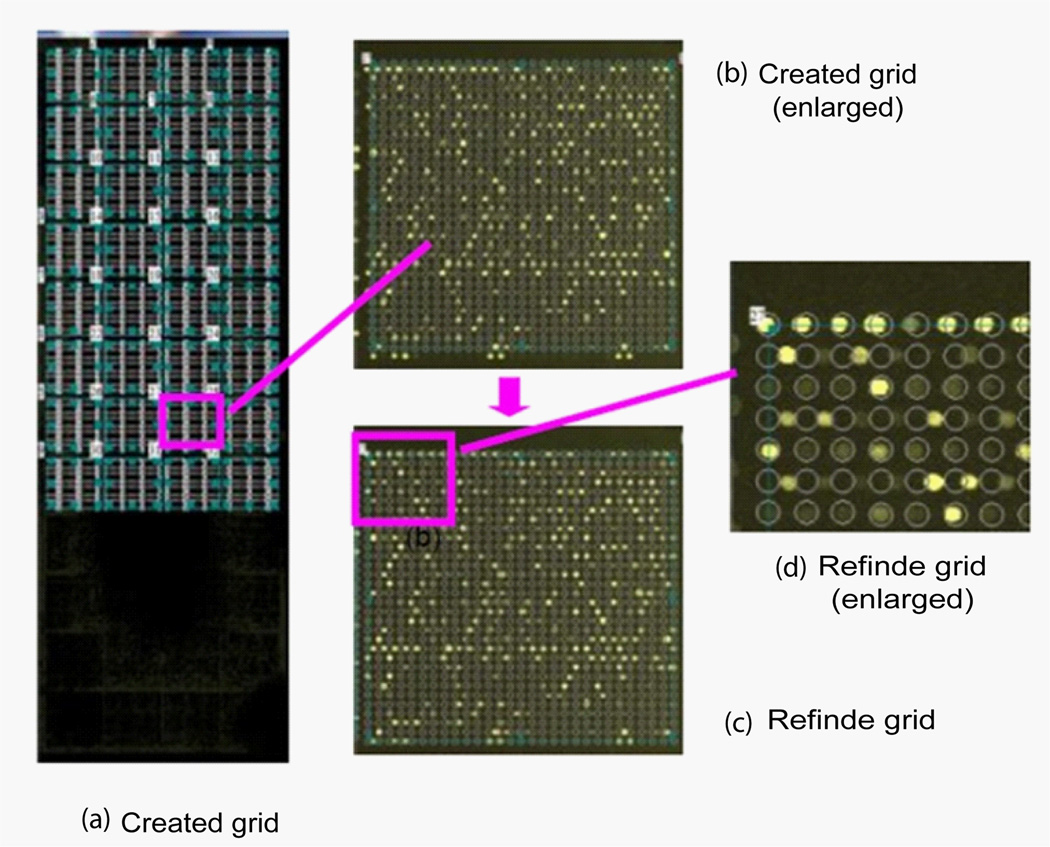
Figure 18 shows the gridding result from ScanAlyze after inputting grid information such as spot size, spacing, column number and row number, etc, as listed in Table 1. Figure 18 (a) shows the 32 subgrids created, which are the maximum number of subgrids that ScanAlyze can create. Figure 18 (b) shows a subgrid from the initial creation. The grid circles significantly mismatch the spots. Figure 18(c) shows the result of refinement. For clarity, an enlarged portion of panel (c) is shown in panel (d). As can be seen, the circles of the first row and every other row below it match the spots quite well, but in the second row and every other row below it, the circles mismatch the spots. This result demonstrates that the refining procedure cannot produce a grid with a hexagonal pattern to match the spots.
Figure 18.
Gridding result with ScanAlyz for SMD69028. (a) 32 generated subgrids with input parameters listed in Table 1. (b) An enlarged view of the generated subgrid. (c) After resizing, moving, tilting, and refining, the subgrid-dismatches many of the spots. Panel (d) shows an enlarged region to illustrate the mismatch of grids and spots.
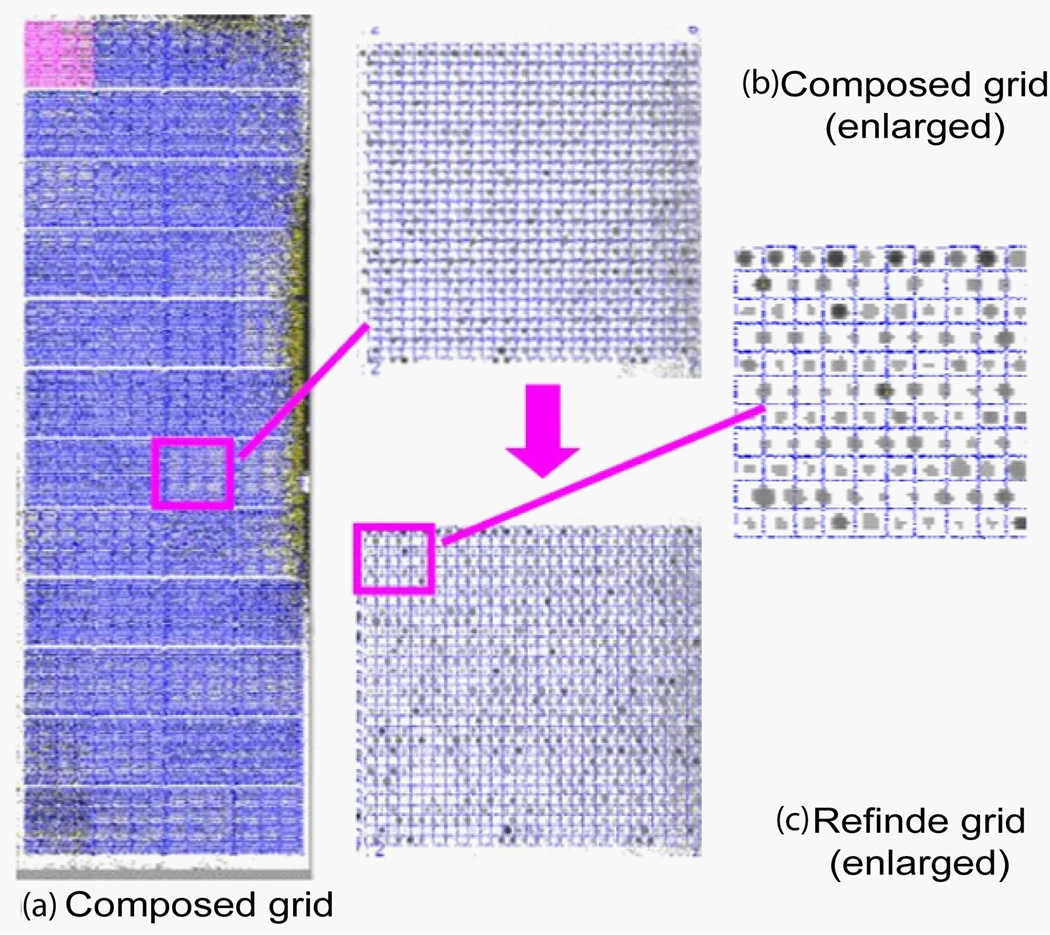
Figure 19 shows the gridding results from TIGR Spotfinder after inputting all spot parameters listed in Table 1. Figure 19 (a) shows the initial grids and Figure 19 (b) shows an initial subgrid, where significant mismatches can be seen. Figure 19(c) shows the result after refinement, including moving, expanding, rotating, and adjusting. Figure 19 (d) shows an enlarged portion of the refinement result. Clearly, the first row and every other row below it have fairly good matches to the spots. However, the second row and every other row below it show very poor gridding result where spots often sit on top of the grid lines.
Figure 19.
Gridding result with Spotfinder for SMD69028. (a) 4×12 generated subgrids with input parameters listed in Table 1. (b) A generated subgrid. (c) The grid after resizing, moving, tilting, and refining, where mismatches between spots and grids remain. (d) An enlarged view of the adjusted result.
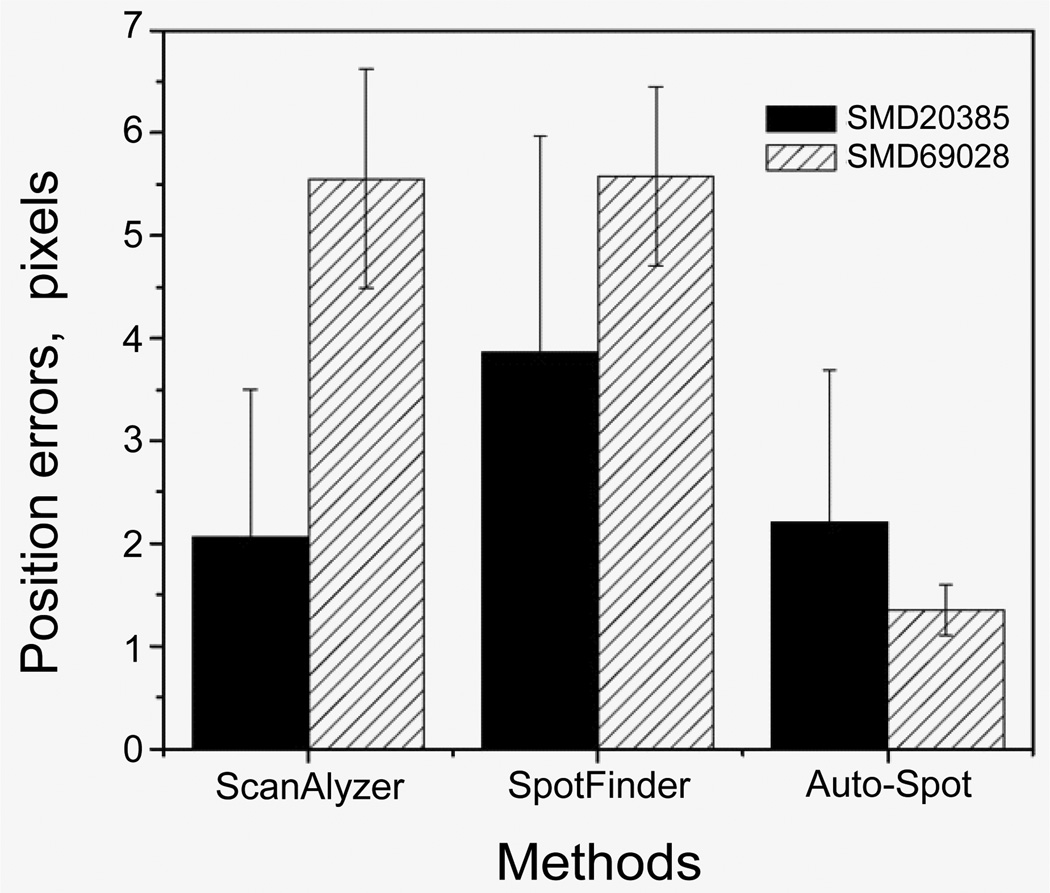
To quantitatively compare the accuracy of these methods, we use the spot location data reported by the Stanford microarray database as the standard to examine the identification results of these methods. Figure 20 shows the root mean square deviation (RMSD) of the spot locations from the SMD reports for the two microarray images examined above. The black bars show the RMSDs for the SMD20385 image and the shadowed bars show the RMSDs for the SMD69028 image. For the SMD 20385 image where arrays are printed in a rectangular pattern, ScanAlyze and the auto-spot methods produce similar accurate measurement with RMSDs around 2 pixels, while the Spotfinder result has a larger RMSD. Therefore, for images with rectangular array pattern, ScanAlyze can be as accurate as the auto-spot method. The Spotfinder result is less accurate, probably due to insufficient manual operations to adjust the gridding result. For SMD 69028 where array is in a hexagonal pattern, the auto-spot method has a satisfactory accuracy with a RMSD of 1.5 pixels, while ScanAlyze and Spotfinder produce much larger RMSDs around 5.5 pixels. Figure 20 as shown in attached word file.
Figure 20.
Spot location errors from the three methods. The coordinates from the Stanford Microarray Database reports are used as the reference to calculate the position errors.
These results show that to use ScanAlyze or Spotfinder for SMD69028, one needs special grids designed for the microarray chip. In addition, a major difficulty with these tools is that substantial manual inputs and adjusts are needed for an accurate identification of spots. This is not a serious problem for lab-scale microarray studies, but for high throughput microarray analysis, this will be a significant hurdle that will be labor expensive and time consuming. These results demonstrate the auto-spot method works well for this type of microarray images with little manual operation.
While the auto-spot method has shown superior ability to extract subgrids and to identify spots automatically, there are difficult situations where this method may fail. One scenario is when subgrids are not arranged in rows and columns where no separation lines can be produced to separate subgrids. So far, we have not seen such type of subgrid arrangements. In other words, in all microarray images we have seen, subgrids are arranged in rows and columns and the auto-spot method can apply.
Another difficulty is when subgrids are printed so close to each other that the space between subgrids is not larger than the space between spots. In this case, the separation lines cannot be automatically located from the minimums.
A third case is that wherein all spots in the boundary rows or columns are all too weak to permit determination of the boundary rows and columns. This difficulty can be solved if the number of columns and rows are known. In this case, the boundary can be identified based on column and row numbers plus the difference in intensities.
Conclusions
This work developed an automatic spot identification method for the purpose of high throughput microarray analysis. This method performs microarray image processing in two procedures. First, it extracts subgrids by locating separation lines between columns and rows of subgrids. Second, it identifies spots within subgrids so that their size and intensities can be measured. Comparison with publicly available software, ScanAlyze and TIGR Spotfinder, demonstrates that this method is more efficient and more automatic to obtain accurate spot locations and sizes than the other methods. To make this method a reliable tool for microarray image processing, extensive testing and optimization will be performed. With this fully automatic method, we are one step closer to the goal of high throughput microarray analysis.
Footnotes
This is an open-access article distributed under the terms of the Creative Commons Attribution License, which permits unrestricted use, distribution, and reproduction in any medium, provided the original author and source are credited.
References
- 1.Su YA, Yang J, Tao L, Nguyen H, He P. Undetectable and Decreased Expression of KIAA1949 (Phostensin) Encoded on Chromosome 6p21.33 in Human Breast Cancers Revealed by Transcriptome Analysis. J Cancer. 2010;1:38–50. doi: 10.7150/jca.1.38. [DOI] [PMC free article] [PubMed] [Google Scholar]
- 2.Su YA, Zhang Q, Su DM, Tang MX. Rat mitochondrion-neuron focused microarray (rMNChip) and bioinformatics tools for rapid identification of differential pathways in brain tissues. Int J Biol Sci. 2011;7:308–322. doi: 10.7150/ijbs.7.308. [DOI] [PMC free article] [PubMed] [Google Scholar]
- 3.Chen G, Zeng W, Miyazato A, Billings E, Maciejewski JP, et al. Distinctive gene expression profiles of CD34 cells from patients with myelodysplastic syndrome characterized by specific chromosomal abnormalities. Blood. 2004;104:4210–4218. doi: 10.1182/blood-2004-01-0103. [DOI] [PubMed] [Google Scholar]
- 4.Ganesh SK, Skelding KA, Mehta L, O’Neill K, Joo J, et al. Rationale and study design of the CardioGene Study: genomics of in-stent restenosis. Pharmacogenomics. 2004;5:952–1004. doi: 10.1517/14622416.5.7.949. [DOI] [PubMed] [Google Scholar]
- 5.Bubendorf L. High-throughput microarray technologies: from genomics to clinics. Eur Urol. 2001;40:231–238. doi: 10.1159/000049777. [DOI] [PubMed] [Google Scholar]
- 6.Gu Q. High-throughput identification of molecular targets of brain disorders using antibody-based microarray analyses. Expert Rev Neurother. 2008;8:1281–1283. doi: 10.1586/14737175.8.9.1281. [DOI] [PubMed] [Google Scholar]
- 7.Fernandes TG, Diogo MM, Clark DS, Dordick JS, Cabral JM. High-throughput cellular microarray platforms: applications in drug discovery, toxicology and stem cell research. Trends Biotechnol. 2009;27:342–349. doi: 10.1016/j.tibtech.2009.02.009. [DOI] [PMC free article] [PubMed] [Google Scholar]
- 8.Radhakrishnan R, Solomon M, Satyamoorthy K, Martin LE, Lingen MW. Tissue microarray - a high-throughput molecular analysis in head and neck cancer. J Oral Pathol Med. 2008;37:166–176. doi: 10.1111/j.1600-0714.2007.00606.x. [DOI] [PubMed] [Google Scholar]
- 9.Takahashi Y, Goto J, Tsuji S. Application of DNA microarray-based high throughput gene analysis system for molecular diagnosis. Tanpakushitsu Kakusan Koso. 2005;50:2115–2121. [PubMed] [Google Scholar]
- 10.Hu Y, Uttamchandani M, Yao SQ. Microarray: a versatile platform for highthroughput functional proteomics. Comb Chem High Throughput Screen. 2006;9:203–212. doi: 10.2174/138620706776055467. [DOI] [PubMed] [Google Scholar]
- 11.Sobek J, Bartscherer K, Jacob A, Hoheisel JD, Angenendt P. Microarray technology as a universal tool for high-throughput analysis of biological systems. Comb Chem High Throughput Screen. 2006;9:365–380. doi: 10.2174/138620706777452429. [DOI] [PubMed] [Google Scholar]
- 12.Saeed AI, Sharov V, White J, Li J, Liang W, et al. TM4: a free, open-source system for microarray data management and analysis. Biotechniques. 2003;34:374–378. doi: 10.2144/03342mt01. [DOI] [PubMed] [Google Scholar]
- 13.Kim JH, Kim HY, Lee YS. A novel method using edge detection for signal extraction from cDNA microarray image analysis. Exp Mol Med. 2001;33:83–88. doi: 10.1038/emm.2001.15. [DOI] [PubMed] [Google Scholar]
- 14.Jain AN, Tokuyasu TA, Snijders AM, Segraves R, Albertson DG, et al. Fully automatic quantification of microarray image data. Genome Res. 2002;12:325–332. doi: 10.1101/gr.210902. [DOI] [PMC free article] [PubMed] [Google Scholar]
- 15.Stanley RJ, Gattapulli M, Caldwell CW. Microarray image spot segmentation using the method of projections. Biomed Sci Instrum. 2002;38:387–392. [PubMed] [Google Scholar]
- 16.Jung HY, Cho HG. An automatic block and spot indexing with k-nearest neighbors graph for microarray image analysis. Bioinformatics. 2002;182:141–151. doi: 10.1093/bioinformatics/18.suppl_2.s141. [DOI] [PubMed] [Google Scholar]
- 17.Bozinov D. Autonomous system for Web-based microarray image analysis. IEEE Trans Nanobioscience. 2003;2:215–220. doi: 10.1109/tnb.2003.817021. [DOI] [PubMed] [Google Scholar]
- 18.Katzer M, Kummert F, Sagerer G. Methods for automatic microarray image segmentation. IEEE Trans Nanobioscience. 2003;2:202–214. doi: 10.1109/tnb.2003.817023. [DOI] [PubMed] [Google Scholar]
- 19.Rahnenfuhrer J, Bozinov D. Hybrid clustering for microarray image analysis combining intensity and shape features. BMC Bioinformatics. 2004;5:47. doi: 10.1186/1471-2105-5-47. [DOI] [PMC free article] [PubMed] [Google Scholar]
- 20.Qin L, Rueda L, Ali A, Ngom A. Spot detection and image segmentation in DNA microarray data. Appl Bioinformatics. 2005;4:1–11. doi: 10.2165/00822942-200504010-00001. [DOI] [PubMed] [Google Scholar]
- 21.White AM, Daly DS, Willse AR, Protic M, Chandler DP. Automated Microarray Image Analysis Toolbox for MATLAB. Bioinformatics. 2005;21:3578–3579. doi: 10.1093/bioinformatics/bti576. [DOI] [PubMed] [Google Scholar]
- 22.Deng N, Duan H. An Automatic and Power Spectra-based Rotate Correcting Algorithm for Microarray Image. Conf Proc IEEE Eng Med Biol Soc. 2005;1:898–901. doi: 10.1109/IEMBS.2005.1616560. [DOI] [PubMed] [Google Scholar]
- 23.Cathelin R, Lopez F, Klopp C. AGScan: a pluggable microarray image quantification software based on the ImageJ library. Bioinformatics. 2007;23:247–248. doi: 10.1093/bioinformatics/btl564. [DOI] [PubMed] [Google Scholar]
- 24.Novikov E, Barillot E. Software package for automatic microarray image analysis (MAIA) Bioinformatics. 2007;23:639–640. doi: 10.1093/bioinformatics/btl644. [DOI] [PubMed] [Google Scholar]
- 25.Gupta R, Ruosaari S, Kulathinal S, Hollmen J, Auvinen P. Microarray image segmentation using additional dye--an experimental study. Mol Cell Probes. 2007;21:321–328. doi: 10.1016/j.mcp.2007.03.006. [DOI] [PubMed] [Google Scholar]
- 26.Zacharia E, Maroulis D. An original genetic approach to the fully automatic gridding of microarray images. IEEE Trans Med Imaging. 2008;27:805–813. doi: 10.1109/TMI.2008.915561. [DOI] [PubMed] [Google Scholar]
- 27.Athanasiadis EI, Cavouras DA, Spyridonos PP, Glotsos DT, Kalatzis IK, et al. Complementary DNA microarray image processing based on the fuzzy gaussian mixture model. IEEE Trans Inf Technol Biomed. 2009;13:419–425. doi: 10.1109/TITB.2008.907984. [DOI] [PubMed] [Google Scholar]
- 28.Bariamis D, Maroulis D, Iakovidis DK. Unsupervised SVM-based gridding for DNA microarray images. Comput Med Imaging Graph. 2010;34:418–425. doi: 10.1016/j.compmedimag.2009.09.005. [DOI] [PubMed] [Google Scholar]
- 29.Mendhurwar KA, Kakumani R, Devabhaktuni V. Microarray image segmentation using Chan-Vese active contour model and level set method. Conf Proc IEEE Eng Med Biol Soc. 2009;2009:3629–3632. doi: 10.1109/IEMBS.2009.5333761. [DOI] [PubMed] [Google Scholar]
- 30.Bariamis D, Iakovidis DK, Maroulis D. M3G: maximum margin microarray gridding. BMC Bioinformatics. 2010;11:49. doi: 10.1186/1471-2105-11-49. [DOI] [PMC free article] [PubMed] [Google Scholar]
- 31.Rueda L, Rezaeian I. A fully automatic gridding method for cDNA microarray images. BMC Bioinformatics. 2011;12:113. doi: 10.1186/1471-2105-12-113. [DOI] [PMC free article] [PubMed] [Google Scholar]
- 32.Rasband WS. Image J. Maryland, USA,: U. S. National Institutes of Health, Bethesda; 1997–2011. [Google Scholar]
- 33.Abramoff MD, Magalhaes PJ, Ram SJ. Image Processing with ImageJ. Biophotonics International. 2004;11:36–42. [Google Scholar]


