

Abstract
Multisite longitudinal neuroimaging designs are used to identify differential brain structural change associated with onset or progression of disease. The reliability of neuroanatomical measurements over time and across sites is a crucial aspect of power in such studies. Prior work has found that while within‐site reliabilities of neuroanatomical measurements are excellent, between‐site reliability is generally more modest. Factors that may increase between‐site reliability include standardization of scanner platform and sequence parameters and correction for between‐scanner variations in gradient nonlinearities. Factors that may improve both between‐ and within‐site reliability include use of registration algorithms that account for individual differences in cortical patterning and shape. In this study 8 healthy volunteers were scanned twice on successive days at 8 sites participating in the North American Prodrome Longitudinal Study (NAPLS). All sites employed 3 Tesla scanners and standardized acquisition parameters. Site accounted for 2 to 30% of the total variance in neuroanatomical measurements. However, site‐related variations were trivial (<1%) among sites using the same scanner model and 12‐channel coil or when correcting for between‐scanner differences in gradient nonlinearity and scaling. Adjusting for individual differences in sulcal‐gyral geometries yielded measurements with greater reliabilities than those obtained using an automated approach. Neuroimaging can be performed across multiple sites at the same level of reliability as at a single site, achieving within‐ and between‐site reliabilities of 0.95 or greater for gray matter density in the majority of voxels in the prefrontal and temporal cortical surfaces as well as for the volumes of most subcortical structures. Hum Brain Mapp 35:2424–2434, 2014. © 2013 Wiley Periodicals, Inc.
Keywords: magnetic resonance imaging, neuroanatomy, reproducibility of results, computer‐assisted image processing, cerebral cortex, thalamus, hippocampus, amygdala
INTRODUCTION
Onset of psychosis is thought to involve disturbances in neuromaturational processes during the transition from adolescence to early adulthood and specifically an accelerated rate of synaptic pruning, resulting in decreases in neuronal connectivity [Glausier and Lewis, 2012]. If so, individuals at elevated clinical risk who progress to fully psychotic symptoms may show a steeper rate of cortical gray matter reduction on repeated magnetic resonance imaging (MRI) scans compared with those who do not progress and healthy controls [Sun et al., 2009b]. The ability to demonstrate such an effect depends on the magnitude of change that occurs across the time interval, the reproducibility (test‐retest reliability) of measures of brain structure obtained on MRI, and the sample size. Given conversion rates in the range of 25‐35% among clinical high‐risk (CHR) cases [Cannon et al., 2008], initial sample sizes on the order of several hundred are likely to be required. Such sample sizes are only achievable across multiple sites, which in turn introduces additional nonsubject‐related variation in MRI measurements.
The North American Prodrome Longitudinal Study (NAPLS) is a consortium of eight clinical research centers in the US and Canada with the aim of elucidating predictors and mechanisms of onset of psychosis among youth at clinical risk (putatively “prodromal” patients) [Addington et al, 2007]. Participants are scanned with MRI at baseline, at 12‐ and 24‐month follow‐ups, and at the point of conversion for those who develop fully psychotic symptoms. In prior studies of traveling subjects scanned at multiple sites, the highest reliabilities were achieved when using scanners of the same field strength and comparable pulse sequence parameters [Ewers et al., 2006; Han et al., 2006; Schnack et al., 2004, 2010]. All of the NAPLS sites operate 3 Tesla scanners, and sequence parameters were optimized and standardized according to the Alzheimer's Disease Neuroimaging Initiative (ADNI) protocol [Mueller et al., 2005]. However, in general, between‐site reliability, while adequate, is lower than within‐site reliability, or the reliability one can expect when scanning all subjects on all occasions on a single scanner [Dewey et al., 2010; Nugent et al., 2012; Schnack et al., 2010]. This reduction in between‐site reliability, in turn, potentially mitigates the power advantages afforded by enrolling and scanning subjects at multiple sites.
Given standardization of field strength and acquisition parameters across sites, the major sources of between‐site variation are likely to be related to use of different scanner makes and models, coil configurations, field inhomogeneity and other issues idiosyncratic to individual scanners [Kruggel et al., 2010; Shokouhi et al., 2011]. In addition, when evaluating measures of gray matter density or thickness across the cortical surface, both between‐site and within‐site reliabilities are likely to be higher when using an image registration algorithm that accounts for individual differences in cortical patterning and shape, as compared with automated approaches implemented in commonly used voxel‐based morphometry (VBM) packages [Lebenberg et al., 2010; Qiu et al., 2010].
Here we report the results of a traveling subjects MRI reliability study in which eight healthy subjects were scanned twice on successive days at each of the eight sites participating in NAPLS. The goals were to quantify the between‐ and within‐site reliabilities of measures of brain structure and to determine the conditions under which between‐site reliability approaches the level of within‐site reliability by evaluating variations according to scanner model and brain registration methodologies.
MATERIALS AND METHODS
Subjects and Procedures
The study protocol and consent form was reviewed and approved by the Institutional Review Boards at each of the eight data collection sites (UCLA, Emory, Harvard, Zucker Hillside Hospital, UNC, UCSD, Calgary, Yale). Each of these sites recruited one healthy subject (4 males, 4 females) between the ages of 20 and 31 (mean = 26.9, SD = 4.3), who was scanned twice on successive days at every site, for a total of 128 scans (8 subjects x 2 scans x 8 sites). Scanning was conducted from May 4 through August 9 of 2011. There were no equipment or software changes at any of sites during this period. All subjects completed all of the scans within 2 months. The order of visits to sites was counterbalanced across subjects.
The scanning equipment used at each of the 8 sites is shown in Table 1. Five sites operated Siemens scanners and three sites operated GE scanners, all at 3 Tesla. All Siemens sites used a 12‐channel head coil and all GE sites used an 8‐channel head coil. Sequence parameters were optimized for each scanner manufacturer, software version and coil configuration according to the ADNI protocol (http://adni.loni.ucla.edu/research/protocols/mri-protocols/). At all sites scans were acquired in the sagittal plane with a 1mm x 1mm in‐plane resolution and 1.2 mm slice thickness. Siemens scanners used an MPRAGE sequence with a 256 (axial) x 240 (saggital) x 176 (coronal) mm field of view, TR/TE/TI=2300/2.91/900 ms and a 9 degree flip angle, while GE scanners used an IR‐SPGR sequence (efgre3d_cs) with a 26 cm field of view, TR/TE/TI=7.0/minimum full/400 ms and an 8° flip angle. In addition, the ADNI structural phantom was scanned at each site and processed using the AQUAL2 algorithm [Gunter et al., 2009].
Table 1.
Scanning equipment, phantom‐based performance metrics, and reliability of human neuroanatomical measurements by site
| Feature | Site | |||||||
|---|---|---|---|---|---|---|---|---|
| Equipment | 1 | 2 | 3 | 4 | 5 | 6 | 7 | 8 |
| Scanner modela | TrioTim | TrioTim | TrioTim | TwinSpeed | TrioTim | TwinSpeed | 3T/94 | TrioTim |
| Field | 3T | 3T | 3T | 3T | 3T | 3T | 3T | 3T |
| Version | VB17 | VB17 | VB13 | 14.0M4 | VB17 | 14.0M4 | 12.0_M5A | VA25 |
| Channels | 12 | 12 | 12 | 8 | 12 | 8 | 8 | 12 |
| Phantom metrics | ||||||||
| Positional residuals | 0.058 | 0.034 | 0.035 | 0.225 | 0.032 | 0.235 | 0.223 | 0.024 |
| Scalars | 1.014 | 1.002 | 1.000 | 0.978 | 1.004 | 0.995 | 0.989 | 1.002 |
| Human reliabilityb | ||||||||
| Intracranial | 0.986 | 0.999 | 0.997 | 0.999 | 0.993 | 0.997 | 0.996 | 0.997 |
| Gray matter | 0.975 | 0.988 | 0.951 | 0.976 | 0.970 | 0.994 | 0.966 | 0.997 |
| White matter | 0.989 | 0.996 | 0.966 | 0.976 | 0.992 | 0.979 | 0.964 | 0.994 |
| Cerebrospinal fluid | 0.808 | 0.933 | 0.657 | 0.905 | 0.624 | 0.954 | 0.957 | 0.982 |
| Thalamus | 0.992 | 0.989 | 0.985 | 0.974 | 0.989 | 0.992 | 0.997 | 0.993 |
| Caudate | 0.994 | 0.993 | 0.992 | 0.980 | 0.991 | 0.988 | 0.955 | 0.993 |
| Putamen | 0.976 | 0.973 | 0.973 | 0.982 | 0.995 | 0.983 | 0.923 | 0.985 |
| Pallidum | 0.921 | 0.858 | 0.872 | 0.932 | 0.949 | 0.981 | 0.942 | 0.970 |
| Hippocampus | 0.978 | 0.951 | 0.900 | 0.959 | 0.994 | 0.968 | 0.902 | 0.962 |
| Amygdala | 0.898 | 0.881 | 0.830 | 0.754 | 0.936 | 0.889 | 0.647 | 0.977 |
| Accumbens | 0.962 | 0.943 | 0.940 | 0.925 | 0.960 | 0.827 | 0.985 | 0.947 |
| Brain Stem | 0.972 | 0.977 | 0.986 | 0.959 | 0.987 | 0.915 | 0.955 | 0.995 |
| Nonlinearity Correction | ||||||||
| Mean Jacobianc | 0.426 | 0.441 | 0.465 | 2.002 | 0.783 | 0.304 | 0.817 | 0 |
Sites 1, 2, 3, 5, and 8 operated Siemens scanners; sites 4, 6 and 7 operated GE scanners.
Within‐Site intraclass correlations.
Mean absolute values of Jacobian parameters to register each subjects' scans at each site to their site 8 scans.
Image Processing
Two approaches were used to examine cortical gray matter density on a voxel‐wise basis. The first used the Cortical Pattern Matching (CPM) algorithm [Thompson et al., 2000, 2001], which involves semi‐automated brain extraction and manual sulcal tracing, and the second used the fully automated VBM approach implemented in the FMRIB Software Library (FSL; http://www.fmrib.ox.ac.uk/fsl/fslvbm/).
Cortical Pattern Matching
For each scan, the cerebrum was extracted from the remainder of the head in the image and was divided into left and right hemispheric images. These images were manually modified, keeping cerebral voxels and removing nonbrain tissue voxels. Manual masking of nonbrain pixels requires ∼1 and ½ to 2 h for each scan. BA‐ and MA‐level image analysts were trained to a criterion of 0.99 reliability in masking nonbrain pixels on a training set before processing the images in this study. Automated tissue segmentation was performed on each scan to classify the image into gray matter, white matter, and cerebrospinal fluid [Zhang et al., 2001], from which we computed global volumes for these tissue compartments. The gray matter image was retained for further analysis.
One scan from the UCLA site for each subject was used as a reference to align that subject's scans at other sites using rigid‐body registrations. Tissue‐segmented images were transformed to the space of the reference scans from the same subjects, using their own transformation matrices. By so doing, all images from the same subject were aligned prior to registration to an atlas.
The eight reference images were registered to a standard 3D stereotaxic space [Mazziotta et al., 1995] with 9 degree‐of‐freedom linear transformations [Viviani et al., 2007], and a cortical surface extraction was performed to generate both hemispheric surface models for each of these brains [MacDonald et al., 2000]. On each hemispheric surface, 29 anatomical landmark curves following major sulci and 7 control curves that delineate the lateral and medial surfaces were manually drawn. The tracing protocol is available at http://www.loni.ucla.edu/~esowell/edevel/MedialLinesProtocol.htm. Manual tracing of the sulcal‐gyral patterns requires approximately 1 to 1 and ½ hours for each scan. BA‐ and MA‐level image analysts were trained on a set of six brains until they could trace landmarks with an inter‐ and intrarater 3D rms error no greater than 2 mm everywhere and <1 mm on average.
The hemispheric surfaces and curves were then flattened to a 2D plane, and the average curves were computed across all subjects. The hemispheric surfaces were elastically warped to each other based on matching individual curves to their corresponding average curves, while the coordinate positions of each surface point in their 3D space were preserved. 3D surface models were reconstructed in standard space and were transformed back to each individual scan's native reference space for gray matter density (GMD) sampling. Local GMD was calculated and assigned to each point on the hemispheric surface models. This was done by creating a sphere of 15mm radius around each surface point and calculating the proportion of gray matter volume within the sphere. The resultant GMD maps were transformed to the standard space for statistical analysis.
Voxel‐Based Morphometry
Following the standard steps of the FSL VBM package (version 4.1.4), brain images were extracted from all 128 scans and were subsequently segmented into gray matter, white matter, and CSF images. All gray matter images were registered to an ICBM brain template using non‐linear registration and were averaged to generate a study specific gray matter template. All gray matter images were then non‐linearly registered to the above‐generated study‐specific template to minimize inter‐subject anatomical variation. Gray matter volumetric information was preserved by adjusting image intensity according to the magnitude of local contraction or expansion during registration. The registered gray matter images were smoothed by applying a Gaussian kernel (sigma=3 mm) prior to statistical analysis.
Volumetric Analysis of Subcortical Structures
The FSL First package was used to extract subcortical structures (http://www.fmrib.ox.ac.uk/fsl/first/index.html). Briefly, two‐stage linear registrations were applied to bring the subcortical regions of individual scans into alignment with the MNI 152 template. Next, based on a large training dataset of manually labeled brain images, automated segmentation was performed to segment 15 subcortical structures (i.e, brainstem and left and right thalamus, caudate, putamen, pallidum, hippocampus, amygdala, and accumbens) by integrating shaping modeling into a Bayesian framework. Volumes of subcortical structures were calculated and used for reliability analysis. As there were no differences in reliability estimates by hemisphere, we report the results for subcortical structures collapsed across hemisphere.
Statistical Analysis
The 3dICC_REML.R program from the AFNI package (http://afni.nimh.nih.gov/afni/) was applied to GMD data obtained from the CPM and VBM methods respectively to calculate intra‐class correlations (ICCs) on a voxel‐wise basis. 3dICC_REML.R uses variance components analysis to calculate ICC values based on linear mixed‐effects modeling with restricted maximum likelihood (REML) estimates for crossed designs. For global and subcortical volumetric measures, the ICCs were computed based on the results of the VARCOMP procedure in SAS (http://www.sas.com/). Given that the three factors (subject, site, occasion) were fully crossed, the Total Variance of a dependent variable was partitioned into the variance due to subject, site, occasion, subject‐by‐site, subject‐by‐occasion, site‐by‐occasion, and subject‐by‐site‐by occasion [Friedman et al., 2008]. Two types of ICCs were computed, one of which was the fraction of variance attributable to subject, reflecting reliability across sites and occasions and hence termed the “between‐site” ICC (ICCBW), and the other of which was the fraction of variance attributable to subject and site, reflecting reliability across scan occasions for the same subject at the same site, and hence termed the “within‐site” ICC (ICCWI). The specific formulae used were:
ICCBW=VDSubject / Total Variance
ICCWI=(VDSubject + VDSite + VDSubject by Site)/Total Variance
where “VD” refers to Variance Due To the factor(s) denoted by subscript. This formulation of the within‐site ICC produced results equivalent to the test‐retest ICC averaged across sites.
RESULTS
Voxel‐Based Analyses
Figure 1 shows maps of the between‐site (A) and within‐site (B) ICCs for gray matter density plotted on the lateral and medial cortical surfaces using the CPM algorithm. The between‐site ICCs were excellent (≥0.90) in pre‐ and post‐central sulcus regions and in superior prefrontal and parietal cortices bilaterally. Between‐site reliability was also good (≥0.75) across peri‐sylvian regions, including superior temporal gyrus. Some regions, particularly frontal pole, appear particularly prone to site‐related variations, yielding between‐site ICCs in the 0.30–0.70 range. Comparatively, the within‐site ICCs were excellent (≥0.90) across the majority of voxels, with nearly perfect reliability in superior, middle, and inferior prefrontal regions as well as in temporal and parietal regions.
Figure 1.
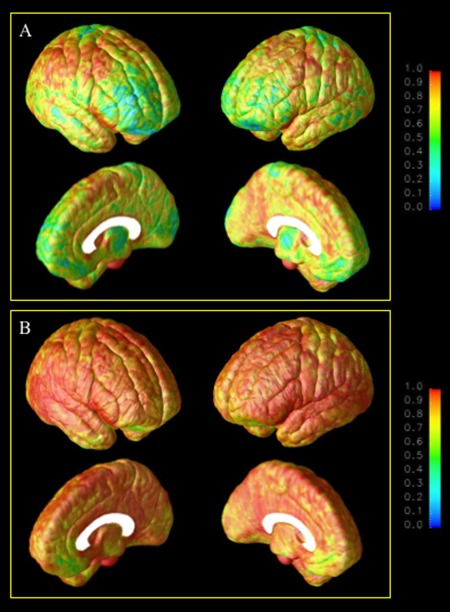
Between‐site (A) and within‐site (B) intraclass correlations for the cortical pattern matching method.
Figure 2 shows maps of the between‐site (A) and within‐site (B) ICCs for gray matter density using the VBM algorithm implemented in FSL. In general, the results paralleled those obtained using CPM in terms of the topography of regions showing relatively better between‐ and within‐site reliabilities. Direct statistical comparisons of the ICC maps obtained by the two methods are not possible due to the intrinsic differences in registration method, tissue included (cortical surface versus whole brain), aspect of gray matter measured (density versus volume), and other factors. To achieve an approximate basis for comparison, ICCs for gray matter volume in voxels corresponding roughly to the cortical surface were sampled from the VBM ICC maps using the HarvardOxford atlas (http://www.cma.mgh.harvard.edu/). Figure 3 shows histograms of the percentages of voxels within various ranges of between‐site (A) and within‐site (B) reliability for the two methods. There is an overall upward shift in within‐site reliability associated with the CPM approach, and over 71% of cortical voxels attain a within‐site reliability of 0.9 or greater using CPM, while only 39% of cortical voxels reach this level of reliability using VBM. The two methods are more comparable in terms of between‐site reliability, with VBM showing higher percentages of voxels with ICCs in the range of 0.90 to 0.99 and CPM showing higher percentages of voxels with ICCs in the ranges of 0.80 to 0.89 and 0.70 to 0.79. On average, ICCs were lower for VBM than for CPM for both within‐site reliability (mean ICCWI=0.84, SD=0.11 for VBM, mean ICCWI=0.91, SD=0.07 for CPM) and between‐site reliability (mean ICCBW=0.72, SD=0.19 for VBM; mean ICCBW=0.75, SD=0.16 for CPM), by margins of 8.3% and 4.2%, respectively.
Figure 2.
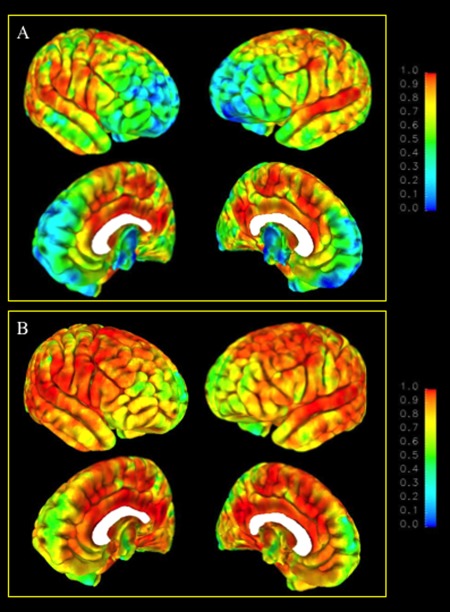
Between‐site (A) and within‐site (B) intraclass correlations for the voxel‐based morphometry method.
Figure 3.
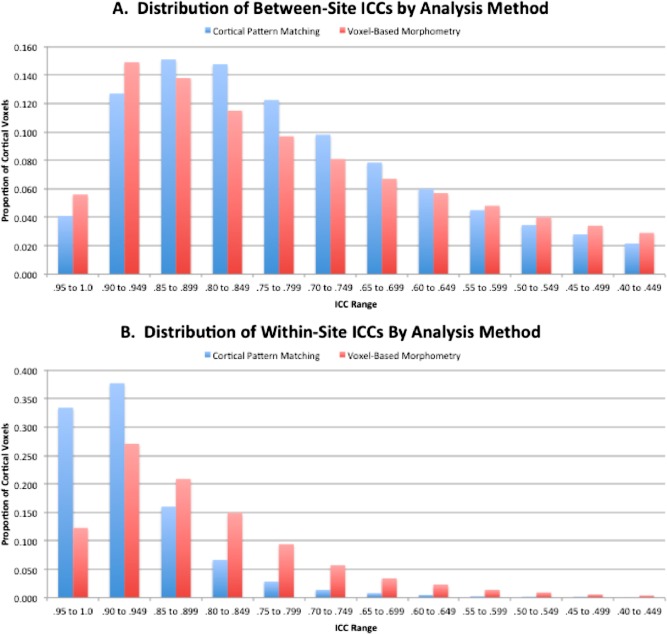
Frequency distributions of between‐site (A) and within‐site (B) intraclass correlations by analysis method.
Global and Subcortical Volumes
Table 2 shows the ICC analyses for global measures of intracranial, gray, white, and CSF volumes (derived from the tissue‐segmented whole‐brain images) as well as for the volumes of the eight subcortical structures derived from the FSL FIRST algorithm. The between‐site ICCs were excellent (0.90–0.96) for intracranial volume and for the volumes of the thalamus, caudate, and brainstem; between‐site reliability was also good (0.75–0.89) for overall gray, white and CSF volumes and the volumes of the putamen, hippocampus, amygdale, and accumbens. The within‐site ICCs were excellent (0.90–0.99) for all volumes except CSF and amygdala, for which within‐site reliability was 0.85 for both. Importantly, while site‐related variations accounted for 3–26% of the variation in global and subcortical volume measures, differences attributable to testing occasion were minimal (<1%).
Table 2.
Intraclass correlation analyses for global and subcortical MRI measures
| Region of interest | Overall | Siemens sites | GE sites | |||
|---|---|---|---|---|---|---|
| ICCBW | ICCWI | ICCBW | ICCWI | ICCBW | ICCWI | |
| ICV | 0.921 | 0.996 | 0.989 | 0.995 | 0.978 | 0.997 |
| Gray Matter | 0.854 | 0.978 | 0.955 | 0.974 | 0.825 | 0.984 |
| White Matter | 0.774 | 0.984 | 0.979 | 0.987 | 0.675 | 0.979 |
| CSF | 0.761 | 0.856 | 0.731 | 0.804 | 0.859 | 0.938 |
| Thalamus | 0.957 | 0.990 | 0.983 | 0.988 | 0.926 | 0.989 |
| Caudate | 0.921 | 0.986 | 0.987 | 0.992 | 0.837 | 0.978 |
| Putamen | 0.807 | 0.975 | 0.979 | 0.981 | 0.582 | 0.972 |
| Pallidum | 0.682 | 0.947 | 0.905 | 0.907 | 0.494 | 0.965 |
| Hippocampus | 0.791 | 0.960 | 0.943 | 0.958 | 0.552 | 0.961 |
| Amygdala | 0.764 | 0.853 | 0.877 | 0.889 | 0.588 | 0.752 |
| Accumbens | 0.876 | 0.937 | 0.915 | 0.950 | 0.822 | 0.921 |
| Brain Stem | 0.929 | 0.971 | 0.971 | 0.983 | 0.838 | 0.950 |
ICV, intracranial volume; CSF, cerebrospinal fluid; GM, Gray matter; ICCBW, between‐site intraclass correlation; ICCWI, within‐site intraclass correlation.
Sources of Site Differences
Additional analyses were conducted to determine whether site‐related variation in gray matter volumes were attributable to differences in field inhomogeneity across scanners. On the basis of analyses of the structural phantom, all scanners performed within an acceptable range in terms of gradient linearity (average standard deviations of positional residuals) and scaling (average over X, Y, and Z). However, both of these parameters differed significantly by scanner manufacturer (t[6] = 24.08, P < 0.0001; t[6] = −3.35, P < 0.015, respectively), with no substantial variation within scanners of each manufacturer. In addition, there were corresponding differences by scanner manufacturer in between‐site reliability for global and subcortical volumes (see Table 2). We then sought to determine whether these differences could be attributed to between‐scanner differences in gradient linearity and scaling. Given that the scanner at site 8 had the lowest degree of gradient nonlinearity based on the phantom scans, each traveling subject's scans at each of the other sites were registered to their corresponding scans at site 8 using a nonlinear warping algorithm. The degree of correction (mean absolute Jacobians) required to register each of the other sites' scans with site 8 was correlated with the phantom metrics for gradient nonlinearity and absolute values of scaling deviations (r = 0.52 and r = 0.79, respectively; see Nonlinearity Correction in Table 1). As can be seen in Figure 4, when the traveling subjects' scans were corrected for between‐scanner variations in gradient nonlinearity and scaling, the between‐site ICC for gray matter volume improved to 0.988 overall, and there was no longer a difference by scanner manufacturer (0.998 for Siemens and 0.987 for GE).
Figure 4.
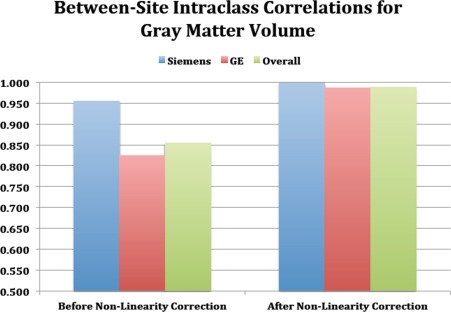
Between‐site intraclass correlations before and after correction for across‐scanner variations in gradient non‐linearities.
Implications for Power
Power analyses were conducted to determine the minimum group sizes needed for 80% power, at α = 0.05, to detect differential rates of change across the range of reliabilities observed for the majority of neuroanatomical measurements in the study (i.e., 0.85–0.99) and across a range of effect sizes. These analyses were based on the observed sample means and standard deviations for gray matter volume, projecting an annualized rate of change of 0.0067 in controls and varying rates of change in cases (0.01, 0.0133, 0.0167, and 0.02). These numbers are within the range detected in studies of prodromal and first‐episode schizophrenia [Sun et al., 2009a, 2009b]. As can be seen in Table 3, the results clearly demonstrate a major impact of differential reliability, even in this restricted range, on power. The results also show favorable power conditions for realistic sample sizes (i.e., 50–150 subjects in each group) across this range of reliability for effect sizes likely to be representative of clinical neuroscience applications.
Table 3.
Sample sizes needed in each group to achieve 80% power at α < 0.05 in detecting differential change in cortical gray matter across varying levels of reliability
| Reliability | Rates of Change/Effect Sizesa | |||
|---|---|---|---|---|
| G1: 0.67% | G1: 0.67% | G1: 0.67% | G1: 0.67% | |
| G2: 1.00% | G2: 1.33% | G2: 1.67% | G2: 2.00% | |
| ES: 0.0321 | ES: 0.0652 | ES: 0.0982 | ES: 0.1313 | |
| 0.99 | 78 | 20 | 10 | 6 |
| 0.98 | 154 | 38 | 18 | 11 |
| 0.97 | 230 | 57 | 26 | 15 |
| 0.96 | 306 | 75 | 34 | 20 |
| 0.95 | 382 | 94 | 42 | 24 |
| 0.94 | 458 | 112 | 50 | 29 |
| 0.93 | 534 | 131 | 58 | 33 |
| 0.92 | 610 | 149 | 66 | 38 |
| 0.91 | 686 | 168 | 75 | 42 |
| 0.90 | 762 | 186 | 83 | 47 |
| 0.89 | 838 | 205 | 91 | 52 |
| 0.88 | 914 | 223 | 99 | 56 |
| 0.87 | 990 | 242 | 107 | 61 |
| 0.86 | 1066 | 260 | 115 | 65 |
| 0.85 | 1142 | 279 | 123 | 70 |
G1, control group; G2, clinical group; ES, effect size; calculated as ((G1T2 – G1T1) – (G2T2 – G2T1)) / SD), where T1 = time 1 and T2 = time 2 means and SD = standard deviation.
DISCUSSION
The results of this study indicate that both local measurements of regional cortical gray matter density as well as global and subcortical neuroanatomical volume measures are highly reproducible across different scanning occasions and different sites. Because of the short inter‐scan interval (1 day), the estimates of within‐site reliability are influenced primarily by differences in head positioning, resulting in differential partial volume effects for segregated tissue compartments. Orientation of the head with respect to the main magnetic field is also a significant determinant of field inhomogeneity induced by susceptibility. Our findings show that the effects of such variations on reliability are negligible (≤1%) for gray matter density in large expanses of the prefrontal, temporal, and parietal cortical surfaces and for the volumes of the thalamus and caudate, and small (2–6%) for most other regions of interest, including global gray and white matter volume and the volumes of the hippocampus, putamen, pallidum, accumbens, and brainstem. The results thus confirm that longitudinal brain MRI is highly reliable and therefore sensitive to detecting change over time within individuals [Han et al., 2006; Morey et al., 2010; Ramirez et al., 2013].
The use of multiple data collection sites was found to introduce a small to moderate amount of error into all neuroantomical measurements. Site‐related variation accounted for ≤12% of the total variation for most measurements, including gray matter density in the majority of voxels in the cortical surfaces, global gray and white matter volume, and the volumes of most subcortical structures. Because we employed scanners at the same field strength (3T) using comparable acquisition parameters, the primary sources of site‐related variation were expected to be differences in field homogeneity and other idiosyncratic aspects of individual scanners [Ewers et al., 2006; Gouttard et al., 2008; Han et al., 2006; Jovicich et al., 2006; Jovicich et al., 2009; Kruggel et al., 2010; Schnack et al., 2004, 2010]. Analyses of the ADNI structural phantom demonstrated differences in gradient nonlinearities and scaling by scanner manufacturer. Scans from GE scanners seem to be particularly vulnerable to B0 and B1 field inhomogeneity artifacts. Differences in image reconstruction software across manufacturers might account, in part, for the observed differences between GE and Siemens scanners. After correcting for these between‐scanner differences, between‐site reliability for gray matter volume improved to the level of within‐site reliability (0.99), and there were no longer differences in between‐site reliability by manufacturer.
Estimates of both between‐site and especially within‐site reliability were higher for measures of cortical gray matter density obtained using the CPM algorithm compared with a commonly used VBM approach. This superior reliability was evident in an overall upward shift in the proportion of voxels in the higher ranges of within‐site ICCs, with correspondingly fewer voxels in the lower ranges of reliability, for CPM compared with VBM. These results indicate that accounting for individual differences in sulcal‐gyral patterning (as in CPM) is required to maximize reliability of both cross‐sectional and longitudinal neuroanatomical measurements [Lebenberg et al., 2010; Qiu et al., 2010] and that when this is done, one can expect within‐site reliability of ≥0.95 in the majority of voxels in the frontal, temporal and parietal cortical surfaces, with reliability ≥0.75 in even the most truculent of regions (e.g., orbitofrontal) associated with the greatest susceptibility artifacts. Nevertheless, the levels of both between‐site and within‐site reliability achieved by VBM are likely to be acceptable for many applications, particularly those focusing on certain subcortical structures such as the thalamus, caudate, accumbens, and brainstem, as well as more circumscribed regions within the superior prefrontal and temporal gyri.
The question of whether these high levels of within‐site and between‐site reliability can be maintained over longer time intervals (months to years) can not be addressed directly with human subjects, for whom some degree of change (e.g., age‐related) would be expected over longer intervals. Despite the fact that such change is “true” in the sense that it occurs naturally and is not due to measurement error, any change over time regardless of source would result in a lower within‐site ICC. In NAPLS we are employing a phantom scanning protocol developed and recommended for longitudinal multisite MRI studies by ADNI [Gunter et al., 2009]. Not only does the regular (in our case, monthly) scanning of the ADNI phantom allow one to track and identify variations in scanner performance, it provides a basis for adjusting the human images for some of the time‐related variations in image parameters affecting tissue segmentation, voxel location and voxel size. In this way, the reliabilities observed in our study of traveling human subjects are likely to be sustainable over the full follow‐up period (2 years) in the core NAPLS study.
Because of the requirement for travel among the 8 sites, it was not possible to include subjects under the age of 18 years in this reliability study. We acknowledge that this practical constraint was not optimal from the perspective of generalizability to the NAPLS clinical study samples, for which the age range is 12‐30. However, other than the possibility of greater motion artifact (something that will be assessed and used in QA for the clinical study), there is little reason to suspect that short‐term reliability of anatomical assessments differs between adolescents and young adults.
In summary, this study has demonstrated high levels of within‐site and between‐site reliability in neuroanatomical measurements obtained by MRI. Use of an image analysis algorithm that accounts for individual differences in sulcal‐gyral geometries yields measurements with substantially greater reliability than those obtained using an automated VBM approach. Nevertheless, within‐site reliabilities of most subcortical structures and of gray matter density in superior cortical regions are excellent regardless of analytic method. Moreover, site‐related variations become trivial when using identical acquisition parameters and scanners of the same manufacturer, field strength, and coil configuration, or when correcting images for between‐scanner differences in gradient nonlinearity and scaling. Longitudinal multisite brain MRI is thus likely to be highly sensitive to detecting differential changes in gray matter over time in individuals who develop psychosis compared with those who do not.
ACKNOWLEDGMENTS
The authors thank the following individuals for assistance with subject scheduling and/or scan acquisition: Angielette Andaya and Jamie Zinberg (UCLA); Richard Juelich (BIDMC‐Harvard); M. Louis Lauzon, J. Stowkowy and C. Marshall (Calgary); Jason Nunag and Daniel Roman (UCSD); Nicole Popp Santamauro and Hedy Sarofin (Yale).
REFERENCES
- Addington J, Cadenhead KS, Cannon TD, Cornblatt B, McGlashan TH, Perkins DO, Seidman LJ, Tsuang M, Walker EF, Woods SW, Heinssen R (2007): North American Prodrome Longitudinal Study: A collaborative multisite approach to prodromal schizophrenia research. Schizophr Bull 33:665–672. [DOI] [PMC free article] [PubMed] [Google Scholar]
- Cannon TD, Cadenhead K, Cornblatt B, Woods SW, Addington J, Walker E, Seidman LJ, Perkins D, Tsuang M, McGlashan T, Heinssen R (2008): Prediction of psychosis in youth at high clinical risk: A multisite longitudinal study in North America. Arch Gen Psychiatry 65:28–37. [DOI] [PMC free article] [PubMed] [Google Scholar]
- Dewey J, Hana G, Russell T, Price J, McCaffrey D, Harezlak J, Sem E, Anyanwu JC, Guttmann CR, Navia B, Cohen R, Tate DF (2010): Reliability and validity of MRI‐based automated volumetry software relative to auto‐assisted manual measurement of subcortical structures in HIV‐infected patients from a multisite study. Neuroimage 51:1334–1344. [DOI] [PMC free article] [PubMed] [Google Scholar]
- Ewers M, Teipel SJ, Dietrich O, Schonberg SO, Jessen F, Heun R, Scheltens P, van de Pol L, Freymann NR, Moeller HJ, Hampel H (2006): Multicenter assessment of reliability of cranial MRI. Neurobiol Aging 27:1051–1059. [DOI] [PubMed] [Google Scholar]
- Friedman L, Stern H, Brown GG, Mathalon DH, Turner J, Glover GH, Gollub RL, Lauriello J, Lim KO, Cannon T, Greve DN, Bockholt HJ, Belger A, Mueller B, Doty MJ, He J, Wells W, Smyth P, Pieper S, Kim S, Kubicki M, Vangel M, Potkin SG (2008): Test‐retest and between‐site reliability in a multicenter fMRI study. Hum Brain Mapp 29:958–972. [DOI] [PMC free article] [PubMed] [Google Scholar]
- Glausier JR, Lewis DA (2012): Dendritic spine pathology in schizophrenia. Neuroscience (Epub ahead of print). [DOI] [PMC free article] [PubMed] [Google Scholar]
- Gouttard S, Styner M, Prastawa M, Piven J, Gerig G (2008): Assessment of reliability of multi‐site neuroimaging via traveling phantom study. Med Image Comput Comput Assist Interv 11:263–270. [DOI] [PMC free article] [PubMed] [Google Scholar]
- Gunter JL, Bernstein MA, Borowski BJ, Ward CP, Britson PJ, Felmlee JP, Schuff N, Weiner M, Jack CR (2009): Measurement of MRI scanner performance with the ADNI phantom. Med Phys 36:2193–2205. [DOI] [PMC free article] [PubMed] [Google Scholar]
- Han X, Jovicich J, Salat D, van der Kouwe A, Quinn B, Czanner S, Busa E, Pacheco J, Albert M, Killiany R, Maguire P, Rosas D, Makris N, Dale A, Dickerson B, Fischl B (2006): Reliability of MRI‐derived measurements of human cerebral cortical thickness: the effects of field strength, scanner upgrade and manufacturer. Neuroimage 32:180–194. [DOI] [PubMed] [Google Scholar]
- Jovicich J, Czanner S, Greve D, Haley E, van der Kouwe A, Gollub R, Kennedy D, Schmitt F, Brown G, Macfall J, Fischl B, Dale A (2006): Reliability in multi‐site structural MRI studies: effects of gradient non‐linearity correction on phantom and human data. Neuroimage 30:436–443. [DOI] [PubMed] [Google Scholar]
- Jovicich J, Czanner S, Han X, Salat D, van der Kouwe A, Quinn B, Pacheco J, Albert M, Killiany R, Blacker D, Maguire P, Rosas D, Makris N, Gollub R, Dale A, Dickerson B.C, Fischl B (2009): MRI‐derived measurements of human subcortical, ventricular and intracranial brain volumes: Reliability effects of scan sessions, acquisition sequences, data analyses, scanner upgrade, scanner vendors and field strengths. Neuroimage 46:177–192. [DOI] [PMC free article] [PubMed] [Google Scholar]
- Kruggel F, Turner J, Muftuler LT (2010): Impact of scanner hardware and imaging protocol on image quality and compartment volume precision in the ADNI cohort. Neuroimage 49:2123–2133. [DOI] [PMC free article] [PubMed] [Google Scholar]
- Lebenberg J, Herard AS, Dubois A, Dauguet J, Frouin V, Dhenain M, Hantraye P, Delzescaux T (2010): Validation of MRI‐based 3D digital atlas registration with histological and autoradiographic volumes: An anatomofunctional transgenic mouse brain imaging study. Neuroimage 51:1037–1046. [DOI] [PubMed] [Google Scholar]
- MacDonald D, Kabani N, Avis D, Evans AC (2000): Automated 3‐D extraction of inner and outer surfaces of cerebral cortex from MRI. Neuroimage 12:340–356. [DOI] [PubMed] [Google Scholar]
- Mazziotta JC, Toga AW, Evans A, Fox P, Lancaster J (1995): A probabilistic atlas of the human brain: Theory and rationale for its development. The International Consortium for Brain Mapping (ICBM). Neuroimage 2:89–101. [DOI] [PubMed] [Google Scholar]
- Morey RA, Selgrade ES, Wagner HR II, Huettel SA, Wang L, McCarthy G (2010): Scan‐rescan reliability of subcortical brain volumes derived from automated segmentation. Hum Brain Mapp 31:1751–1762. [DOI] [PMC free article] [PubMed] [Google Scholar]
- Mueller SG, Weiner MW, Thal LJ, Petersen RC, Jack C, Jagust W, Trojanowski JQ, Toga AW, Beckett L (2005): The Alzheimer's disease neuroimaging initiative. Neuroimaging Clin N Am 15:869–877, xi–xii. [DOI] [PMC free article] [PubMed] [Google Scholar]
- Nugent AC, Luckenbaugh DA, Wood SE, Bogers W, Zarate CA Jr, Drevets WC (2012): Automated subcortical segmentation using FIRST: Test‐retest reliability, interscanner reliability, and comparison to manual segmentation. Hum Brain Mapp (Epub ahead of print). [DOI] [PMC free article] [PubMed] [Google Scholar]
- Qiu A, Brown T, Fischl B, Ma J, Miller MI (2010): Atlas generation for subcortical and ventricular structures with its applications in shape analysis. IEEE Trans Image Process 19:1539–1547. [DOI] [PMC free article] [PubMed] [Google Scholar]
- Ramirez J, Scott CJ, Black SE (2013): A short‐term scan‐rescan reliability test measuring brain tissue and subcortical hyperintensity volumetrics obtained using the lesion explorer structural MRI processing pipeline. Brain Topogr 26:35–38. [DOI] [PubMed] [Google Scholar]
- Schnack HG, van Haren NE, Brouwer RM, van Baal GC, Picchioni M, Weisbrod M, Sauer H, Cannon TD, Huttunen M, Lepage C, Collins DL, Evans A, Murray RM, Kahn RS, Hulshoff Pol HE (2010): Mapping reliability in multicenter MRI: Voxel‐based morphometry and cortical thickness. Hum Brain Mapp 31:1967–1982. [DOI] [PMC free article] [PubMed] [Google Scholar]
- Schnack HG, van Haren NE, Hulshoff Pol HE, Picchioni M, Weisbrod M, Sauer H, Cannon T, Huttunen M, Murray R, Kahn RS (2004): Reliability of brain volumes from multicenter MRI acquisition: A calibration study. Hum Brain Mapp 22:312–320. [DOI] [PMC free article] [PubMed] [Google Scholar]
- Shokouhi M, Barnes A, Suckling J, Moorhead TW, Brennan D, Job D, Lymer K, Dazzan P, Reis Marques T, Mackay C, McKie S, Williams SC, Lawrie SM, Deakin B, Williams SR, Condon B (2011): Assessment of the impact of the scanner‐related factors on brain morphometry analysis with Brainvisa. BMC Med Imaging 11:23. [DOI] [PMC free article] [PubMed] [Google Scholar]
- Sun D, Phillips L, Velakoulis D, Yung A, McGorry PD, Wood SJ, van Erp TG, Thompson PM, Toga AW, Cannon TD, Pantelis C (2009a): Progressive brain structural changes mapped as psychosis develops in ‘at risk’ individuals. Schizophr Res 108:85–92. [DOI] [PMC free article] [PubMed] [Google Scholar]
- Sun D, Stuart GW, Jenkinson M, Wood SJ, McGorry PD, Velakoulis D, van Erp TG, Thompson PM, Toga AW, Smith DJ, Cannon TD, Pantelis C (2009b): Brain surface contraction mapped in first‐episode schizophrenia: A longitudinal magnetic resonance imaging study. Mol Psychiatry 14:976–986. [DOI] [PMC free article] [PubMed] [Google Scholar]
- Thompson PM, Mega MS, Vidal C, Rapoport JL, Toga AW (2001): Detecting disease‐specific patterns of brain structure using cortical pattern matching and a population‐based probabilistic brain atlas. Inf Process Med Imaging 2082:488–501. [DOI] [PMC free article] [PubMed] [Google Scholar]
- Thompson PM, Woods RP, Mega MS, Toga AW (2000): Mathematical/computational challenges in creating deformable and probabilistic atlases of the human brain. Hum Brain Mapp 9:81–92. [DOI] [PMC free article] [PubMed] [Google Scholar]
- Viviani R, Beschoner P, Ehrhard K, Schmitz B, Thone J (2007): Non‐normality and transformations of random fields, with an application to voxel‐based morphometry. Neuroimage 35:121–130. [DOI] [PubMed] [Google Scholar]
- Zhang Y, Brady M, Smith S (2001): Segmentation of brain MR images through a hidden Markov random field model and the expectation‐maximization algorithm. IEEE Trans Med Imaging 20:45–57. [DOI] [PubMed] [Google Scholar]