Abstract
The combination of genetically encoded fluorescent proteins and three-dimensional imaging enables cell-type-specific studies of embryogenesis. Light sheet microscopy, in which fluorescence excitation is provided by a plane of laser light, is an appealing approach to live imaging due to its high speed and efficient use of photons. While the advantages of rapid imaging are apparent from recent work, the importance of low light levels to studies of development is not well established. We examine the zebrafish opercle, a craniofacial bone that exhibits pronounced shape changes at early developmental stages, using both spinning disk confocal and light sheet microscopies of fluorescent osteoblast cells. We find normal and aberrant opercle morphologies for specimens imaged with short time intervals using light sheet and spinning disk confocal microscopies, respectively, under equivalent exposure conditions over developmentally-relevant time scales. Quantification of shapes reveals that the differently imaged specimens travel along distinct trajectories in morphological space.
(A) Schematic: Light sheet microscopy of zebrafish embryos. Opercle-forming osteoblasts following twenty-four hours of (B) light sheet imaging, showing normal growth, and (C) spinning disk confocal imaging, showing aberrant growth.
Keywords: phototoxicity, light sheet microscopy, SPIM, Zebrafish, embryogenesis, spinning disk confocal microscopy
1. Introduction
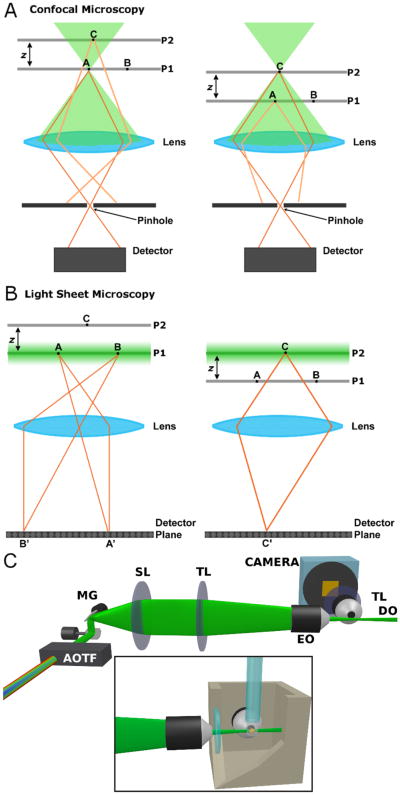
Fluorescence imaging of embryonic development makes possible a wide array of studies examining the morphogenesis of tissues, organs, and whole animals [1, 2]. Confocal microscopy, in which spatial localization is obtained by physically blocking light emitted by points outside a small focal volume from reaching a detector, provides the most common approach to four-dimensional (4D) imaging. While effective, confocal microscopy in all its forms is intrinsically inefficient in its use of light. Large volumes outside the focus are illuminated, and hence subject to photodamage, without providing information on specimen structure (Figure 1A). Recently, a new approach to microscopy has been developed that enables 4D imaging at high speeds with low light levels. Known as selective plane illumination microscopy (SPIM) [3], digital scanned light sheet microscopy (DSLM) [4], and other equivalent names [5], the method involves illumination of a specimen with a thin plane of light and widefield detection of fluorescence emission using a lens oriented perpendicular to the plane (Figure 1B) [4–8]. The sectioned plane is imaged at once, without scanning, onto a camera, and a three-dimensional image is formed by translating the specimen relative to the sheet in the dimension perpendicular to the plane. Several recent studies have demonstrated the utility of this technique. For example: Keller et al. showed that light sheet imaging provides the speed and resolution necessary to track nearly every cell in a developing zebrafish embryo over 24 hours, with a complete three-dimensional image captured every 90 seconds [4]. Stainier and co-workers used plane illumination to image heart valve morphogenesis [9] and to visualize optogenetically controlled cardiac pacemakers [10]. Swoger et al. demonstrated the ability to trace cell lineages over tens of hours [11].
Figure 1.
(online color at: www.biophotonics-journal.org) Schematic illustrations. (A) The geometry of confocal microscopy. As point A in plane P1 is imaged, non-imaged point C in plane P2 is subject to illumination, while its emission is blocked by the confocal pinhole. The converse occurs during the imaging of point C. (B) The geometry of light sheet microscopy. The plane of excitation light is coincident with the focal plane of the imaging objective, allowing a correspondence between illuminated and imaged points. (C) Schematic illustration of our light sheet microscope setup. Abbreviations: AOTF, acousto-optic tunable filter; MG, mirror galvanometer; SL, scan lens; TL, tube lens; EO, excitation objective lens; DO, detection objective lens. Inset: Schematic illustration of our specimen holder, in which the EO axis, DO axis, and capillary tube are all mutually perpendicular. The specimen is embedded in agarose gel and held by a glass capillary from above.
The light sheet geometry enables a one-to-one correspondence between points in the specimen that are illuminated and points that are imaged (Figure 1B). While it has been previously shown that this efficient use of light leads to orders-of-magnitude less photobleaching than confocal or multiphoton microscopies [4], it is not well established whether SPIM significantly minimizes morphological abnormalities in developing animals. In other cell-biological contexts it is increasingly realized that photodamage can significantly alter cellular function even in the absence of obvious readouts such as photobleaching [12]. We suggest that this lesson applies to developmental processes in animals as well, and that light sheet microscopy provides a much-needed route to less-perturbative imaging of embryos.
We examined the issue of phototoxicity affecting development by studying skeletal morphogenesis in zebrafish (Danio rerio) embryos. The mechanisms by which bones develop into stereotypical shapes remain poorly understood, due in large part to the difficulty of imaging bone growth over developmentally relevant times with sufficient temporal resolution to visualize cellular processes and with identification of particular cell types [13]. Moreover, our past experience has shown that due to the slow rate of growth of the skeleton, capturing the morphogenesis of bone on a cellular level without phototoxic side effects is challenging.
As a specific skeletal target for studying bone development, we investigated in zebrafish the early development of cells generating the opercle, a cranofacial bone that forms part of the gill covering and that undergoes considerable shape changes during the first few days post-fertilization (dpf) [14–16]. The opercle begins to develop around 2.5 dpf, initially as an elongating “spur” (Figure 2A). Between 72 and 96 hours post-fertilization (hpf), the opercle widens at its posterior end, forming a fan-like shape, as illustrated in Figure 2A. To track opercle development and the behavior of osteoblasts, the cells that make bone, we studied a transgenic zebrafish line containing an insertion of the enhanced green fluorescent protein (EGFP) gene downstream of the regulatory regions of the osteoblast-specific zinc finger transcription factor sp7[13]. The time interval between three-dimensional snapshots of opercle-forming osteoblasts determines the developmental processes that can be probed. Twenty minute intervals, for example, can provide information about modes of large-scale shape formation such as elongation and widening, but finer temporal sampling is necessary to resolve cellular behaviors such as recruitment, migration, and rearrangement.
Figure 2.
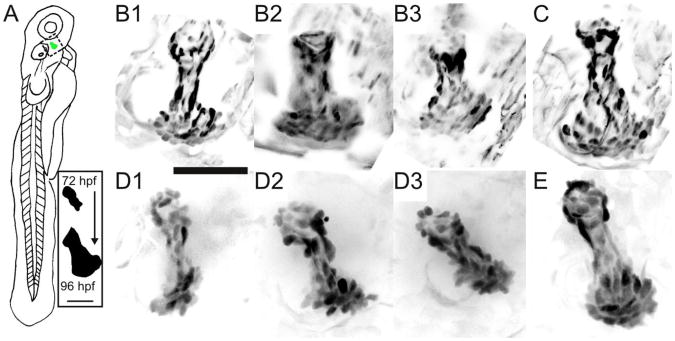
(A) Schematic of a 3 dpf zebrafish; the dashed box outlines the developing opercle. Inset: the characteristic opercle shape at 72 and 96 hpf. Scale bar: 50 microns. (B–E) Maximum intensity projections of 3D fluorescence images of EGFP-expressing osteoblast cells at 96 hpf. Image intensities have been inverted for clarity. The posterior end of each opercle points towards the bottom of the panel. B1–3 and D1–3 show three different specimens each imaged once every ten minutes for the preceding 24 hrs with light sheet and confocal microscopies, respectively. Panels C and E show control specimens for light sheet (C) and confocal (E) data sets, imaged only at 96 hpf. Scale bar: 50 microns.
We found normal opercle development for specimens subjected to spinning disk confocal imaging over the 24 hours beginning at 72 hpf with twenty minute intervals between three-dimensional images, but highly abnormal shapes when ten minute intervals were used, indicating significant phototoxicity. In contrast, light sheet imaging with ten minute intervals and the same light exposure per imaged point as the spinning disk experiments consistently yielded opercle morphology identical to that of non-imaged controls. Quantifying opercle shape at each time point, we found that opercles subject to short-interval confocal imaging grow continuously in length but fail to initiate widening perpendicular to their long axis, an important developmental step which is evident in light-sheet-imaged specimens. These data, as well as the results of imaging opercles using still shorter intervals, are presented below. We also discuss the imaging of the symplectic cartilage, a different craniofacial structure that shows less sensitivity to photodamage. Our findings suggest that SPIM offers the potential for studing slow-growing organs such as bones with the high temporal density necessary to examine cell-level processes.
2. Experimental
2.1 Transgenic zebrafish
The creation and characterization of the Tg(sp7: EGFP)b1212 transgenic line, which allows detection of EGFP-labeled osteoblasts in developing zebrafish, is described in detail in Ref. [13]. The sox9azc81Tg transgenic line, which expresses EGFP in cartilage cells, is noted in Ref. [17]. Larvae were anesthetized with 80 μg/ml clove oil in embryo medium and mounted for imaging in 0.5% agarose gel. The University of Oregon Institutional Animal Care and Use Committee approved all work with vertebrate animals.
2.2 Confocal microscopy
Confocal images were obtained on a commercial spinning-disk confocal microscope (Leica SD6000 with a Yokogawa CSU-X1 spinning disk). We examined specimens over a depth of 50 microns with a 1 micron spacing between optical slices, capturing images with an EMCCD camera (Hamamatsu imageEM) with 100 ms exposure time.
The total time required per three-dimensional image using spinning disk confocal microscopy is approximately 20 seconds, which includes both the image acquisition time and the time needed to move between specimens.
2.3 Light sheet microscopy
Light sheet imaging was performed on a custom built apparatus similar in design to that of Ref. [4], described in detail in [18] and illustrated in Figure 1B, C. Images were captured using a scientific CMOS camera (Cooke pco.edge), using custom software written by us in MATLAB. The excitation light was provided by an Argon/Krypton ion laser (Melles Griot 35 LTL 835) with a maximum power of 10 mW at 488 nm. Light sheet microscopy images were deconvolved using commercially available software (Huygens, Scientific Volume Imaging); the utility of exploiting the high contrast and dynamic range of light sheet imaging using deconvolution methods has been noted previously [19].
The total time required per three-dimensional image using light sheet microscopy is approximately 14 seconds, which includes both the few-second image acquisition time and the time needed to move between specimens. In all experiments, we imaged in sequence six larval zebrafish in order to obtain the necessary throughput for adequate statistics, and also to account for the non-negligible chance of mortality exhibited by larval zebrafish. The minimum possible interval between imaging times is therefore 6 × 14 = 84 seconds, or 1.4 minutes. Imaging at this instrument-limited rapid rate requires not saving complete image data, in order to avoid the additional requirements of hard-drive writing time. For the 1.4 minute interval data presented here, only maximum intensity projections were saved during imaging.
2.4 Equivalence of exposure energies
To compare the effects of spinning disk confocal and light sheet microscopies under equivalent imaging conditions, we designed our experiments such that the amount of optical energy received by any point as it is imaged is equal for the two setups.
For the confocal microscope, we measured the total excitation laser power to be 1.0 mW at the location of the objective lens. At 40× magnification, the field of view spans an area of A = 3.0 × 10⁻⁸ m2 in the focal plane. The spinning disk unit, consisting of rotating disks of pinholes and microlenses [20], has an overall transmission factor T ≈ 60% [21]. The power density is therefore PT/A ≈ 3 × 10⁴ W/m2, where PT = 1.0 mW is the measured transmitted power. Integrated over the 100 ms camera exposure time, the received energy density at each imaged point during the capture of a single two-dimensional optical slice is ε = 3 kJ/m2. As illustrated in Figure 1A, each point within the three-dimensional volume also receives excitation light during the exposure of adjacent image planes. For example, during the imaging of point A in Figure 1A, the intensity at point C is lower by a factor proportional to the cross-sectional area of the cone of excitation light and therefore proportional to z2, where z is the distance between planes P1 and P2. This reduction is countered, however, by the fact that point C also receives excitation light during the imaging of point B, as well as all other points in P1 within an area equal to that previously mentioned. Because of this, every point in the scanned volume receives as much energy during every two-dimensional image acquisition as it does during the imaging of its own plane. The total energy delivered to each point in the imaged volume is therefore higher by a factor equal to the total number of optical sections obtained during the scan. For the imaging performed during this study, this equates to approximately 150 kJ/m2 per point in the total imaged volume, 50 times larger than the 3 kJ/m2 exposure energy experienced by each point while it provides image information.
We operated the light sheet microscope with the total power measured at the illumination objective to be 0.4 mW. The focused laser beam has a thickness of ≈10 μm in the field of view. Rapid scanning of the laser produced a 400 μm wide sheet, corresponding to a power density 1 × 10⁵ W/m2. When integrated over a 30 ms camera exposure time, this gives each imaged point an energy density ε = 3 kJ/m2, approximately equal to that of the spinning disk confocal experiments as described above. As illustrated in Figure 1B, any additional exposure during the imaging of other optical slices is intrinsically lower than that of confocal imaging. Moreover, even though the excitation of adjacent planes due to the finite sheet thickness is nonzero, the fluorescence emission it generates will be detected, not blocked, and hence can contribute to image formation via deconvolution.
2.5 Morphological analysis
In order to analyze the changing morphology of the opercle, we segmented [22] three-dimensional image stacks using custom software written by us in MATLAB, determining the pixels corresponding to the osteoblasts and to background. Since the fluorescence intensity of opercle-forming osteoblasts was considerably brighter than the background, we segmented the opercle using a user-adjusted global threshold and then manually removed the few falsely segmented regions. A small number of data sets during which the specimen twitched were omitted from the analysis.
In order to characterize the key morphological feature of normal opercle growth, namely the fanning out of the opercle at its end, we measured the perimeter of cross-sections of the opercle perpendicular to its length. From the segmented volume, we computed the first principal axis of the opercle, i.e. the vector for which the root-mean squared distance from points in the segmented volume to points on the vector is minimized, which robustly identifies the long axis of the opercle (Figure 4A). At any point along the long axis, we find the set of points in the segmented volume that lie in the perpendicular plane. We define the perimeter as the arc length of the convex hull of this set of points, and evaluate this perimeter at micron-spaced positions along the long axis. In order to reduce the effects of small cellular protrusions on the perimeter measurement we averaged our measurement with a sliding 20 micron window along the long axis. As a dimensionless measure of the “fanning” of the opercle we consider the ratio of the widest to the narrowest perimeter (Figure 4B), discussed further in Results. In addition, we record the length of the opercle, identified as the distance between the points at which the principal axis intersects the beginning and end of the segmented volume of the opercle. Using the procedure outlined above we are able to measure gross three-dimensional morphological features of the developing opercle efficiently and without potentially biased manual assessment.
Figure 4.
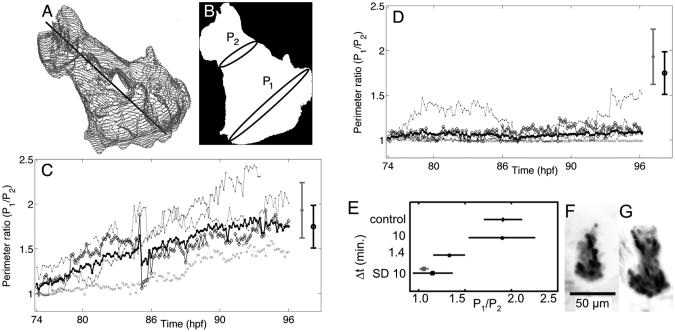
(A) Surface mesh of a representative opercle, identified by computational image segmentation. The black line is the principal axis of the segmented volume. (B) Schematic showing possible widest, P1, and narrowest, P2, perimeters of the segmented opercle. (C) Perimeter ratio for 74–96 hpf for opercles imaged on the light sheet microscope with 10 minute intervals between data sets (N = 4). (D) Perimeter ratio for 74–96 hpf for opercles imaged on the spinning disk confocal microscope with 10 minute intervals between data sets (N = 5). The grey and black data points at the right of panels C and D show the mean and standard deviation for opercles of control fish imaged only at 98 hpf that were (black, N = 10) and were not (gray, N = 12) anesthetized between 74–96 hpf. (E) Comparison of the final (96 hpf) perimeter ratio for different imaging intervals (Δt). Values are plotted for light sheet microscopy data obtained with Δt = 10 minutes (as in (C)) and 1.4 minutes (N = 6). Data from spinning disk confocal microscopy (SD) with Δt = 10 minutes are from the specimens plotted in (D), with all five data points indicated in black, and the set excluding the morphologically aberrant outlier discussed in the text indicated in gray. Control data are from anesthetized, non-imaged specimens as shown in (C, D). (F, G) Maximum intensity projections for two opercles imaged with light sheet microscopy using 1.4 minute intervals, showing the range of fan-like morphology observed.
3. Results and discussion
We found that opercle growth progressed normally in size and shape, with the fan-like expansion at the ventral end described above and illustrated in Figure 2A[14, 15], when specimens were subjected to light sheet imaging over the 24 hours from 72 to 96 hpf with 10 minute intervals separating the acquisition of three-dimensional images. In contrast, opercles imaged using a spinning disk confocal microscope with the same energy density per imaged point (see Experimental Methods) consistently showed opercle growth lacking a fan-like expansion. In Figure 2B, D we show maximum intensity projections of opercle-forming sp7-expressing osteoblast cells at 96 hpf for representative fish imaged using the light sheet (Figure 2 Panel B1-3) and the confocal microscope (Figure 2 Panel D1-3). Two representative control fish that were not anaesthetized and that were only imaged at 96 hpf are shown Figure 2C and E.
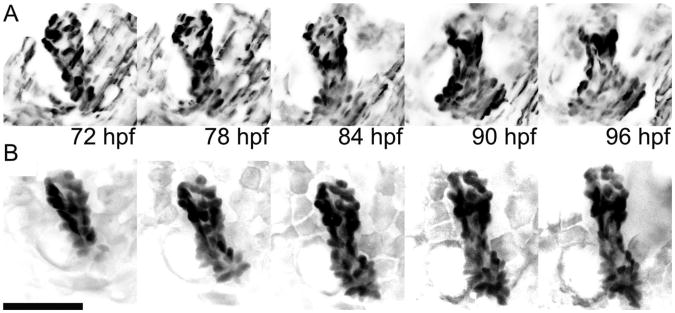
Images from the course of the experimental time lapse illuminate differences in morphology. In Figure 3 we show a maximum intensity projection of opercle-forming osteoblasts at different time points for fish imaged with the light sheet (Figure 3A) and the spinning disk confocal (Figure 3B) microscopes. At 72 hpf both opercles are rod-like in shape. Over the next 24 hours the tip of the opercle imaged on the light sheet microscope begins to fan out as well as lengthen. In contrast, the opercle imaged on the spinning disk confocal microscope lengthens but does not fan out; rather, it remains relatively rodlike in shape over the entire time-lapse. Movies of the 24-hour data sets are provided as Supporting Information.
Figure 3.
Maximum intensity projections of three dimensional scans of EGFP-expressing osteoblast cells in a developing opercle, as imaged with light sheet (A) and confocal (B) microscopy using equivalent exposure conditions. Image intensities have been inverted for clarity. One three-dimensional data set was acquired every ten minutes over the course of twenty-four hours; the images shown are separated by six hour intervals. The scale bar length is 50 microns.
The fish examined in this study were not raised beyond 3 dpf. Our prior experience with opercle imaging suggests that fanning morphogenesis does not resume or recover later in development; there is no sign of normal shape into the second week of development if the opercle undergoes photodamage at 2–3 dpf.
In order to quantify differences in fanning behavior between experimental conditions, we segmented the entire time series for all imaged fish to identify the voxels corresponding to the opercle (see Experimental Methods). In the stereotyped normal growth of the opercle an initially rod-like collection of cells transforms into a fan-like shape. As a result, for normally growing opercles the ratio of the widest part of the opercle to the narrowest part should increase over time. Using our images, we determined the perimeter of cross-sections perpendicular to the long axis of the opercle, and calculated the ratio of the largest to the smallest perimeter (P1/P2) (Figure 4A, B).
In Figure 4C and D we plot this perimeter ratio (P1/P2) for fish imaged using the light sheet and confocal microscope, respectively. In both panels the thick black line shows the average perimeter ratio over all samples, while the lighter gray lines are the perimeter ratios for each individual opercle. Over the course of the time lapse the perimeter ratio of fish imaged on the light sheet microscope increases and at 96 hpf is similar to that of the control (nonimaged) fish. In contrast, the perimeter ratio for opercles imaged with confocal microscopy remains, for the most part, close to one, consistent with a shape that remains rod-like over time. There was, however, one fish imaged on the confocal microscope that had an increasing width ratio over the course of the time-lapse. This fish, shown in Figure 2D Panel 1, had a different development defect in which the opercle was no longer symmetrical.
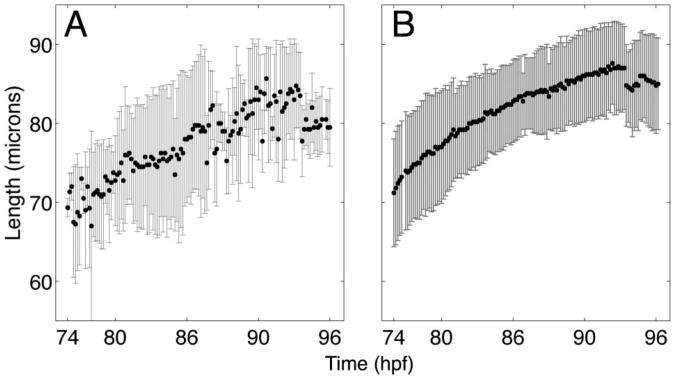
While the difference in perimeter ratio between the two imaging setups is stark, other morphological features of the opercle remain normal. In Figure 5 we show the average length of opercles over the entire imaging period. The length increases similarly for fish imaged using the spinning disk confocal and the light sheet microscope. The greater scatter of data points in the light-sheet-derived lengths is likely due to the fan-like lateral expansion of the opercle, which complicates the computational identification of the long (principal) shape axis.
Figure 5.
(A) Mean and standard deviation of opercle lengths imaged on the (A) light sheet microscope and (B) spinning disk confocal microscope from 74–96 hpf.
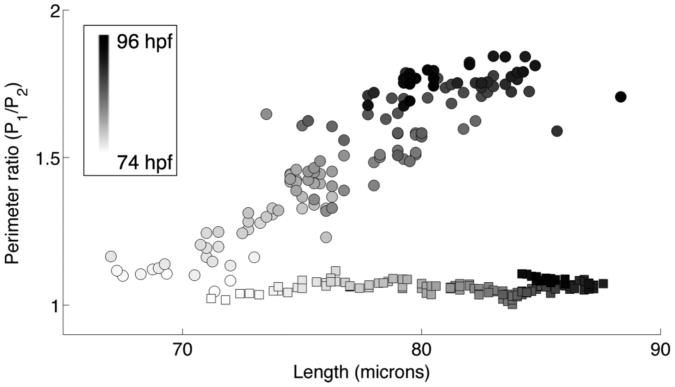
The similar lengthening and dissimilar widening of opercles imaged with spinning disk confocal and light sheet microscopies imply that the photodamaged opercles follow different trajectories in the space of possible forms than do normal opercles. This is illustrated in Figure 6, in which the perimeter ratio and length data of Figures 4 and 5 are plotted versus each other.
Figure 6.
Mean perimeter ratio vs. mean length for opercles imaged on the light sheet microscope (circles) and the spinning disk confocal microscope (squares). The gray level of the data point indicates the time.
In Supplementary Figure 1 we show the average fluorescence intensity for all imaged fish over the course of the time-lapse for the two microscope setups, normalized by its value for the first three hours of the experiment. We calculate the intensity as the total pixel intensity in the segmented opercle divided by the volume of the opercle. We find moderate photobleaching for fish imaged using confocal microscopy, with a dimming of about 20% over 24 hours, and no appreciable bleaching for specimens imaged using light sheet microscopy.
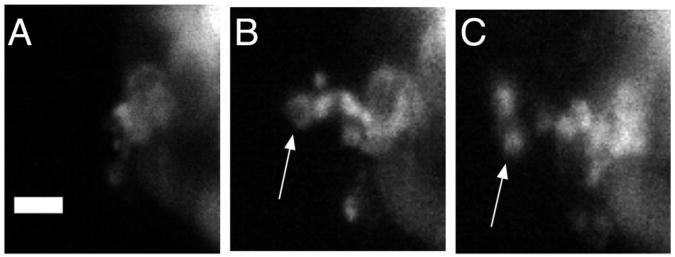
While at short (10 minute) time intervals opercle growth is clearly abnormal when imaged using the confocal microscope, if the scan interval is increased by a factor of 2, to 20 minutes, the perimeter ratio increases as expected and the opercles appear morphologically normal (Supplementary Figure 2 and Supplementary Video 3). Since one can capture stereotyped opercle growth with this larger time interval, and successfully perform a wide range of studies of skeletal development, one may reasonably ask if there are features of bone growth that can only be captured if the imaging is done at the shorter time intervals, such as the 10 minute intervals used for the data presented above. In Figure 7 we show cellular extensions in an sp7-expressing osteoblast at the opercle edge, demonstrating projections that change dramatically in size and shape within 10 minutes. Several such protrusions were observed. While we do not speculate on the importance of these protrusions in the development of the opercle, we note that cellular motions and interactions of cells with their neighbors are generally important for multicellular organization. The higher frame rate and lower photodamage of light sheet microscopy makes it possible to capture potentially salient biological processes at very short time scales for extended periods of time.
Figure 7.
Extensions of osteoblast cells, indicated by arrows. The time step between panels is 10 minutes. Scale bar: 5 microns.
Conversely, while 10 minute intervals give normal opercle growth under light sheet microscopy, we can ask if this would still be the case with less time between three-dimensional images. With 1.4 minute intervals, all specimens examined show fan-like posterior widening of the opercle that is smaller in magnitude than that seen in control specimens, but that is greater than that of 10-minute-interval confocalimaged specimens (Figure 4E). While in principle shorter intervals are possible to examine, technical limitations prohibit our exploration of them (see Experimental Methods).
It is important to note that phototoxicity in general may be highly tissue and cell-type specific. We illustrate this by examining the symplectic cartilage, another craniofacial structure that begins to form at a similar time as the opercle, elongating via intercalation of chondrocytes between 55 and 72 hpf [23]. The transgenic sox9azc81Tg expresses EGFP in cartilage cells [17], allowing visualization of symplectic formation using the same fluorescent protein as employed in the above sp7 : EGFP osteoblast imaging. In contrast to the developing opercle, we do not find obvious signatures of photodamage in the developing symplectic, under the same exposure conditions. In spinning disk confocal as well as light sheet studies in which three-dimensional images are obtained at 10 minute intervals for 24 hours with the same setups as described above, we see normal growth of a column of cells (Supplementary Figure 3 and Supplementary Videos 4 and 5). Interestingly, the normal symplectic growth during this period involves a steady one-dimensional extension. In photodamaged opercles, we found that lengthening along the long axis is not affected by photodamage, but the activation of growth perpendicular to the long axis is inhibited in photodamaged specimens. One may speculate that the lack of obvious photodamage in symplectic growth is related to an absence of particular developmental programs that must be activated during the time span of interest, though we stress that the molecular mechanisms driving these differences are unknown.
4. Conclusion
In the past few years light sheet microscopy has emerged as a promising technique for three-dimensional fluorescence imaging due to its high speed and low light exposure, both of which are consequences of the geometry of sheet excitation and perpendicular detection (Figure 1B). Though the advantages of rapid imaging have been well illustrated in recent work (e.g. Refs. [4, 7]), the utility of low light levels is less apparent. Using an example from skeletal morphogenesis, in which overall shape and form develop over the course of many hours but cellular dynamics can occur at much shorter timescales, we have shown that with short exposure intervals confocal imaging can result in abnormal growth, while light sheet imaging using the same dosage of light at each imaged point allows normal morphogenesis. Notably, the phototoxicity observed during confocal imaging manifests itself as distinct trajectory through morphological space (Figure 6) – reflecting the lack of the widening of the opercle at the posterior end – and not simply as a slowing or delay of normal structure formation. The consequences of phototoxicity, therefore, may in general be difficult to predict, highlighting the importance of low-light-level techniques for studies of animal development. This is likely to be especially important for even higher temporal densities of data as will arise, for example, from studies mapping correlations between individual cellular dynamics and the overall development of form.
Supplementary Material
Supplementary Figure 1: Normalized fluorescence intensity for fish imaged on the spinning disk confocal (grey crosses) and light sheet (black circles) microscopes. One of the light sheet imaged fish showed a considerable increase in brightness at around 86 hpf, causing the step evident in the plotted specimen-averaged data.
Supplementary Figure 2: Perimeter ratio for opercles imaged at 20 minute time intervals using the spinning disk confocal microscope (average, N = 4).
Supplementary Figure 3: Maximum intensity projections of three dimensional scans of sox9azc81Tg:EGFP showing cartilage including the symplectic cartilage (arrows), imaged using spinning disk confocal (A) and light sheet (B) microscopy with equivalent exposure conditions. One three-dimensional data set was acquired every ten minutes over the course of twenty-four hours; the images shown are from the final time point, at 72 hpf. The scale bar length is 20 microns.
Supplementary Video 1: Maximum intensity projections of three dimensional scans of EGFP-expressing osteoblast cells in a developing opercle, from the same specimen shown in Figure 3A, imaged using light sheet microscopy. One three-dimensional image was acquired every ten minutes; the full data set and movie span twenty-four hours. Scale bar: 20 microns.
Supplementary Video 2: Maximum intensity projections of three dimensional scans of EGFP-expressing osteoblast cells in a developing opercle, from the same specimen shown in Figure 3B, imaged using spinning disk confocal microscopy. One three-dimensional image was acquired every ten minutes; the full data set and movie span twenty-four hours. Scale bar: 20 microns.
Supplementary Video 3: Maximum intensity projections of three dimensional scans of EGFP-expressing osteoblast cells in a developing opercle imaged using spinning disk confocal microscopy, as in Supplementary Video 1, but with one three-dimensional image acquired every twenty minutes; the full data set and movie span twenty-four hours. Scale bar: 20 microns.
Supplementary Video 4: Maximum intensity projections of three dimensional scans of a sox9azc81Tg:EGFP zebrafish, imaged using light sheet fluorescence microscopy. The growth of the symplectic cartilage (see Supplementary Figure 3) is evident. One three-dimensional data set was acquired every ten minutes over the course of twenty-four hours. The scale bar length is 20 microns
Supplementary Video 5: A single three dimensional image of a 72 hpf sox9azc81Tg:EGFP zebrafish, imaged using light sheet fluorescence microscopy. The video shows a scan along the dimension perpendicular to the sheet. Each two-dimensional frame is separated in depth by 1 micron. The scale bar length is 20 microns.
Acknowledgments
We thank John Dowd and the University of Oregon Fish Facility for the care and maintenance of fish and Braden Larsen for useful discussions. We acknowledge support from the National Science Foundation (award 0922951 to R.P. and award DGE-072540 to M.J.T.), the Office of Naval Research through the Oregon Nanoscience and Microtechnologies Institute, and the National Institutes of Health NIH (grants HD022486 to C.B.K., DE013834 to C.B.K., and IF32DE019345 to A.D.).
Footnotes
Supporting information for this article is available free of charge under http://dx.doi.org/10.1002/jbio.201200144
Author biographies Please see Supporting Information online.
References
- 1.Canaria CA, Lansford R. Cell Mol Life Sci. 2010;67:3489–3497. doi: 10.1007/s00018-010-0440-5. [DOI] [PMC free article] [PubMed] [Google Scholar]
- 2.Megason SG, Fraser SE. Mech Dev. 2003;120:1407–1420. doi: 10.1016/j.mod.2003.07.005. [DOI] [PubMed] [Google Scholar]
- 3.Greger K, Swoger J, Stelzer EH. Rev Sci Instrum. 2007;78:023705. doi: 10.1063/1.2428277. [DOI] [PubMed] [Google Scholar]
- 4.Keller PJ, Schmidt AD, Wittbrodt J, Stelzer EHK. Science. 2008;322:1065–1069. doi: 10.1126/science.1162493. [DOI] [PubMed] [Google Scholar]
- 5.Santi PA. Journal of Histochemistry & Cytochemistry. 2011;59:129–138. doi: 10.1369/0022155410394857. [DOI] [PMC free article] [PubMed] [Google Scholar]
- 6.Huisken J, Stainier DYR. Development. 2009;136:1963–1975. doi: 10.1242/dev.022426. [DOI] [PMC free article] [PubMed] [Google Scholar]
- 7.Planchon TA, Gao L, Milkie DE, Davidson MW, Galbraith JA, Galbraith CG, Betzig E. Nat Meth. 2011;8:417–423. doi: 10.1038/nmeth.1586. [DOI] [PMC free article] [PubMed] [Google Scholar]
- 8.Wu Y, Ghitani A, Christensen R, Santella A, Du Z, Rondeau G, Bao Z, Colón-Ramos D, Shroff H. Proc Natl Acad Sci USA. 2011;108:17708–17713. doi: 10.1073/pnas.1108494108. [DOI] [PMC free article] [PubMed] [Google Scholar]
- 9.Scherz PJ, Huisken J, Sahai-Hernandez P, Stainier DYR. Development. 2008;135:1179–1187. doi: 10.1242/dev.010694. [DOI] [PubMed] [Google Scholar]
- 10.Arrenberg AB, Stainier DYR, Baier H, Huisken J. Science. 2010;330:971–974. doi: 10.1126/science.1195929. [DOI] [PubMed] [Google Scholar]
- 11.Swoger J, Muzzopappa M, López-Schier H, Sharpe J. Journal of Biophotonics. 2011;4:122–134. doi: 10.1002/jbio.201000087. [DOI] [PubMed] [Google Scholar]
- 12.Carlton PM, Boulanger J, Kervrann C, Sibarita JB, Salamero J, Gordon-Messer S, Bressan D, Haber JE, Haase S, Shao L, Winoto L, Matsuda A, Kner P, Uzawa S, Gustafsson M, Kam Z, Agard DA, Sedat JW. Proc Natl Acad Sci USA. 2010;107:16016–16022. doi: 10.1073/pnas.1004037107. [DOI] [PMC free article] [PubMed] [Google Scholar]
- 13.DeLaurier A, Eames BF, Blanco-Sánchez B, Peng G, He X, Swartz ME, Ullmann B, Westerfield M, Kimmel CB. Genesis. 2010;48:505–511. doi: 10.1002/dvg.20639. [DOI] [PMC free article] [PubMed] [Google Scholar]
- 14.Kimmel CB, DeLaurier A, Ullmann B, Dowd J, McFadden M. PLoS ONE. 2010;5:e9475. doi: 10.1371/journal.pone.0009475. [DOI] [PMC free article] [PubMed] [Google Scholar]
- 15.Li N, Felber K, Elks P, Croucher P, Roehl HH. Dev Dyn. 2009;238:459–466. doi: 10.1002/dvdy.21838. [DOI] [PubMed] [Google Scholar]
- 16.Cubbage CC, Mabee PM. J Morphology. 1996;229:121–160. doi: 10.1002/(SICI)1097-4687(199608)229:2<121::AID-JMOR1>3.0.CO;2-4. [DOI] [PubMed] [Google Scholar]
- 17.FishFace: An Atlas of zebrafish craniofacial development, https://www.facebase.org/fishface/about.
- 18.Taormina MJ, Jemielita M, Stephens WZ, Burns AR, Troll JV, Parthasarathy R, Guillemin K. Biol Bulletin. 2012;223:7–20. doi: 10.1086/BBLv223n1p7. [DOI] [PMC free article] [PubMed] [Google Scholar]
- 19.Keller PJ, Stelzer EH. Curr Opin Neurobiol. 2008;18:624–632. doi: 10.1016/j.conb.2009.03.008. [DOI] [PubMed] [Google Scholar]
- 20.Pawley JB. Handbook of Biological Confocal Microscopy. Springer; 2006. [Google Scholar]
- 21.Gräf R, Rietdorf J, Zimmermann T. Advances in Biochemical Engineering/Biotechnology. 2005;95:1311–1315. doi: 10.1007/b102210. [DOI] [PubMed] [Google Scholar]
- 22.Solomon C, Breckon T. Fundamentals of Digital Image Processing: A Practical Approach with Examples in Matlab. John Wiley And Sons; 2011. [Google Scholar]
- 23.Kimmel CB, Miller CT, Kruze G, Ullmann B, BreMiller RA, Larison KD, Snyder HC. Developmental Biology. 1998;203:245–263. doi: 10.1006/dbio.1998.9016. [DOI] [PubMed] [Google Scholar]
Associated Data
This section collects any data citations, data availability statements, or supplementary materials included in this article.
Supplementary Materials
Supplementary Figure 1: Normalized fluorescence intensity for fish imaged on the spinning disk confocal (grey crosses) and light sheet (black circles) microscopes. One of the light sheet imaged fish showed a considerable increase in brightness at around 86 hpf, causing the step evident in the plotted specimen-averaged data.
Supplementary Figure 2: Perimeter ratio for opercles imaged at 20 minute time intervals using the spinning disk confocal microscope (average, N = 4).
Supplementary Figure 3: Maximum intensity projections of three dimensional scans of sox9azc81Tg:EGFP showing cartilage including the symplectic cartilage (arrows), imaged using spinning disk confocal (A) and light sheet (B) microscopy with equivalent exposure conditions. One three-dimensional data set was acquired every ten minutes over the course of twenty-four hours; the images shown are from the final time point, at 72 hpf. The scale bar length is 20 microns.
Supplementary Video 1: Maximum intensity projections of three dimensional scans of EGFP-expressing osteoblast cells in a developing opercle, from the same specimen shown in Figure 3A, imaged using light sheet microscopy. One three-dimensional image was acquired every ten minutes; the full data set and movie span twenty-four hours. Scale bar: 20 microns.
Supplementary Video 2: Maximum intensity projections of three dimensional scans of EGFP-expressing osteoblast cells in a developing opercle, from the same specimen shown in Figure 3B, imaged using spinning disk confocal microscopy. One three-dimensional image was acquired every ten minutes; the full data set and movie span twenty-four hours. Scale bar: 20 microns.
Supplementary Video 3: Maximum intensity projections of three dimensional scans of EGFP-expressing osteoblast cells in a developing opercle imaged using spinning disk confocal microscopy, as in Supplementary Video 1, but with one three-dimensional image acquired every twenty minutes; the full data set and movie span twenty-four hours. Scale bar: 20 microns.
Supplementary Video 4: Maximum intensity projections of three dimensional scans of a sox9azc81Tg:EGFP zebrafish, imaged using light sheet fluorescence microscopy. The growth of the symplectic cartilage (see Supplementary Figure 3) is evident. One three-dimensional data set was acquired every ten minutes over the course of twenty-four hours. The scale bar length is 20 microns
Supplementary Video 5: A single three dimensional image of a 72 hpf sox9azc81Tg:EGFP zebrafish, imaged using light sheet fluorescence microscopy. The video shows a scan along the dimension perpendicular to the sheet. Each two-dimensional frame is separated in depth by 1 micron. The scale bar length is 20 microns.


