

Abstract
Aim
The Frailty Index (FI) summarizes differences in health status within individuals, and the determinants of health drive that variability. The aim of the present study was to investigate the influence of education, income, smoking, alcohol intake, and parental longevity on the FI variability in subjects of the same chronological age group.
Methods
Analyses were based on a 40-item FI based on the first wave of the Survey of Health, Ageing and Retirement in Europe (SHARE, http://www.share-project.org/), including 29,905 participants aged ≥ 50 from 12 countries. For each sex, the sample was divided into age categories (50s, 60s, 70s, 80s and ≥ 90) and FI quartiles within age categories were calculated. Multivariate ordinal regressions were computed to assess the relative contribution of the health determinants on the FI quartiles in each age group.
Results
In women, the most significant multivariate predictors were years of education (Odds Ratios [ORs] around 0.9), and difficulties making ends meet (ORs between 1.8 and 2.1). In men, the most significant multivariate predictors were years of education (ORs around 0.9), difficulties making ends meet (ORs between 1.6 and 2.1), mother’s age of death (OR under 1), and father’s age of death (ORs under 1).
Conclusions
Consistently with the literature, education and income explained, in both sexes, cross-sectional variability in FI in subjects of the same chronological age group. The influence of parental longevity seemed to be greater in men, which mirrors previous studies showing that genetic factors may have a higher impact on longevity in men.
Keywords: Frail Elderly, Severity of Illness Index, Epidemiologic Factors, Socioeconomic Status, Sex Differences
Introduction
Frailty in older adults is a state of vulnerability to poor resolution of homoeostasis after a stressor event and is a consequence of cumulative decline in many physiological systems during a lifetime 1. Although there is no international consensus on a definition of frailty 2, 3, a popular operationalization is the Frailty Index (FI) 4, 5.
The FI sees frailty in relation to the accumulation of health deficits. The FI is measured by comparing the ratio of health deficits present within an individual to possible health deficits, using a pre-specified list of 30 or more deficits 4. A deficit can be any symptom, sign, disease, disability, or laboratory abnormality that is associated with age and adverse outcomes, present in at least 1% of the population, covers several organ systems and has no more than 5% missing data 6. Age is not included as a deficit, but the FI increases exponentially with age 7.
The FI summarizes differences in health status, even within individuals of the same chronological age 8 (this is exemplified in Figure 1). Therefore, the FI helps represent the fact that population ageing is diverse, and the relationship between chronological age and health status is extremely variable 9.
Figure 1.
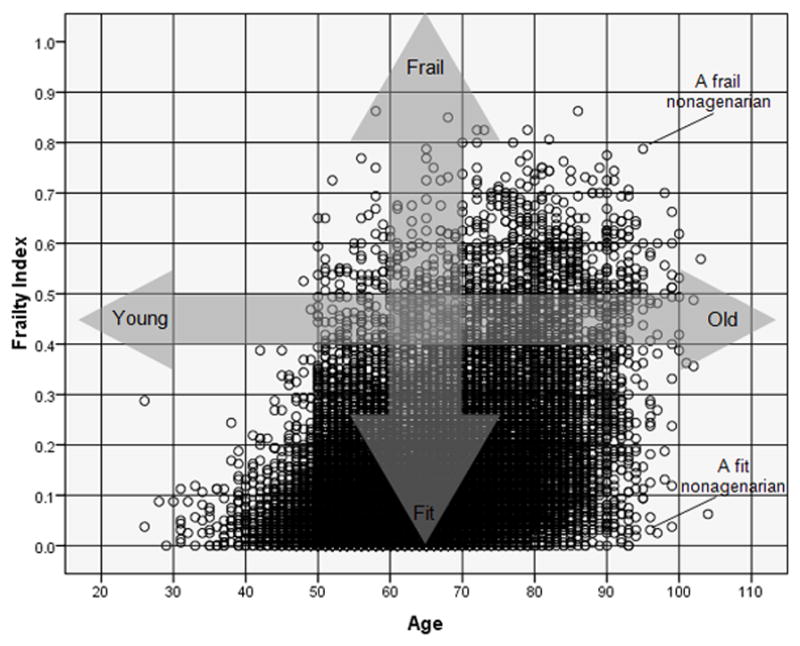
Scatter plot between age and the Frailty Index (FI) in a theoretical population. The FI is reflects, at any given chronological age, where someone lies along the ‘fitness-frailty spectrum’. Two different nonagenarians are exemplified: a nonagenarian with a high number of accumulated deficits (a ‘frail’ nonagenarian) and a nonagenarian with a low number of accumulated deficits (a ‘fit’ nonagenarian). The FI helps represent the fact that population ageing is diverse, and the relationship between chronological age and health (or ‘biological age’) is extremely variable.
The FI is generally presented separately for women and men because the rate of deficit accumulation is sex-sensitive 10. On average, women accumulate more deficits than men of the same age, but their risk of mortality is lower 8.
While the construct validity of the FI is examined through its relationship to chronological age, its criterion validity is examined in its ability to predict adverse outcomes, including mortality and excess use of health and social care services 11. The latter has been the focus of many epidemiological studies 12–14. In addition, in recent years the FI approach has been adopted by non-geriatric clinicians for the prediction of adverse outcomes in specific clinical settings 15–17.
While the adverse consequences of the FI have been extensively demonstrated in non-clinical and clinical populations, the factors driving the FI variability in subjects of the same chronological age have been less studied. Such factors are likely to be related to the known determinants of health 18. The World Health Organization recognizes that to a large extent, factors such as genetics, education, socio-economic status and lifestyle all have considerable impacts on health 19, especially in developed countries where, at the population level, the influence of other factors such as sanitation (environment) and access to health and social care has been minimized thanks to advances in Public Health and Social Policies 20.
The Survey of Health, Ageing and Retirement in Europe (SHARE) is a multidisciplinary and cross-national panel database of micro data on health, socioeconomic status and social and family networks of Europeans aged 50 or over (http://www.share-project.org/). SHARE has been defined as a gold mine of individual, economic and health information that can provide insight into better understanding of frailty across diverse population settings 21.
Based on the first wave of SHARE, we previously operationalized a 40-item FI that had the expected properties in this large sample of Europeans 22. For each sex, we showed a significant non-linear association between age and the FI, and that the FI was a much stronger predictor of mortality than age, even after adjusting for the latter. The aim of the present study was to use that validated FI to investigate the influence of key determinants of health such as level of education, income sufficiency, behavioural risks (i.e. smoking, alcohol intake) and parental longevity (as a surrogate for genetic factors) on the FI variability in subjects of the same chronological age group.
Materials and methods
Setting
The study is based on the Survey of Health, Ageing and Retirement in Europe (SHARE, http://www.share-project.org/). Based on probability samples in all participating countries, SHARE represents the non-institutionalised population aged 50 and older. Spouses were also interviewed if they were younger than 50 but we excluded them from our analyses. The first wave was collected between 2004 and 2005.
Creation of the FI
Based on the first wave of SHARE, a 40-item FI was created as per standard procedure 23. Each of the 40 deficit variables was scored such that 0 = deficit absent and 1 = deficit present. The scores were added and divided by the total number of deficits evaluated (i.e. 40), to produce a FI between 0.0 (i.e. no deficits present) and 1.0 (i.e. all deficits present). Appendix 1 shows the FI deficit variables and cut-off points.
Determinants of health
The following measures (which were not included as deficits in the FI definition) were used:
Education: years of education.
Income sufficiency: household has (some or great) difficulties making ends meet (yes or no).
Behavioural risks: current smoker (yes or no), excess alcohol intake (i.e. drinking more than two glasses of alcohol almost every day or 5/6 days a week: yes or no).
Parental longevity (as a surrogate marker for genetic factors): mother’s age of death and father’s age of death.
Statistical analyses
Statistics were computed with SPSS 16.0, separately for each sex. The level of significance was established at 0.01 throughout.
As previously described 22, the sample was divided into age categories (i.e. 50s, 60s, 70s, 80s and ≥ 90) and the FI quartiles within age categories were calculated.
In order to assess the correlation between the individual health determinants and the FI quartiles in each age group, the two-tailed Spearman’s rank correlation coefficient was used for continuous variables and the chi-squared test for linear trend for dichotomous variables.
In order to assess the relative contribution of the individual health determinants on the FI quartiles in each age group, the ordinal regression procedure was used, which models the dependence of a polytomous ordinal response (i.e. FI quartiles) on a set of predictors (i.e. years of education, income sufficiency, smoking, excess alcohol intake, mother’s age of death, father’s age of death). Odds ratios with 95% confidence intervals (CI) were requested for each predictor.
Ethics
This is a secondary analysis of data obtained under the SHARE Data Access Rules (http://share-dev.mpisoc.mpg.de/data-access-documentation/research-data-center-data-access.html). Originally, SHARE received ethical approval by the University of Mannheim’s Internal Review Board. All participants consented to the study.
Results
The first wave of SHARE included 29,905 participants aged ≥ 50 years from 12 countries (Austria, Germany, Sweden, Netherlands, Spain, Italy, France, Denmark, Greece, Switzerland, Belgium, and Israel). There were 16,217 women (54.2%) with a mean (SD) age of 64.8 (10.4) years, and 13,688 men (45.8%) with a mean (SD) age of 64.3 (9.8) years.
Of the 16,217 women, 6,083 were in their 50s (1,224 in the 1st FI quartile; 1,774 in the 2nd quartile; 1,531 in the 3rd quartile; 1,554 in the 4th quartile); 4,970 in their 60s (1,111 in the 1st FI quartile; 1,322 in the 2nd; 1,249 in the 3rd; 1,288 in the 4th); 3,461 in their 70s (778 in the 1st FI quartile; 898 in the 2nd; 890 in the 3rd; 895 in the 4th); 1,460 in their 80s (351 in the 1st FI quartile; 370 in the 2nd; 363 in the 3rd; 376 in the 4th), and 243 were aged 90 and above (52 in the 1st FI quartile; 69 in the 2nd; 55 in the 3rd; 67 in the 4th).
Of the 13,688 men, 5,153 were in their 50s (1,053 in the 1st FI quartile; 1,284 in the 2nd; 1,480 in the 3rd; 1,336 in the 4th); 4,471 were in their 60s (1,086 in the 1st FI quartile; 1,132 in the 2nd; 1,082 in the 3rd; 1,171 in the 4th); 2,996 were in their 70s (745 in the 1st FI quartile; 691 in the 2nd; 811 in the 3rd; 749 in the 4th); 954 were in their 80s (222 in the 1st FI quartile; 242 in the 2nd; 243 in the 3rd; 247 in the 4th); and 114 were aged 90 and above (28 in the 1st FI quartile; 28 in the 2nd; 28 in the 3rd; 30 in the 4th).
As regards the association with age and mortality, the properties of the FI have been described elsewhere 22. As regards the association with utilization of health and social care services, results are presented in Appendix 2.
Tables 1 and 2 present the correlation between the individual health determinants and the FI quartiles in each age group. In women, there were statistically significant gradients in years of education for those in their 50s, 60s, 70s and 80s (mean differences between 1st and 4th FI quartiles ranged between 2.4 to 2.8 years). In men, there were statistically significant gradients in years of education in all age groups, with mean differences between 1st and 4th FI quartiles ranging between 1.9 (80s) to 6.6 (90+) years.
Table 1.
| WOMEN | Age group | Lowest FI quartile | 2nd FI quartile | 3rd FI quartile | Highest FI quartile | P for linear trend |
|---|---|---|---|---|---|---|
| Education | ||||||
| Years of education: mean (SD) | 50s | 12.1 (3.7) | 11.2 (3.8) | 10.6 (4.2) | 9.5 (4.2) | <0.001Σ |
| 60s | 10.5 (4.1) | 9.8 (4.1) | 9.1 (4.2) | 7.9 (4.4) | <0.001Σ | |
| 70s | 9.0 (4.1) | 8.1 (4.3) | 7.3 (4.4) | 6.2 (4.3) | <0.001Σ | |
| 80s | 8.2 (4.1) | 7.6 (4.0) | 6.7 (4.0) | 5.8 (4.1) | <0.001Σ | |
| 90+ | 6.8 (4.2) | 7.2 (4.1) | 6.4 (3.8) | 5.4 (3.8) | 0.033Σ | |
| Socioeconomic | ||||||
| Household has difficulties making ends meet (%) | 50s | 24.8 | 36.3 | 43.1 | 57.7 | <0.001χ |
| 60s | 27.7 | 36.7 | 43.7 | 63.5 | <0.001χ | |
| 70s | 30.3 | 35.0 | 46.7 | 59.4 | <0.001χ | |
| 80s | 23.8 | 33.7 | 42.0 | 52.3 | <0.001χ | |
| 90+ | 33.3 | 37.1 | 29.8 | 48.8 | 0.248χ | |
| Behavioural risks | ||||||
| Current smoker (%) | 50s | 22.3 | 21.1 | 24.9 | 24.9 | 0.014χ |
| 60s | 13.9 | 15.2 | 13.0 | 13.8 | 0.564χ | |
| 70s | 8.3 | 9.0 | 7.2 | 5.4 | 0.007χ | |
| 80s | 3.5 | 4.6 | 6.6 | 4.8 | 0.266χ | |
| 90+ | 0.0 | 1.4 | 1.8 | 1.5 | 0.499χ | |
| Drinking > 2 glasses of alcohol almost every or 5/6 days a week (%) | 50s | 6.5 | 7.2 | 6.7 | 5.5 | 0.165χ |
| 60s | 8.0 | 7.9 | 7.0 | 5.0 | 0.002χ | |
| 70s | 5.8 | 4.6 | 5.4 | 3.1 | 0.029χ | |
| 80s | 5.6 | 4.6 | 3.9 | 2.9 | 0.070χ | |
| 90+ | 4.0 | 4.3 | 5.5 | 0.0 | 0.239χ | |
| ‘Longevity’ factors | ||||||
| Mother’s age of death: mean (SD) | 50s | 72.0 (13.0) | 71.9 (13.7) | 72.6 (13.0) | 71.5 (12.9) | 0.312Σ |
| 60s | 76.8 (13.2) | 75.7 (14.2) | 76.0 (13.8) | 75.1 (13.0) | 0.001Σ | |
| 70s | 76.6 (15.2) | 76.0 (15.1) | 74.4 (15.8) | 73.9 (16.1) | <0.001Σ | |
| 80s | 75.3 (14.8) | 75.9 (15.3) | 71.7 (17.2) | 72.0 (17.9) | 0.002Σ | |
| 90+ | 76.5 (15.5) | 72.7 (18.4) | 72.3 (15.9) | 70.6 (17.2) | 0.057Σ | |
| Father’s age of death: mean (SD) | 50s | 71.0 (12.5) | 71.5 (12.2) | 70.0 (13.5) | 70.5 (12.8) | 0.074Σ |
| 60s | 71.8 (15.1) | 71.1 (15.3) | 70.7 (15.2) | 70.1 (15.0) | <0.001Σ | |
| 70s | 71.8 (14.6) | 71.0 (14.7) | 70.3 (15.0) | 68.9 (16.1) | <0.001Σ | |
| 80s | 73.0 (14.6) | 71.1 (14.8) | 72.3 (15.4) | 69.7 (15.7) | 0.030Σ | |
| 90+ | 73.7 (17.3) | 70.1 (17.8) | 70.8 (16.9) | 71.3 (15.3) | 0.330Σ |
Two-tailed Spearman’s rank correlation coefficient
Chi-squared test for linear trend.
Table 2.
| MEN | Age group | Lowest FI quartile | 2nd FI quartile | 3rd FI quartile | Highest FI quartile | P for linear trend |
|---|---|---|---|---|---|---|
| Education | ||||||
| Years of education: mean (SD) | 50s | 12.4 (3.8) | 11.8 (3.9) | 11.6 (3.9) | 10.1 (4.3) | <0.001Σ |
| 60s | 11.3 (4.4) | 10.8 (4.3) | 10.5 (4.4) | 9.3 (4.7) | <0.001Σ | |
| 70s | 10.1 (4.5) | 9.8 (4.6) | 8.9 (4.8) | 7.6 (4.9) | <0.001Σ | |
| 80s | 9.8 (4.5) | 8.8 (4.8) | 8.7 (4.4) | 7.9 (4.7) | <0.001Σ | |
| 90+ | 11.0 (4.7) | 6.8 (5.3) | 8.0 (4.3) | 4.4 (4.3) | <0.001Σ | |
| Socioeconomic | ||||||
| Household has (some or great) difficulties making ends meet (%) | 50s | 27.2 | 29.8 | 36.0 | 52.6 | <0.001χ |
| 60s | 21.5 | 26.9 | 34.2 | 51.8 | <0.001χ | |
| 70s | 26.2 | 29.2 | 35.5 | 53.3 | <0.001χ | |
| 80s | 27.3 | 32.5 | 35.8 | 40.3 | 0.013χ | |
| 90+ | 33.3 | 27.3 | 52.2 | 66.7 | 0.018χ | |
| Behavioural risks | ||||||
| Current smoker (%) | 50s | 32.7 | 29.8 | 32.1 | 37.1 | 0.005χ |
| 60s | 24.8 | 20.2 | 22.3 | 21.7 | 0.214χ | |
| 70s | 16.1 | 13.8 | 12.1 | 11.7 | 0.007χ | |
| 80s | 12.4 | 9.2 | 10.7 | 12.1 | 0.900χ | |
| 90+ | 7.7 | 7.1 | 3.6 | 0.0 | 0.124χ | |
| Drinking > 2 glasses of alcohol almost every or 5/6 days a week (%) | 50s | 17.5 | 20.9 | 22.2 | 20.7 | 0.051χ |
| 60s | 22.5 | 22.0 | 23.5 | 21.0 | 0.600χ | |
| 70s | 23.1 | 20.8 | 21.8 | 15.8 | 0.002χ | |
| 80s | 14.4 | 13.3 | 18.1 | 12.6 | 0.934χ | |
| 90+ | 19.2 | 17.9 | 3.6 | 6.7 | 0.058χ | |
| ‘Longevity’ factors | ||||||
| Mother’s age of death: mean (SD) | 50s | 73.2 (13.0) | 72.1 (13.4) | 72.6 (12.8) | 71.7 (12.9) | 0.032Σ |
| 60s | 77.0 (13.7) | 75.4 (13.4) | 75.9 (13.6) | 74.2 (14.5) | <0.001Σ | |
| 70s | 77.4 (14.0) | 77.3 (14.0) | 75.1 (15.1) | 74.6 (15.3) | <0.001Σ | |
| 80s | 76.8 (15.5) | 75.7 (15.7) | 74.7 (15.4) | 73.6 (16.1) | 0.008Σ | |
| 90+ | 77.8 (17.8) | 70.7 (13.4) | 76.4 (14.7) | 73.5 (17.0) | 0.492Σ | |
| Father’s age of death: mean (SD) | 50s | 72.4 (11.8) | 70.8 (12.4) | 70.3 (12.5) | 69.5 (12.5) | <0.001Σ |
| 60s | 71.7 (15.0) | 70.7 (15.6) | 70.9 (15.7) | 69.0 (16.3) | <0.001Σ | |
| 70s | 73.6 (14.7) | 72.3 (14.5) | 70.7 (15.2) | 70.2 (15.0) | <0.001Σ | |
| 80s | 75.3 (15.0) | 72.2 (15.0) | 72.2 (13.7) | 70.7 (16.7) | 0.002Σ | |
| 90+ | 75.5 (13.3) | 67.0 (13.8) | 75.8 (15.5) | 72.6 (15.5) | 0.844Σ |
Two-tailed Spearman’s rank correlation coefficient
Chi-squared test for linear trend.
In women, there were statistically significant gradients in difficulties making ends meet for those in their 50s, 60s, 70s and 80s (the percentage differences between 4th and 1st FI quartiles ranged between 29% and 36%). In men, there were statistically significant gradients in difficulties making ends meet for those in their 50s, 60s and 70s (the percentage differences between 4th and 1st FI quartiles ranged between 25% and 30%) (Tables 1 and 2).
In terms of behavioural risks, women in their 60s had a significant trend towards less excess drinking with FI quartile increases (3% less in the 4th than the 1st FI quartile), and women in their 70s had a significant trend towards less smoking with FI quartile increases (3% less in the 4th than the 1st FI quartile). Men in their 50s had a significant trend towards more smoking with FI quartile increases (4% more in the 4th than the 1st FI quartile), and men in their 70s had a significant trend towards less smoking with FI quartile increases (4% less in the 4th than the 1st FI quartile). Men in their 70s had a significant trend towards less excess drinking with FI quartile increases (7% less in the 4th than the 1st FI quartile) (Tables 1 and 2).
In terms of the mother’s age of death, in women, there were statistically significant gradients for those in their 60s, 70s and 80s (mean differences between 1st and 4th FI quartiles ranged between 2 to 3 years). In men, there were statistically significant gradients for those in their 60s, 70s and 80s (mean differences between 1st and 4th FI quartiles were around 3 years) (Tables 1 and 2).
In terms of the father’s age of death, in women, there were statistically significant gradients for those in their 60s and 70s (mean differences between 1st and 4th FI quartiles ranged between 2 to 3 years). In men, there were statistically significant gradients for those in their 50s, 60s, 70s and 80s (mean differences between 1st and 4th FI quartiles were between 3 and 5 years) (Tables 1 and 2).
Tables 3 and 4 present the results of the multivariable ordinal regression models. In women, the significant multivariate predictors were years of education (in those in their 50s, 60s, 70s and 80s; the Odds Ratios were around 0.9), and difficulties making ends meet (in those in their 50s, 60s, 70s and 80s; Odds Ratios were between 1.8 and 2.1). In men, the significant multivariate predictors were years of education (in those in their 50s, 60s, 70s and 90s; the Odds Ratios were around 0.9), difficulties making ends meet (in those in their 50s, 60s and 70s; Odds Ratios were between 1.6 and 2.1), mother’s age of death (in those in their 60s; Odds Ratio was under 1), and father’s age of death (in those in their 60s, 70s and 80s; Odds Ratios were under 1).
Table 3.
| WOMEN | Age group | B | Std. Error | Hypothesis Test | Odds Ratio | 95% Wald Confidence Interval for Odds Ratio | |||
|---|---|---|---|---|---|---|---|---|---|
| Wald Chi- Square | df | P | Lower | Upper | |||||
| Household has (some or great) difficulties making ends meet | 50s | 0.732 | 0.102 | 51.933 | 1.000 | <0.001 | 2.078 | 1.703 | 2.536 |
| 60s | 0.741 | 0.081 | 82.871 | 1.000 | <0.001 | 2.098 | 1.789 | 2.461 | |
| 70s | 0.663 | 0.085 | 60.510 | 1.000 | <0.001 | 1.941 | 1.643 | 2.295 | |
| 80s | 0.613 | 0.123 | 24.701 | 1.000 | <0.001 | 1.846 | 1.450 | 2.351 | |
| 90+ | 0.095 | 0.325 | 0.085 | 1.000 | 0.770 | 1.099 | 0.582 | 2.078 | |
| Current smoker | 50s | 0.133 | 0.108 | 1.518 | 1.000 | 0.218 | 1.142 | 0.925 | 1.410 |
| 60s | −0.007 | 0.107 | 0.005 | 1.000 | 0.946 | 0.993 | 0.804 | 1.225 | |
| 70s | −0.237 | 0.144 | 2.718 | 1.000 | 0.099 | 0.789 | 0.596 | 1.046 | |
| 80s | 0.624 | 0.246 | 6.436 | 1.000 | 0.011 | 1.866 | 1.152 | 3.021 | |
| 90+ | 0.598 | 1.095 | 0.299 | 1.000 | 0.585 | 1.819 | 0.213 | 15.542 | |
| Drinking > 2 glasses of alcohol almost every or 5/6 days a week | 50s | −0.328 | 0.188 | 3.040 | 1.000 | 0.081 | 0.720 | 0.498 | 1.042 |
| 60s | −0.338 | 0.150 | 5.067 | 1.000 | 0.024 | 0.713 | 0.531 | 0.957 | |
| 70s | 0.057 | 0.195 | 0.086 | 1.000 | 0.770 | 1.059 | 0.722 | 1.552 | |
| 80s | −0.180 | 0.271 | 0.438 | 1.000 | 0.508 | 0.836 | 0.491 | 1.422 | |
| 90+ | −1.461 | 0.965 | 2.290 | 1.000 | 0.130 | 0.232 | 0.035 | 1.539 | |
| Years of education | 50s | −0.094 | 0.012 | 57.822 | 1.000 | <0.001 | 0.911 | 0.889 | 0.933 |
| 60s | −0.072 | 0.009 | 58.337 | 1.000 | <0.001 | 0.931 | 0.914 | 0.948 | |
| 70s | −0.071 | 0.010 | 52.519 | 1.000 | <0.001 | 0.932 | 0.914 | 0.950 | |
| 80s | −0.075 | 0.015 | 25.690 | 1.000 | <0.001 | 0.928 | 0.901 | 0.955 | |
| 90+ | −0.069 | 0.039 | 3.162 | 1.000 | 0.075 | 0.933 | 0.865 | 1.007 | |
| Mother’s age of death | 50s | −0.002 | 0.004 | 0.309 | 1.000 | 0.578 | 0.998 | 0.990 | 1.005 |
| 60s | 0.000 | 0.003 | 0.002 | 1.000 | 0.968 | 1.000 | 0.995 | 1.006 | |
| 70s | −0.004 | 0.003 | 2.503 | 1.000 | 0.114 | 0.996 | 0.991 | 1.001 | |
| 80s | −0.008 | 0.004 | 4.664 | 1.000 | 0.031 | 0.992 | 0.986 | 0.999 | |
| 90+ | −0.016 | 0.009 | 3.020 | 1.000 | 0.082 | 0.985 | 0.967 | 1.002 | |
| Father’s age of death | 50s | 0.001 | 0.004 | 0.024 | 1.000 | 0.876 | 1.001 | 0.993 | 1.008 |
| 60s | −0.005 | 0.003 | 3.629 | 1.000 | 0.057 | 0.995 | 0.990 | 1.000 | |
| 70s | −0.006 | 0.003 | 4.966 | 1.000 | 0.026 | 0.994 | 0.988 | 0.999 | |
| 80s | −0.005 | 0.004 | 1.467 | 1.000 | 0.226 | 0.995 | 0.988 | 1.003 | |
| 90+ | −0.016 | 0.009 | 2.956 | 1.000 | 0.086 | 0.985 | 0.967 | 1.002 | |
Table 4.
| MEN | Age group | B | Std. Error | Hypothesis Test | Odds Ratio | 95% Wald Confidence Interval for Odds Ratio | |||
|---|---|---|---|---|---|---|---|---|---|
| Wald Chi- Square | df | P | Lower | Upper | |||||
| Household has (some or great) difficulties making ends meet | 50s | 0.509 | 0.109 | 21.672 | 1.000 | <0.001 | 1.663 | 1.343 | 2.060 |
| 60s | 0.757 | 0.087 | 75.868 | 1.000 | <0.001 | 2.133 | 1.798 | 2.529 | |
| 70s | 0.482 | 0.097 | 24.597 | 1.000 | <0.001 | 1.619 | 1.338 | 1.959 | |
| 80s | 0.141 | 0.175 | 0.649 | 1.000 | 0.421 | 1.151 | 0.817 | 1.620 | |
| 90+ | 0.513 | 0.472 | 1.186 | 1.000 | 0.276 | 1.671 | 0.663 | 4.211 | |
| Current smoker | 50s | 0.216 | 0.106 | 4.183 | 1.000 | 0.041 | 1.241 | 1.009 | 1.527 |
| 60s | −0.088 | 0.091 | 0.943 | 1.000 | 0.332 | 0.916 | 0.766 | 1.094 | |
| 70s | −0.292 | 0.126 | 5.356 | 1.000 | 0.021 | 0.747 | 0.583 | 0.956 | |
| 80s | 0.032 | 0.242 | 0.017 | 1.000 | 0.895 | 1.032 | 0.643 | 1.659 | |
| 90+ | 0.073 | 1.212 | 0.004 | 1.000 | 0.952 | 1.076 | 0.100 | 11.563 | |
| Drinking > 2 glasses of alcohol almost every or 5/6 days a week | 50s | −0.028 | 0.116 | 0.060 | 1.000 | 0.806 | 0.972 | 0.775 | 1.219 |
| 60s | 0.004 | 0.087 | 0.002 | 1.000 | 0.965 | 1.004 | 0.846 | 1.191 | |
| 70s | −0.073 | 0.102 | 0.509 | 1.000 | 0.476 | 0.930 | 0.761 | 1.136 | |
| 80s | 0.166 | 0.202 | 0.671 | 1.000 | 0.413 | 1.180 | 0.794 | 1.754 | |
| 90+ | −1.359 | 0.675 | 4.051 | 1.000 | 0.044 | 0.257 | 0.068 | 0.965 | |
| Years of education | 50s | −0.067 | 0.012 | 29.175 | 1.000 | <0.001 | 0.935 | 0.913 | 0.958 |
| 60s | −0.039 | 0.009 | 19.292 | 1.000 | <0.001 | 0.962 | 0.945 | 0.979 | |
| 70s | −0.054 | 0.010 | 31.004 | 1.000 | <0.001 | 0.948 | 0.930 | 0.966 | |
| 80s | −0.022 | 0.017 | 1.661 | 1.000 | 0.198 | 0.978 | 0.945 | 1.012 | |
| 90+ | −0.163 | 0.049 | 11.274 | 1.000 | 0.001 | 0.850 | 0.773 | 0.935 | |
| Mother’s age of death | 50s | −0.002 | 0.004 | 0.382 | 1.000 | 0.537 | 0.998 | 0.990 | 1.005 |
| 60s | −0.011 | 0.003 | 16.167 | 1.000 | <0.001 | 0.989 | 0.983 | 0.994 | |
| 70s | −0.006 | 0.003 | 3.572 | 1.000 | 0.059 | 0.994 | 0.989 | 1.000 | |
| 80s | −0.009 | 0.005 | 2.962 | 1.000 | 0.085 | 0.991 | 0.980 | 1.001 | |
| 90+ | −0.015 | 0.015 | 1.032 | 1.000 | 0.310 | 0.985 | 0.958 | 1.014 | |
| Father’s age of death | 50s | −0.008 | 0.004 | 3.809 | 1.000 | 0.051 | 0.992 | 0.984 | 1.000 |
| 60s | −0.008 | 0.003 | 10.306 | 1.000 | 0.001 | 0.992 | 0.987 | 0.997 | |
| 70s | −0.009 | 0.003 | 9.653 | 1.000 | 0.002 | 0.991 | 0.985 | 0.997 | |
| 80s | −0.015 | 0.006 | 7.466 | 1.000 | 0.006 | 0.985 | 0.975 | 0.996 | |
| 90+ | −0.022 | 0.015 | 1.970 | 1.000 | 0.160 | 0.979 | 0.950 | 1.009 | |
Discussion
The aim of the present study was to use a validated FI to investigate the influence of key determinants of health such as level of education, income sufficiency, behavioural risks (i.e. smoking, alcohol intake) and parental longevity (as a surrogate for genetic factors) on the FI variability in subjects of the same chronological age group. In multivariable analyses, years of education and difficulties making ends meet emerged as significant predictors of FI quartile membership. In addition, in males only, parental (and more consistently, paternal) longevity was predictive of FI quartile membership.
The findings of the present study need to be interpreted within the limitations of its cross-sectional design, which precludes the inference of causality. Another limitation is a likely survivor bias 24 in the identified relationships between smoking and the FI: indeed, men in their 50s had a significant trend towards more smoking with FI quartile increases, but men in their 70s had a significant trend towards less smoking with FI quartile increases. This could be explained by the fact that many frail smokers in the 50s may not live long enough to be 70 25. Another limitation is that sample sizes for the 90+ may have been too small to detect statistically significant associations.
Bearing the above limitations in mind, one of the strengths of the present study is that it highlights the importance of the social determinants of health 26 within a FI approach, echoing previous observations that the FI is influenced by social and environmental factors in keeping with the concept of frailty being multi-dimensional 27. In terms of the importance of education, the Hispanic Health and Nutrition Examination Survey showed that Hispanics with the least years of schooling had the highest frailty rates, and those with the most years of schooling had the lowest frailty rates (frailty was defined in terms of disability) 28. In a SHARE-based study (using Fried’s frailty criteria 29), lower educated persons were at increased risk of worsening in frailty 30. In addition, the San Antonio Longitudinal Study of Aging (which also used Fried’s criteria), showed that fewer years of education were a predictor of progression in any frailty characteristic 31.
The literature is also consistent on the relationship between income sufficiency and frailty. In the Montreal Unmet Needs Study (which used Fried’s criteria), frailty was associated with income and education 32. In the Women’s Health and Aging Studies (which also used Fried’s criteria), the odds of frailty were increased for those of low education or income regardless of race 33. The Hispanic Established Populations for the Epidemiologic Study of the Elderly (which used Fried’s criteria) found that financial strain was related to increases in frailty over time 34. The Hertfordshire Cohort Study highlighted socio-economic inequalities in frailty using Fried’s criteria 35. The English Longitudinal Study of Aging, based on a FI approach, showed that frailty in older adults is independently associated with individual and neighbourhood socioeconomic factors 36. Furthermore, a FI in the Chinese Longitudinal Healthy Longevity Survey showed that the economic condition was significantly associated with levels of frailty 37.
Besides the influences of education and income on frailty, a more novel finding of the present study is the relationship of the FI with parental longevity. Even though parental longevity is a surrogate marker for hereditable factors conferring increased longevity to the offspring, a previous study showed that the accumulation of health deficiencies over the life course was not the same in the offspring of long-lived parents compared to the offspring of short-lived parents, likely due to inheritance related to parental longevity 38. Appendix 3 shows the multivariate analyses repeated dividing the samples into those under the age of 70 and those aged 70 or more. These additional analyses reiterate parental longevity as a consistent predictor of FI in both young and old men; however, in women, parental longevity was only associated with frailty in those over 70 years of age.
Sex differences in the hereditability of longevity have been reported elsewhere. For example, a previous study investigated the association of the polymorphic ADA (Adenosine Deaminase) gene (which plays a crucial role in the regulation of the immune system and in the control of metabolic rates) and human longevity, and found that the negligible effect of ADA genetic polymorphism in females suggest a marginal influence of genetic factors in determining longevity in this sex, confirming previous reports 39. Furthermore, one study reconstructed 202 families of nonagenarians from a population of southern Italy, and found that genetic factors in males have a higher impact than in females on attaining longevity 40. Indeed, the sex difference in life expectancy in humans may have an underlying genetic basis independent of frailty 41.
Conclusion
Even though genetic factors in men may have a higher impact in the frailty process than in women, the results of our study agree with previous reports confirming the presence of various sources of social inequalities over the life course, where education and social protection systems may play a major role in accompanying, preventing or reducing the frailty process 42.
Supplementary Material
Acknowledgments
This paper uses data from SHARE release 2.3.0, as of May 24th 2011. The SHARE data collection has been primarily funded by the European Commission through the 5th framework programme (project QLK6-CT-2001- 00360 in the thematic programme Quality of Life), through the 6th framework programme (projects SHARE-I3, RII-CT-2006-062193, COMPARE, CIT5-CT-2005-028857, and SHARELIFE, CIT4-CT-2006-028812) and through the 7th framework programme (SHARE-PREP, 211909 and SHARE-LEAP, 227822). Additional funding from the U.S. National Institute on Aging (U01 AG09740-13S2, P01 AG005842, P01 AG08291, P30 AG12815, Y1-AG-4553-01 and OGHA 04-064, IAG BSR06-11, R21 AG025169) as well as from various national sources is gratefully acknowledged (see www.share-project.org for a full list of funding institutions).
Footnotes
Disclosure statement
The author has no conflicts of interest.
References
- 1.Clegg A, Young J, Iliffe S, Rikkert MO, Rockwood K. Frailty in elderly people. Lancet. 2013;381:752–762. doi: 10.1016/S0140-6736(12)62167-9. [DOI] [PMC free article] [PubMed] [Google Scholar]
- 2.Rodriguez-Manas L, Feart C, Mann G, Vina J, Chatterji S, Chodzko-Zajko W, Gonzalez-Colaco Harmand M, Bergman H, Carcaillon L, Nicholson C, Scuteri A, Sinclair A, Pelaez M, Van der Cammen T, Beland F, Bickenbach J, Delamarche P, Ferrucci L, Fried LP, Gutierrez-Robledo LM, Rockwood K, Rodriguez Artalejo F, Serviddio G, Vega E group F-C. Searching for an operational definition of frailty: A delphi method based consensus statement: The frailty operative definition-consensus conference project. The journals of gerontology. Series A, Biological sciences and medical sciences. 2013;68:62–67. doi: 10.1093/gerona/gls119. [DOI] [PMC free article] [PubMed] [Google Scholar]
- 3.Conroy S. Defining frailty--the holy grail of geriatric medicine. The journal of nutrition, health & aging. 2009;13:389. doi: 10.1007/s12603-009-0050-9. [DOI] [PubMed] [Google Scholar]
- 4.Moorhouse P, Rockwood K. Frailty and its quantitative clinical evaluation. The journal of the Royal College of Physicians of Edinburgh. 2012;42:333–340. doi: 10.4997/JRCPE.2012.412. [DOI] [PubMed] [Google Scholar]
- 5.Abellan van Kan G, Rolland Y, Houles M, Gillette-Guyonnet S, Soto M, Vellas B. The assessment of frailty in older adults. Clinics in geriatric medicine. 2010;26:275–286. doi: 10.1016/j.cger.2010.02.002. [DOI] [PubMed] [Google Scholar]
- 6.Theou O, Brothers TD, Rockwood MR, Haardt D, Mitnitski A, Rockwood K. Exploring the relationship between national economic indicators and relative fitness and frailty in middle-aged and older europeans. Age and ageing. 2013 doi: 10.1093/ageing/aft010. [DOI] [PMC free article] [PubMed] [Google Scholar]
- 7.Rockwood K, Mogilner A, Mitnitski A. Changes with age in the distribution of a frailty index. Mechanisms of ageing and development. 2004;125:517–519. doi: 10.1016/j.mad.2004.05.003. [DOI] [PubMed] [Google Scholar]
- 8.Mitnitski AB, Mogilner AJ, MacKnight C, Rockwood K. The mortality rate as a function of accumulated deficits in a frailty index. Mechanisms of ageing and development. 2002;123:1457–1460. doi: 10.1016/s0047-6374(02)00082-9. [DOI] [PubMed] [Google Scholar]
- 9.Lloyd-Sherlock P, McKee M, Ebrahim S, Gorman M, Greengross S, Prince M, Pruchno R, Gutman G, Kirkwood T, O’Neill D, Ferrucci L, Kritchevsky SB, Vellas B. Population ageing and health. Lancet. 2012;379:1295–1296. doi: 10.1016/S0140-6736(12)60519-4. [DOI] [PubMed] [Google Scholar]
- 10.Kulminski A, Yashin A, Ukraintseva S, Akushevich I, Arbeev K, Land K, Manton K. Accumulation of health disorders as a systemic measure of aging: Findings from the nltcs data. Mechanisms of ageing and development. 2006;127:840–848. doi: 10.1016/j.mad.2006.08.005. [DOI] [PMC free article] [PubMed] [Google Scholar]
- 11.Mitnitski AB, Graham JE, Mogilner AJ, Rockwood K. Frailty, fitness and late-life mortality in relation to chronological and biological age. BMC geriatrics. 2002;2:1. doi: 10.1186/1471-2318-2-1. [DOI] [PMC free article] [PubMed] [Google Scholar]
- 12.Fang X, Shi J, Song X, Mitnitski A, Tang Z, Wang C, Yu P, Rockwood K. Frailty in relation to the risk of falls, fractures, and mortality in older chinese adults: Results from the beijing longitudinal study of aging. The journal of nutrition, health & aging. 2012;16:903–907. doi: 10.1007/s12603-012-0368-6. [DOI] [PubMed] [Google Scholar]
- 13.Garcia-Gonzalez JJ, Garcia-Pena C, Franco-Marina F, Gutierrez-Robledo LM. A frailty index to predict the mortality risk in a population of senior mexican adults. BMC geriatrics. 2009;9:47. doi: 10.1186/1471-2318-9-47. [DOI] [PMC free article] [PubMed] [Google Scholar]
- 14.Mitnitski A, Song X, Skoog I, Broe GA, Cox JL, Grunfeld E, Rockwood K. Relative fitness and frailty of elderly men and women in developed countries and their relationship with mortality. Journal of the American Geriatrics Society. 2005;53:2184–2189. doi: 10.1111/j.1532-5415.2005.00506.x. [DOI] [PubMed] [Google Scholar]
- 15.Velanovich V, Antoine H, Swartz A, Peters D, Rubinfeld I. Accumulating deficits model of frailty and postoperative mortality and morbidity: Its application to a national database. The Journal of surgical research. 2013 doi: 10.1016/j.jss.2013.01.021. [DOI] [PubMed] [Google Scholar]
- 16.Tsiouris A, Hammoud ZT, Velanovich V, Hodari A, Borgi J, Rubinfeld I. A modified frailty index to assess morbidity and mortality after lobectomy. The Journal of surgical research. 2012 doi: 10.1016/j.jss.2012.11.059. [DOI] [PubMed] [Google Scholar]
- 17.Obeid NM, Azuh O, Reddy S, Webb S, Reickert C, Velanovich V, Horst HM, Rubinfeld I. Predictors of critical care-related complications in colectomy patients using the national surgical quality improvement program: Exploring frailty and aggressive laparoscopic approaches. The journal of trauma and acute care surgery. 2012;72:878–883. doi: 10.1097/TA.0b013e31824d0f70. [DOI] [PubMed] [Google Scholar]
- 18.McKeown T, Brown RG, Record RG. An interpretation of the modern rise of population in europe. Population studies. 1972;26:345–382. [PubMed] [Google Scholar]
- 19.WHO. [Accessed march 30, 2013];The determinants of health [internet] Available from http://www.Who.Int/hia/evidence/doh/en/
- 20.Marmot M, Allen J, Bell R, Bloomer E, Goldblatt P Consortium for the European Review of Social Determinants of H the Health D. Who european review of social determinants of health and the health divide. Lancet. 2012;380:1011–1029. doi: 10.1016/S0140-6736(12)61228-8. [DOI] [PubMed] [Google Scholar]
- 21.Macklai NS, Spagnoli J, Junod J, Santos-Eggimann B. Prospective association of the share-operationalized frailty phenotype with adverse health outcomes: Evidence from 60+ community-dwelling europeans living in 11 countries. BMC geriatrics. 2013;13:3. doi: 10.1186/1471-2318-13-3. [DOI] [PMC free article] [PubMed] [Google Scholar]
- 22.Romero-Ortuno R, Kenny RA. The frailty index in europeans: Association with age and mortality. Age and ageing. 2012;41:684–689. doi: 10.1093/ageing/afs051. [DOI] [PMC free article] [PubMed] [Google Scholar]
- 23.Searle SD, Mitnitski A, Gahbauer EA, Gill TM, Rockwood K. A standard procedure for creating a frailty index. BMC geriatrics. 2008;8:24. doi: 10.1186/1471-2318-8-24. [DOI] [PMC free article] [PubMed] [Google Scholar]
- 24.Dorner TE, Rieder A. obesity paradox or reverse epidemiology: Is high body weight a protective factor for various chronic conditions. Deutsche medizinische Wochenschrift. 2010;135:413–418. doi: 10.1055/s-0030-1249178. [DOI] [PubMed] [Google Scholar]
- 25.Wang C, Song X, Mitnitski A, Yu P, Fang X, Tang Z, Shi J, Rockwood K. Gender differences in the relationship between smoking and frailty: Results from the beijing longitudinal study of aging. The journals of gerontology. Series A, Biological sciences and medical sciences. 2013;68:338–346. doi: 10.1093/gerona/gls166. [DOI] [PubMed] [Google Scholar]
- 26.Braveman P, Egerter S, Williams DR. The social determinants of health: Coming of age. Annual review of public health. 2011;32:381–398. doi: 10.1146/annurev-publhealth-031210-101218. [DOI] [PubMed] [Google Scholar]
- 27.Woo J, Goggins W, Sham A, Ho SC. Social determinants of frailty. Gerontology. 2005;51:402–408. doi: 10.1159/000088705. [DOI] [PubMed] [Google Scholar]
- 28.Leigh JP, Fries JF. Frailty and education in the hispanic health and nutrition examination survey. Journal of health care for the poor and underserved. 2002;13:112–127. doi: 10.1353/hpu.2010.0307. [DOI] [PubMed] [Google Scholar]
- 29.Fried LP, Tangen CM, Walston J, Newman AB, Hirsch C, Gottdiener J, Seeman T, Tracy R, Kop WJ, Burke G, McBurnie MA Cardiovascular Health Study Collaborative Research G. Frailty in older adults: Evidence for a phenotype. The journals of gerontology. Series A, Biological sciences and medical sciences. 2001;56:M146–156. doi: 10.1093/gerona/56.3.m146. [DOI] [PubMed] [Google Scholar]
- 30.Etman A, Burdorf A, Van der Cammen TJ, Mackenbach JP, Van Lenthe FJ. Socio-demographic determinants of worsening in frailty among community- dwelling older people in 11 european countries. Journal of epidemiology and community health. 2012;66:1116–1121. doi: 10.1136/jech-2011-200027. [DOI] [PubMed] [Google Scholar]
- 31.Espinoza SE, Jung I, Hazuda H. Frailty transitions in the san antonio longitudinal study of aging. Journal of the American Geriatrics Society. 2012;60:652–660. doi: 10.1111/j.1532-5415.2011.03882.x. [DOI] [PMC free article] [PubMed] [Google Scholar]
- 32.Wong CH, Weiss D, Sourial N, Karunananthan S, Quail JM, Wolfson C, Bergman H. Frailty and its association with disability and comorbidity in a community-dwelling sample of seniors in montreal: A cross-sectional study. Aging clinical and experimental research. 2010;22:54–62. doi: 10.1007/BF03324816. [DOI] [PubMed] [Google Scholar]
- 33.Szanton SL, Seplaki CL, Thorpe RJ, Jr, Allen JK, Fried LP. Socioeconomic status is associated with frailty: The women s health and aging studies. Journal of epidemiology and community health. 2010;64:63–67. doi: 10.1136/jech.2008.078428. [DOI] [PMC free article] [PubMed] [Google Scholar]
- 34.Peek MK, Howrey BT, Ternent RS, Ray LA, Ottenbacher KJ. Social support, stressors, and frailty among older mexican american adults. The journals of gerontology. Series B, Psychological sciences and social sciences. 2012;67:755–764. doi: 10.1093/geronb/gbs081. [DOI] [PMC free article] [PubMed] [Google Scholar]
- 35.Syddall H, Roberts HC, Evandrou M, Cooper C, Bergman H, Aihie Sayer A. Prevalence and correlates of frailty among community-dwelling older men and women: Findings from the hertfordshire cohort study. Age and ageing. 2010;39:197–203. doi: 10.1093/ageing/afp204. [DOI] [PMC free article] [PubMed] [Google Scholar]
- 36.Lang IA, Hubbard RE, Andrew MK, Llewellyn DJ, Melzer D, Rockwood K. Neighborhood deprivation, individual socioeconomic status, and frailty in older adults. Journal of the American Geriatrics Society. 2009;57:1776–1780. doi: 10.1111/j.1532-5415.2009.02480.x. [DOI] [PubMed] [Google Scholar]
- 37.Gu D, Dupre ME, Sautter J, Zhu H, Liu Y, Yi Z. Frailty and mortality among chinese at advanced ages. The journals of gerontology. Series B, Psychological sciences and social sciences. 2009;64:279–289. doi: 10.1093/geronb/gbn009. [DOI] [PMC free article] [PubMed] [Google Scholar]
- 38.Kim S, Welsh DA, Cherry KE, Myers L, Jazwinski SM. Association of healthy aging with parental longevity. Age. 2012 doi: 10.1007/s11357-012-9472-0. [DOI] [PMC free article] [PubMed] [Google Scholar]
- 39.Napolioni V, Lucarini N. Gender-specific association of ada genetic polymorphism with human longevity. Biogerontology. 2010;11:457–462. doi: 10.1007/s10522-010-9266-7. [DOI] [PubMed] [Google Scholar]
- 40.Montesanto A, Latorre V, Giordano M, Martino C, Domma F, Passarino G. The genetic component of human longevity: Analysis of the survival advantage of parents and siblings of italian nonagenarians. European journal of human genetics: EJHG. 2011;19:882–886. doi: 10.1038/ejhg.2011.40. [DOI] [PMC free article] [PubMed] [Google Scholar]
- 41.Goggins WB, Woo J, Sham A, Ho SC. Frailty index as a measure of biological age in a chinese population. The journals of gerontology. Series A, Biological sciences and medical sciences. 2005;60:1046–1051. doi: 10.1093/gerona/60.8.1046. [DOI] [PubMed] [Google Scholar]
- 42.Sirven N. On the socio-economic determinants of frailty: Findings from panel and retrospective data from share. IRDES Working Document. 2012 [Google Scholar]
Associated Data
This section collects any data citations, data availability statements, or supplementary materials included in this article.