

Abstract
Photonic crystal surfaces offer a compelling platform for improving the sensitivity of surface-based fluorescent assays used in disease diagnostics. Through the complementary processes of photonic crystal enhanced excitation and enhanced extraction, a periodic dielectric-based nanostructured surface can simultaneously increase the electric field intensity experienced by surface-bound fluorophores and increase the collection efficiency of emitted fluorescent photons. Through the ability to inexpensively fabricate photonic crystal surfaces over substantial surface areas, they are amenable to single-use applications in biological sensing, such as disease biomarker detection in serum. In this review, we will describe the motivation for implementing high-sensitivity, multiplexed biomarker detection in the context of breast cancer diagnosis. We will summarize recent efforts to improve the detection limits of such assays though the use of photonic crystal surfaces. Reduction of detection limits is driven by low autofluorescent substrates for photonic crystal fabrication, and detection instruments that take advantage of their unique features.
Background and Motivation
Protein biomarkers in blood have a great deal of promise for facilitating personalized medicine, including detection, diagnosis, prognosis, and monitoring of therapy. Even so, it is widely recognized that these circulating biomarkers are highly variable across individuals, and that it likely will be necessary to identify a panel of biomarkers before blood-based protein detection will be useful for any disease. However, analysis of a panel of biomarkers creates its own problems. In 2005, Anderson [1] estimated that the development of 5 separate protein assays will cost $10–20 million to achieve US Food and Drug Administration approval, and that developing larger sets of biomarkers will be progressively more costly and less worthwhile to diagnostic companies. Because there is much less money from diagnostics (compared to drugs), companies are commonly unwilling to make this type of investment in diagnostic development. Thus, the situation is that it is widely recognized that multiplexed protein assays are needed for diagnostic purposes, but it is financially impractical to get these assays into the clinic where they can benefit patients. Although many analytical approaches have been proposed for multiplexed biomarker analysis, most of these lack the sensitivity to detect the low-abundance proteins that are likely to be useful as biomarkers. For example, in the case of cancer, the goal of early detection is to identify tumors when they are small and not markedly differentiated from the normal tissue.
One common methodology for multiplexed, sandwich ELISA analysis are the bead-based approaches and electrochemiluminescence. However, these approaches require expensive detection instruments and typically use much larger volumes of blood than available in a pin prick, and therefore appear to be poorly suited for point-of-care diagnostics. Meanwhile, antibody microarrays are reported to optimally use 3 to 5 μl of sample [2, 3], lack assay crosstalk, demonstrate the fastest binding kinetics, and provide lower limits of detection than bead-based assays due to the ability to wash away unbound material. Using a photonic crystal surface to enhance the fluorescence output from a biomarker microarray, it is our goal to further improve the sensitivity of this platform to enable more rapid high sensitivity detection. Our goal is a more compact, inexpensive instrument than approaches that use optically passive surfaces for a microarray assay.
An example of a disease where analysis of low-abundance protein biomarkers diagnostics is likely to be beneficial is breast cancer. At present, the best way for a woman to reduce her overall risk of developing breast cancer appears to be changes in exercise or diet. Beyond these steps there is little that modern science can recommend to reduce a woman’s risk of developing or dying from breast cancer. Most breast cancer deaths are caused by metastatic disease, highlighting the importance of regular screening for early detection. However, existing screening methods have major shortcomings regarding early detection of breast cancer [4, 5]. Notably, these approaches cannot distinguish cancer from benign breast disease and sometimes even normal breast tissue, resulting in high rates of false positives [6]. The most extensive analysis of mammography [7] found that the area under the receiver operating curve (AUC) value for mammography was approximately 0.80. An earlier meta-analysis of six randomized trials suggested that regular mammography screening reduces the risk of dying from breast cancer by 22% but it is widely recognized that this screening method has little benefit for women under 50 years of age [8–10]. The high false positive rate for mammography has become a controversial issue in the last two years, and has been reported on by the popular press (e.g., WIRED magazine, Jan. 2009, “The Truth About Cancer”; or Newsweek, Feb. 7 2011, “The Mammogram Hustle”). These articles highlight that the high false-positive rate associated with mammography is very stressful for women, and leads to unnecessary biopsies. As a result, women are questioning whether it is worthwhile to undergo regular screening for breast cancer. Indeed, there is evidence that the longer the time between when a woman receives a false-positive mammogram and the identification of benign disease, the less likely it is that the woman will return for future mammograms [11]. It seems clear that new tests that complement mammography could improve the chances of successful medical intervention when breast cancer does occur, reduce stress associated with false-positive screens, and generally help to restore faith in a useful, if imperfect, screening tool. Therefore, the ultimate goal of our work is to develop a point-of-care analysis system that can rapidly distinguish between true and false positive mammograms using blood obtained from a pinprick.
Analysis of circulating proteins that are secreted by cancer cells is a potentially valuable complement to mammography. Our data suggest that the use of biomarker assays as an early-stage diagnostic test have been problematic due to the phenotypic diversity of breast cancer [12]. That is, five major subtypes of breast cancer have been identified based on both gene expression and protein profiles in tumor tissue [13–17], and these profiles are closely associated with traditional histological classifiers related to the overexpression of estrogen receptor (ER+) and/or the HER2 receptor (HER2+) [15, 18]. One of us (Zangar) recently identified a panel of 10 biomarkers in serum that is able to discriminate between subtypes of breast cancer and benign controls, when both cases and benign controls were originally identified as a “positive” by mammography [12]. These results were obtained with a “sandwich enzyme-linked immunosorbent assay (ELISA) microarray”, which is a sophisticated platform for simultaneous analysis of multiple protein biomarkers.
A significant challenge with developing a useful point-of-care instrument is sufficient sensitivity for quantifying low-abundance cancer biomarkers. In this regard, the development of surface structures and detection instruments that can augment the detection sensitivity of fluorescent ELISA assays has the potential for increasing the signal/noise ratio of detection results for greater statistical surety and reduction of the detection limits. Recent research by the Cunningham Group at the University of Illinois has demonstrated that a nanostructured photonic crystal (PC) optical surface is capable of amplifying the signal of fluorescent dyes by >500x. PCs can be inexpensively manufactured from plastic, glass, or quartz materials and incorporated onto ordinary glass microscope slides. The Zangar Group at Pacific Northwest National Laboratory has developed a sophisticated multiplexed ELISA microarray platform for multiplexed characterization of biomarkers in serum
Here, we review efforts towards development and implementation of a point-of-care instrument for multiplex biomarker analysis that can be used to differentiate between true- and false-positive mammograms and could also be broadly applied to a wide variety of multiplexed assays. The analysis would be comprised of a multi-assay protein implemented within a single-use, disposable cartridge that utilizes microfluidics and a PC surface. Reaching this goal requires statistically validated selection of biomarker proteins, thorough characterization of capture antibodies for lack of cross-reactivity with other analytes, a robust assay protocol, development of low-cost and uniform fabrication methods for making PC surfaces, and development of a detection system for optimally interfacing with the PC.
Microspot Fluorescent ELISA Assays – A Tool for Multiplexed Biomarker Analysis
ELISA-based detection has been the mainstay of clinical laboratories for decades, but generally has not been compatible with high throughput and multiplexing with a limited sample volume. Protein microarrays permit the simultaneous measurement of many proteins in a small sample volume, therefore providing an attractive alternative approach for quantification of multiple proteins in serum [19, 20] for clinical applications, as demonstrated by several groups [21–23] for detection of cancer biomarkers including prostate specific antigen (PSA), IL-6, and hepatocyte growth factor (HGF) [24, 25]. The sandwich ELISA is inherently a quantitative assay that relies on a set of external standards (i.e. purified antigens) for quantitation. Zangar and coworkers demonstrated that single ELISAs do not discriminate well between cancer patients and healthy controls, but that the combination of 10 assays can identify consistent trends that broadly characterize the presence of cancer [24, 26–28]. Antibody microarrays using secondary antibodies with fluorescent tags have demonstrated the ability to classify metastatic breast cancer based on a blood test [29, 30] with sensitivities in the sub-pg/ml range, therefore sub-pg/ml-scale concentration differences between similar samples are measurable.
The sandwich ELISA in a microarray format (Figure 1) is well suited for clinically relevant analyses [31, 32]. This is because the sandwich ELISA is the standard assay used in the clinic for analyzing low-abundance proteins in complex biological fluids such as blood. Like the clinical assays, the ELISA microarray assays are exceptionally sensitive, being able to accurately quantify proteins down to the single-digit or sub-pg/ml concentrations [32]. The biomarkers that have been found to be suitable for the detection of early-stage cancer are low-abundance proteins that commonly cannot be detected by methods other than sandwich ELISA. This result is not surprising, since it seems unlikely that small tumors will consistently alter levels of abundant proteins. Therefore, we are only employing the most sensitive and specific assay available (i.e., sandwich ELISA) for biomarker analysis.
Figure 1.

A. Schematic diagram of the current ELISA microarray platform. Conventional glass microscope slides (1×3 in2) are printed with 16 identical wells, with vertical spacing that is the same as a 96-well microplate. B. Each well contains an ELISA microarray chip with over 20 assays, each printed in quadruplicate, and wells are exposed to an analyte concentration series diluted into calf serum. C. Data is processed using our custom software suite, which includes the Protein Microarray Analysis Tool (ProMAT) to produce dose-response calibration curves and limit of detection analysis. The analysis plots the coefficient of variability (CV) for the replicate spots as a function of analyte concentration, demonstrating the concentration range within which the an assay performed upon a sample of unknown concentration would have predictive power. D. Example dose-response curve for the biomarker enzyme matrix metalloproteinase 1 (MMP1), demonstrating a sigmoidal dependence between fluorescence output and MMP1 concentration. Limits of detection are determined at the concentration at which the signal can no longer be differentiated from zero concentration.
The assay is performed by deposition of array of antibody capture spots upon a substrate (such as glass, or alternatively a PC), using several replicate spots per antibody to enable observation of experimental variability. After a “blocking” step that covers the substrate surface with molecules that inhibit subsequent nonspecific binding, the chip is exposed to the test sample, providing opportunity for analyte molecules to bind with their corresponding capture antibodies [33, 34]. Biotin-linked secondary antibodies for each of the assays are combined and exposed to the chip as a mix, where they bind an unoccupied epitope of the targeted captured antigen. Commercially available capture and detection antibodies have been selected for each biomarker and rigorously tested to demonstrate that there is no nonspecific cross reactivity between any of the assay reagents [35]. The final assay step is introduction of fluorophore-labeled streptavidin that attaches only to the biotinylated detection antibodies. Full details of the procedure have been published in several papers by the Zangar Group [31, 36–41].
The ELISA microarray platform routinely generates standard curves (Figure 1c–d) that cover up to a 100-fold range of protein concentrations [32], bracketing the variation in most circulating biomarkers. We originally demonstrated that levels of hepatocyte growth factor (HGF) were elevated in sera from recurrent breast cancer patients, even though HGF accounted for less than 10 parts per billion of the total protein content in those serum samples. Results from the HGF microarray ELISA also correlated well (r2 = 0.90) with a commercial 96-well ELISA analysis for this same set of blood samples. For this “5-plex” analysis, we not only used physiologically relevant concentrations of each antigen but, in order to challenge the assay system, we selected antigens that normally vary in concentration in serum by a factor of 3000. Therefore, our ability to simultaneously detect all 5 proteins on a single chip demonstrates the versatility of the ELISA microarray system for detecting multiple proteins that are at highly variable concentrations. Overall, our data demonstrate that this ELISA microarray platform is suitable for quantifying trace quantities of multiple proteins in complex protein mixtures.
Photonic Crystal Enhanced Fluorescence (PCEF)
While the first demonstrations of enhanced fluorescence appeared shortly after the discovery of surface enhanced Raman scattering almost three decades ago [42–44], the application of this method to improving bioassays has only occurred recently, as the use of fluorescence for standard protocols in life sciences research has become increasingly popular in the past decade. Enhancing fluorescence typically relies on an interaction between a fluorophore and a resonant optical structure, the most common of which are metal nanoparticles with surface plasmon resonances. These resonances can affect fluorophores in a variety of ways: they can amplify excitation light [45], alter the spatial distribution of the fluorophore emission [46], modify the radiative lifetime of the fluorophore [47], or simultaneously perform more than one of these functions [48–50], but fluorophores in close proximity to metals (within 10 nm) often transfer their energy non-radiatively as well [51] [52] [53]. Fluorescence enhancement using metal surfaces or metal nanoparticles suffers from quenching if the fluorophore is too close to the metal, while electromagnetic fields associated with localized surface plasmons decay rapidly with distance as one moves away from the metal – resulting in very stringent requirements for surface-fluorophore spacing [54]. The low Quality-factor of metal-based resonances, due to optical absorption, further reduces the achievable amplification factor for metal-enhanced fluorescence [55, 56]. Semiconductor quantum dots (QDs) may also be used to enhance the sensitivity of fluorescence-based assays, and have demonstrated that QD fluorescence may also be enhanced on a photonic crystal surface [57–59].
PCs, or periodic arrangements of materials with differing dielectric constants, are an alternate substrate for enhancing fluorescence. The PCs used in our research are comprised of a periodically modulated low refractive index SiO2 surface structure coated with a high refractive index dielectric layer of TiO2, in which the period is smaller than the wavelength of light used to excite the structure (Figure 2a). A resonance in this structure is excited when evanescent diffracted orders couple to modes of an effective high refractive index layer, and are re-radiated through diffraction in-phase with the reflected zeroth-order wave and out-of-phase with the transmitted zeroth-order wave [60]. The dispersion of the PC then reveals these resonances as transmission dips upon white light illumination, resulting from the coupling of light at specific incidence angles and wavelengths to the structure. These resonances are capable of enhancing fluorescence in a similar fashion to surface plasmon resonances, taking advantage of two phenomena: enhanced excitation and enhanced extraction. Enhanced excitation is the result of incident radiation coupling to a PC resonance, which increases the local electric field intensity throughout the structure. These fields decay exponentially like internally reflected waves as in total internal reflection fluorescence (TIRF) microscopy, but the resonance coupling provides a constructive interference effect that amplifies the incident wave [58]. Thus enhanced excitation provides the benefit of localized surface-bound fluorophore excitation observed with TIRF, but with increased performance due to field enhancement. Multiplied with this enhancement effect is enhanced extraction, whereby fluorophore emission couples to the PC and is redirected along the PC dispersion [57]. This mechanism helps to claim emitted light that otherwise may have been lost to guided modes within the substrate or to emission at oblique angles not collected by the detection optics. While the first demonstrations of PC enhanced fluorescence for microarray dyes required expensive lithographic procedures for each device [61, 62], inexpensive and uniform fabrication over large areas in a nanoreplica molding process currently used to make commercial label-free biosensors [63] has since been employed to make these structures. This process provides an optically active surface capable of providing uniform fluorescence enhancement over large areas inexpensively without the quenching effects that may limit metal enhanced fluorescence approaches.
Figure 2.

A. Photonic crystal device structure fabricated on a low autofluorescence quartz substrate by nanoimprint lithography. The structure is comprised of a low refractive index quartz substrate with a periodic array of linear grooves, with a period of 400 nm. The quartz grating is overcoated with a thin film of TiO2 to generate a photonic crystal with optical resonances at desired wavelengths. B. SEM photo of a fabricated PC surface. C. Photo of an entire 1×3 in2 microscope slide populated with a PC surface.
Recently, PCs have been engineered by the Cunningham Group to enhance the signal from the common microarray dye Cyanine-5 (Cy5) by more than one order of magnitude when scanned in a commercial microarray scanner [64], and by greater factors when scanned by a system that is optimized for coupling light to/from the PC[65]. The PCs used to enhance fluorescence are periodic one-dimensional gratings designed by Rigorous Coupled-Wave Analysis with period Λ = 360 nm and a grating step height h = 60 nm, described in previous work [64] and diagrammed in Figure 2a. Plastic-based PCs described in previous publications by the Cunningham Group for microarrays were composed of nanoreplica-molded UV-cured polymer (UVCP) with a refractive index of nUVCP = 1.45, a 300 nm SiO2 spacer layer (nSiO2 = 1.45) (to displace resonant electric fields away from the UVCP, reducing background fluorescence), and a high-refractive index 160 nm TiO2 layer (nTiO2 = 2.35) required to generate the periodic contrast in refractive index. These PCs provide two distinct resonances: a narrow Transverse Magnetic (TM) resonance at λ~633 nm for enhanced excitation, and a wide Transverse Electric (TE) resonance at λ~690 nm for enhanced extraction. The PCs cover entire 1 × 3 in2 microscope slides for compatibility with conventional microarray spotting and hybridization systems. As shown in Figure 3a, the evanescent electric field that is excited by illuminating the PC at the combination of incident angle and wavelength that satisfies the resonant coupling condition (in this case λ=633 nm, and θ=0 deg) extends ~200 nm from the PC surface into the adjacent media (air, in this case). Figure 3b shows example enhancement of Cy5-labeled PPL spots measured with a custom-built fluorescence microscope designed for optimization of enhanced excitation and enhanced extraction [66].
Figure 3.
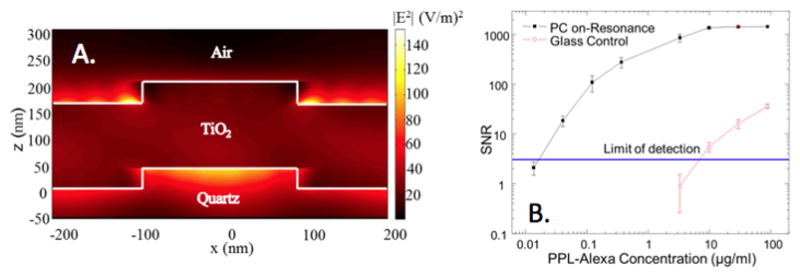
A. Evanescent field profile (simulated by rigorous coupled wave analysis) of a PC surface illuminated at the resonant condition, demonstrating an electric field magnitude magnitude that is greater than the magnitude of the electric field supplied by a plane wave illumination source incident from below. To represent the power associated with the evanescent field, the squared magnitude of the electric field is plotted (in units of (V/m)2, and the illumination source has a magnitude of unity. B. Signal-to-noise ratio (SNR) for detection of fluorophore-tagged poly-phe-lysine (PPL) spots applied to a PC surface or a glass surface, as a function of PPL/dye concentration, demonstrating that compared to performing detection of the same material on a glass surface, the PC provides up to three orders of magnitude greater fluorescent signal. Here, the PC is demonstrated to reduce limits of detection by over two orders of magnitude using a custom detection instrument that supplies collimated illumination at the angle of resonant coupling. Used with permission from A. Pokhriyal, et al., Optics Express, Vol. 18, No. 24, p. 24793–24808, 2010.
PCEF for Breast Cancer Biomarkers
Recently, we have demonstrated PCEF for a breast cancer biomarker protein microarray with >20 multiplexed assays. Results demonstrating fluorescent images of an array, a dose/response curve for one of the assays, and results showing the increase in fluorescence output for simultaneous detection of 15 analytes in a mixed sample (Figure 4). Full details of the assay protocol and PC device design are published in [28] and [39]. Use of the PC resulted in an ~10x improvement in the limit of detection for all assays. Greater reductions have been demonstrated using new PC designs [67–71], but have not yet been applied to ELISA microarrays. The PC is designed to increase the fluorescence intensity of Cy5 dyes (or equivalent AlexaFluor dyes) through the enhanced excitation and extraction mechanisms described previously. The effects of PC enhanced excitation can be determined by comparing the fluorescence output under the following two conditions: (a) when the excitation laser incident angle is adjusted to illuminate the PC at the resonant angle (“on-resonance”), and (b) when the excitation angle of incidence is selected to not coincide with the resonant coupling condition (“off-resonance”). Here, the on-resonant angle of illumination is ~0°, while the off-resonant angle is 20°. The fluorescent image of one block selected from the array exposed to the first dilution (maximum concentration divided by seven) is used to illustrate the observed signal enhancement when the PC is imaged on-resonance. The fluorescent images shown in Figure 4a are obtained using identical laser power and photomultiplier tube (PMT) gain settings in a commercially available confocal microarray scanner (Tecan LS). It can be observed in Figure 4c that by scanning the PC at its resonant angle, the fluorescence intensity is enhanced by factors of 11- to 20-fold.
Figure 4.

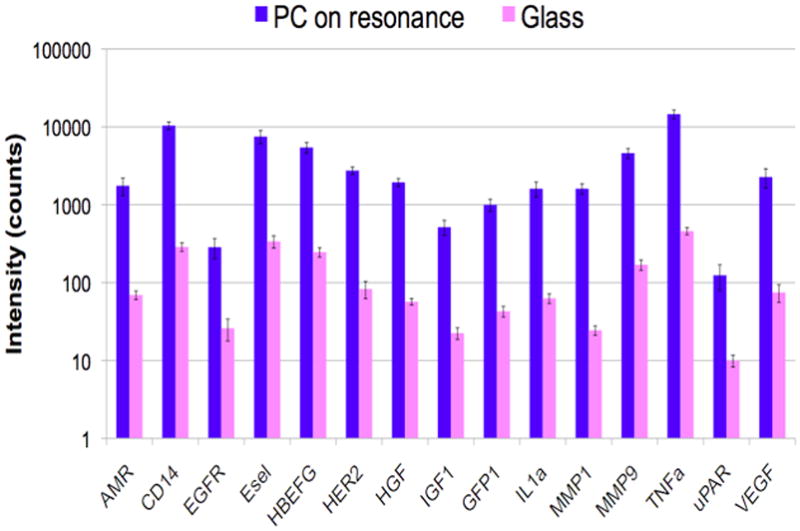
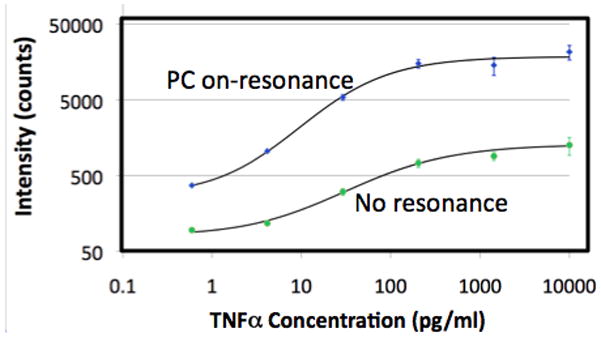
A. Confocal laser-scanned microarray images of Cy5 labeled protein microarray spots on a PC and glass surface after exposure to 20 cytokines, demonstrating that the PC increases with fluorescent signal for a microspot ELISA assay. B. Comparison of fluorescence intensity on PC surface and a glass surface for simultaneous detection of 15 biomarkers, demonstrating that signal-to-noise is increased for every assay in the array. C. Dose/response characterization for one of the biomarkers within the array – Tumor Necrosis Factor Alpha (TNFα) comparing a glass surface (green) to a PC surface (blue). Used with permission from C.-S. Huang et al., Analytical Chemistry, Vol. 83, No. 4, p. 1425–1430, 2011.
In order to determine the limits of detection, it is necessary to characterize the noise in terms of the magnitude of background fluorescence and the standard deviation of control spot background intensity, where the negative control is a spot printed only with buffer. The PC will enhance the output of any fluorophore within the evanescent field region, regardless of whether the source of the fluorescence is the Cy5 tag, autofluorescent material within the device structure, or autofluorescence from the chemical functionalization layer. Likewise, any nonspecific attachment of the SA-Cy5 tag to regions outside the capture spots will increase the level of background fluorescent intensity. When the PC is on-resonance, the background intensity is ~4–5-fold higher compared to the off-resonance condition. Due to the enhanced electric field on the PC surface, at resonance, the PC enhances both the spot intensity as well as the background intensity. Even so, the overall signal-to-noise ratio for the assays are improved because the magnitude of the PC enhancement is greater within the capture spots than in the regions between the spots. As shown in Figure 4c, the fluorescence signal was ~10-fold higher for the functioning assays when the PC is on-resonance compared to off-resonance at the first dilution. As an example, we found that the increase in signal-to-noise ratio (SNR) is particularly important for detecting antigens EGFR and uPAR at concentrations as low as 3.6 and 7.1 ng/ml, respectively, limited by the affinity of the capture antibody. When the PC is off-resonance, the spot signals for EGFR and uPAR at these same concentrations were noise-limited (SNR <3), which is to say that their spot intensities cannot be differentiated from the noise of the fluorescence in regions between spots. In contrast, these same spots were easily detectable (SNR >8) when the PC was at resonance. The ability to detect reduced concentrations of such antigens is extremely important to the early detection of disease biomarkers, which in general are present at very low concentrations in biological fluids such as plasma or serum.
The signal intensities from each dilution in the concentration series were used to generate standard curves using the Protein Microarray Analysis Tool (ProMAT) software, developed by Pacific Northwest National Laboratory. As an example, Figure 4b shows the standard curves for TNFα when the PC is on-resonance and off-resonance. We found that when on-resonance, the PC demonstrated better precision as indicated by the steeper slope in the linear region of the standard curves, and ~10-fold reduced limit of detection (LOD).
Current and Future Work: Improving the Performance of PCEF for ELISA Microarrays
While recent results [38] demonstrate that PCEF using a plastic-based device and a commercially available confocal microarray scanner can be used to achieve a 10x reduction in the limits of detection (LOD) of an ELISA microarray for breast cancer biomarkers in serum. This approach can be improved to further reduce LOD and to increase signal-to-noise ratio by addressing three fundamental issues that have been found to limit performance.
First, PCEF will enhance the fluorescent output of not only the Cy5 label of the assay, but also any other source of fluorescent background. We have identified the two most important sources of background fluorescence for PCEF-based ELISA microarrays: the plastic substrate material of the replica molded PC grating structure, and nonspecific attachment of Streptavidin-Cy5 to regions between the capture spots. We have demonstrated that PC surfaces produced upon quartz substrates using nanoimprint lithography to create the grating structure eliminates device-based background fluorescence to undetectable levels, even after amplification [66]. We have also found that the remaining source of background fluorescence originates from capture antibody molecules that diffuse from their spot locations to the remainder of the array surface during the blocking step of the assay. We have demonstrated that application of capture spots by Dip Pen Nanolithography (DPN) addresses this source of background fluorescence (Figure 5) by eliminating the presence of extraneous (i.e. not covalently bound) capture antibody, compared to conventional pin-based or piezoelectric valve-based microarray spot dispensing. DPN provides an additional advantage in its capability for producing capture spots with diameters in the 10–30 μm range, thus enabling the ELISA to be further miniaturized. As a preliminary demonstration, the a DPN tool (NanoInk) was used to create an array of 50 capture antibody spots (10 antibodies, 5 replicates) on a quartz-based PC surface. Using the tip of the DPN tool (Figure 5a) on an epoxysilane-coated surface, ~30 μm diameter capture spots were printed. On a single PC surface, separate arrays were printed, so as to perform the dose-response analysis shown in Figure 5c with 9 dilutions of the spiked analytes in buffer, plus a negative control. The same ELISA protocol described earlier (blocking, secondary antibody mix, label) was used. As shown in Figure 5d, the limits of detection are in the range of 0.38 – 11 pg/ml (dependent on the binding affinity of the capture antibody).
Figure 5.

Multiplexed detection of several biomarkers in buffer using a PC surface and antibody capture spots applied by DPN. A. Image of ~30 μm diameter assay spots in 5x replicates after Cy5 tagging for a positive control (application of dye-labeled antibody) and several biomarkers, with five replicate spots per assay. B. Dose/response curves for a biomarker assay comprised of simultaneous detection of 10 analytes. C. Limits of detection for each assay.
The use of DPN provides several important benefits. First, DPN reduces the volume of capture molecule required to ~0.1 pl/spot. Second, DPN enables uniform capture molecule density within a 30 μm spot without crossover into adjacent regions, which enables minimization of the surface area required for the assay. Third, and perhaps most importantly, we observed that DPN-based deposition of capture antibody reduced background fluorescence intensity by an order of magnitude, compared to conventional pin-based spotting. We hypothesize that conventional quill-pin or piezo-valve spotters leave some capture antibodies unattached to the sensor surface, which in turn have the ability to re-attach to the sensor during subsequent rinsing and blocking steps. DPN minimizes the number of capture molecules present on the surface therefore increasing binding efficiency, and reducing the possibility for nonspecific binding to regions between the spots.
A second important aspect of using PC surfaces to further reduce biomarker detection limits involves the design of the detection instrument optics. The greatest PCEF enhancement factors are achieved through the use of collimated, rather than focused laser illumination [72, 73]. The resonant coupling condition for enhanced excitation occurs for a narrow range of incident angles for a given illumination wavelength. Focused light provided by a confocal laser scanner contains a range of incident angles, of which only a fraction can fully engage in resonant coupling. To address this issue, the Cunningham Group has designed and constructed a PCEF microarray detection instrument that provides collimated illumination and the ability to tune the incident angle to precisely match the resonant coupling condition [73]. This system has been used to achieve an enhancement factor as high as 1,500 for the detection of dye spin-coated upon the PC, compared to detecting the same material on an unpatterned quartz surface. The detection of dye-labeled protein spots on the PC exhibited a 690–fold increase in fluorescence intensity and a 330-fold improvement in signal-to-noise ratio (SNR). Using dose-response characterization of deposited fluorophore-tagged protein spots, the PCEF surface demonstrated a 140x lower limit of detection compared to a conventional glass substrate [66].
The third factor impacting achievable LOD is determined not only by the α fluorescent signal for the lowest analyte concentrations, but also by the standard deviation of fluorescent intensities obtained from replicate spots. Therefore, any source of assay nonuniformity (surface chemistry density or capture antibody density for example) will negatively impact LOD. We have recently shown that conventional sources of assay nonuniformity are actually magnified by PCEF because regions with different densities of immobilized molecules have slightly different resonant coupling conditions. We have quantified the typical variability in capture antibody density in an ELISA microarray and have clearly demonstrated that spots display different enhancement factor values based on their density [74]. To address this issue, we recently developed [72] an incident angle scanning approach that maximizes the enhancement factor for an entire microarray on a pixel-by-pixel basis. The benefits of the angle-scanning detection approach can be seen in Figure 6, in which the biomarker TNF is detected over a range of concentrations in buffer, using 9 replicate spots for each concentration. Figure 6a shows the fluorescent image gathered from the PC surface when scanning at a fixed incident angle while Figure 6b shows the fluorescent image gathered by the angle-scanning approach in which the highest fluorescent intensity is selected for each pixel. The images and corresponding data (Figure 6c) show that the angle scanning approach dramatically lowers the assay CV by >75%, as it accounts for the presence of small spatial variability in the PC resonant coupling condition and variability in the capture spot density.
Figure 6.
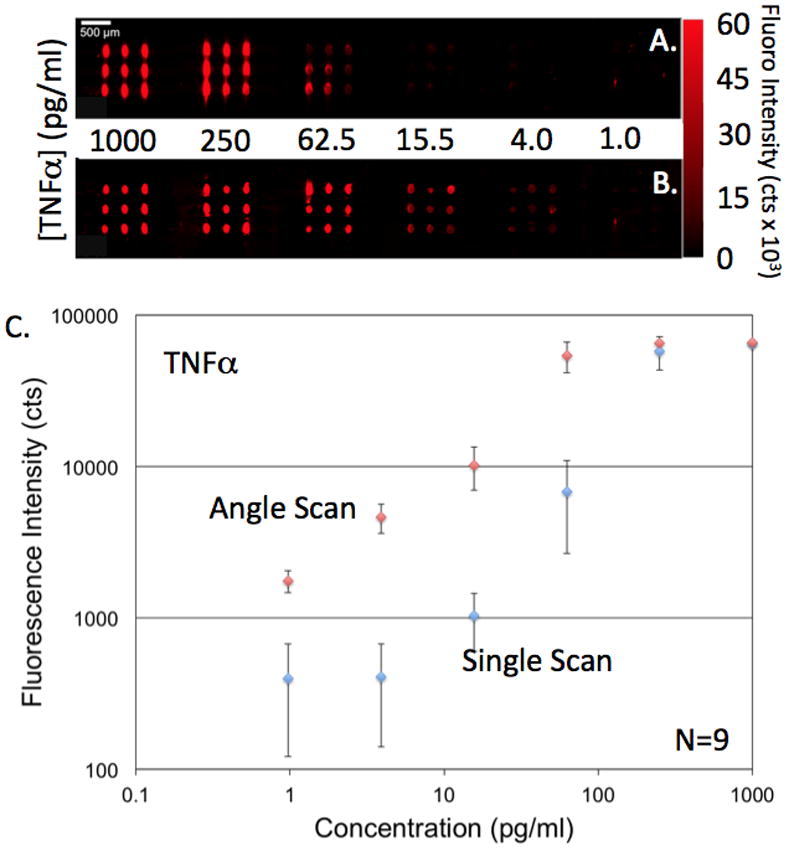
Example increase in detection sensitivity and reduction in CV obtained using an array scanning approach using multiple incident angles of illumination to optimize laser coupling to the PC despite variability in capture spot density. A). Fluorescence of a TNFα microspot ELISA obtained by illumination at a fixed angle of 10 degrees. B). Fluorescent image of the same assay using the angle scan method in which multiple images are gathered for a range of incident laser angles, and the peak intensity is selected for each pixel. C). Corresponding dose/response data with error bars representing one standard deviation of 9 replicate spots per concentration. Used with permission from Chaudhery et al., Optics Letters, 2012.
Conclusion
PC surfaces are a uniquely suited platform for improving the sensitivity of surface-based, multiplexed fluorescence assay, such as those used for detection and quantification of disease biomarkers. Through judicious choice of biomarkers, detection antibodies, and secondary antibodies, the fluorescent microspot ELISA assay approach achieves the selectivity for performing clinically relevant serum protein analysis using extremely low sample volumes, and is compatible with the goal of using only a droplet of serum obtained through a pin-prick for minimal invasiveness. Due to the low concentration of the detected biomarkers, a technology that can increase the fluorescent signal can be applied towards reduction in the detectable concentration (for diagnosis of disease at an earlier stage), increasing the slope of the dose/response curve for more accurate quantification, and increasing the signal/noise ratio. PCEF has been demonstrated using nanostructured surfaces fabricated from plastic materials by replica molding, and using commercially available confocal laser microarray scanners. Further gains in performance are achieved through the use of substrate materials with low background autofluorescence (such as quartz or silicon) and detection instruments that use collimated laser illumination rather than focused light. It is our goal to use DPN-based methods to create antibody capture spots in the 10–30 μm diameter range to further miniaturize the assay, and to integrate the PC with a microfluidic chip that is capable of automating the assay steps that are currently performed by hand. Such a chip would include a filtration stage to separate blood cells from serum, so that a single droplet of whole blood could be dispensed into the chip, resulting in exposure of serum to the ELISA capture spots. The assay protocol (sample exposure, washing, secondary antibody, washing, and fluorescent tag labeling) can be performed in ~60 minutes, and thus would be compatible with the goal of providing a rapid, noninvasive method for validating the results of a positive mammogram in the context of breast cancer diagnosis. However, the approach under development can be applied to the detection and quantification of many other protein biomarkers of interest from any bodily fluid.
Acknowledgments
The authors gratefully acknowledge funding from NIH (GM086382A), and NSF (CBET 07-54122). Any opinions, findings, conclusions, or recommendations expressed in this material are those of the authors and to not necessarily reflect the views of the National Institutes of Health or the National Science Foundation. The authors also acknowledge the collaboration of Dr. Nabil Amro and Dr. Mike Nelson from NanoInk for preparation the the DPN antibody array. BTC is grateful for the many contributions of his graduate students and postdocs whose work is represented in this review. In particular, BTC thanks Dr. C.-S. Huang, Dr. Meng Lu, Dr. P.C. Mathias, Dr. N. Ganesh, S. George, V. Chaudhery, and A. Pokhriyal.
References
- 1.Anderson NL. The roles of multiple proteomic platforms in a pipeline for new diagnostics. Molecular and Cellular Proteomics. 2005;4:1441–1444. doi: 10.1074/mcp.I500001-MCP200. [DOI] [PubMed] [Google Scholar]
- 2.Robinson WH, DiGennaro C, Hueber W, Haab BB, Kamachi M, Dean EJ, Fournel S, Fong D, Genovese MC, NdVegvar HE, Skriner K, Hirschberg DL, Morris RI, Muller S, Prujin GJ, Venrooij WJv, Smolen JS, Brown PO, Steinman S, Utz PJ. Autoantigen microarrays for multiplex characterization of autoantibody responses. Nature Medicine. 2002;8:295–301. doi: 10.1038/nm0302-295. [DOI] [PubMed] [Google Scholar]
- 3.Fan R, Vermesh O, Srivastava A, Yen BKH, Qin LD, Ahmad H, Kwong GA, Liu CC, Gould J, Hood L, Heath JR. Integrated barcode chips for rapid, multiplexed analysis of proteins in microliter quantities of blood. Nature Biotechnology. 2008 Dec;26:1373–1378. doi: 10.1038/nbt.1507. [DOI] [PMC free article] [PubMed] [Google Scholar]
- 4.Leitch AM. Controversies in breast cancer screening. Cancer. 1995;76:2064–2069. doi: 10.1002/1097-0142(19951115)76:10+<2064::aid-cncr2820761326>3.0.co;2-c. [DOI] [PubMed] [Google Scholar]
- 5.Ciatto S, Rosselli DT, Zappa M. The detectability of breast cancer by screening mammography. Br J Cancer. 1995;71:337–339. doi: 10.1038/bjc.1995.67. [DOI] [PMC free article] [PubMed] [Google Scholar]
- 6.Breast Cancer Progress Review Group. Charting the Course: Priorities for Breast Cancer Research. National Cancer Institute; 1998. [Google Scholar]
- 7.Hendrick RE, Cole EB, PIsano ED, Acharyya S, Marques H, Cohen MA. Accuracy of soft-copy digital mammography versus that of screen-film mammography according to digital manufacturer: ACRIN DMIST retrospective multireader study. Radiology. 2008;247:38–48. doi: 10.1148/radiol.2471070418. [DOI] [PMC free article] [PubMed] [Google Scholar]
- 8.Hackshaw A. EUSOMA review of mammography screening. Ann Oncol. 2003;14:1193–1195. doi: 10.1093/annonc/mdg321. [DOI] [PubMed] [Google Scholar]
- 9.Baines CJ. Screening mammography in women 40 to 49 years of age: No. Important Adv Oncol. 1995:243–251. [PubMed] [Google Scholar]
- 10.MIller AB. Mammography screening guidelines for women 40 to 49 and over 65 years old. Ann Epidemiol. 1994;4:96–101. doi: 10.1016/1047-2797(94)90053-1. [DOI] [PubMed] [Google Scholar]
- 11.Fitzpatrick P, Fleming P, O’Neill S, Kiernan D, Mooney T. False-positive mammographic screening: factors influencing re-attendance over a decade of screening. J Med Screen. 2011;18:30–33. doi: 10.1258/jms.2010.010104. [DOI] [PubMed] [Google Scholar]
- 12.Gonzalez RM, Daly DS, Tan R, Marks JR, Zangar RC. Plasma biomarker profiles differ depending on breast cancer subtype but RANTES in consistently increased. Cancer Epidemiology, Biomarkers, and Prevention. 2011 doi: 10.1158/1055-9965.EPI-10-1248. vol. Under Review. [DOI] [PMC free article] [PubMed] [Google Scholar]
- 13.Kristensen VN, Sorlie T, Geisler J, Langerod A, Yoshimura N, Karesen R, Harada N, Lonning PE, Borresen-Dale AL. Gene expression profiling of breast cancer in relation to estrogen receptor status and estrogen-metabolizing enzymes: Clinical implications. Clinical Cancer Research. 2005 Jan 15;11:878S–883S. [PubMed] [Google Scholar]
- 14.Sorlie T, Tibshirani R, Parker J, Hastie T, Marron JS, Nobel A, Deng S, Johnsen H, Pesich R, Geisler S, Demeter J, Perou CM, Lonning PE, Brown PO, Borresen-Dale AL, Botstein D. Repeated observation of breast tumor subtypes in independent gene expression data sets. Proceedings of the National Academy of Sciences of the United States of America. 2003 Jul 8;100:8418–8423. doi: 10.1073/pnas.0932692100. [DOI] [PMC free article] [PubMed] [Google Scholar]
- 15.Desmedt C, Haibe-Kains B, Wirapati P, Buyse M, Larsimont D, Bontempi G. Biological processes associated with breast cancer clinical outcome depends on the molecular subtypes. Clinical Cancer Research. 2008;14:5158–5165. doi: 10.1158/1078-0432.CCR-07-4756. [DOI] [PubMed] [Google Scholar]
- 16.Gast MC, Shellens HH, Beinjnen JH. Clinical proteomics in breast cancer: A review. Breast Cancer Res Treat. 2008 Dec 11; doi: 10.1007/s10549-008-0263-3. [DOI] [PubMed] [Google Scholar]
- 17.Goncalves A, Charafe-Jauffret E, Bertucci F, Audebert S, Toiron Y, Esterni B, Monville F, Tarpin C, Jacquemier J, Houvenaeghel G, Chabannon C, Extra JM, Viens P, Borg JP, Birnbaum D. Protein profiling of human breast tumor cells identifies novel biomarkers associated with molecular subtypes. Molecular & Cellular Proteomics. 2008 Aug;7:1420–1433. doi: 10.1074/mcp.M700487-MCP200. [DOI] [PMC free article] [PubMed] [Google Scholar]
- 18.Lu XS, Lu X, Wang ZCG, Iglehart JD, Zhang XG, Richardson AL. Predicting features of breast cancer with gene expression patterns. Breast Cancer Research and Treatment. 2008 Mar;108:191–201. doi: 10.1007/s10549-007-9596-6. [DOI] [PubMed] [Google Scholar]
- 19.Cahill DJ. J Immunol Methods. 2001;250:81–91. doi: 10.1016/s0022-1759(01)00325-8. [DOI] [PubMed] [Google Scholar]
- 20.Kodadek T. Protein microarrays: prospects and problems. Chemistry & Biology. 2001 Feb;8:105–115. doi: 10.1016/s1074-5521(00)90067-x. [DOI] [PubMed] [Google Scholar]
- 21.Huang RP, Huang RC, Fan Y, Lin Y. Simultaneous detection of multiple cytokines from conditioned media and patient’s sera by an antibody-based protein array system. Analytical Biochemistry. 2001 Jul 1;294:55–62. doi: 10.1006/abio.2001.5156. [DOI] [PubMed] [Google Scholar]
- 22.Huang RP. Clin Chem Lab Med. 2001;39:209–214. doi: 10.1515/CCLM.2001.032. [DOI] [PubMed] [Google Scholar]
- 23.Wiese R, Belosludtsev Y, Powdrill T, Thompson P, Hogan M. Simultaneous multianalyte ELISA performed on a microarray platform. Clinical Chemistry. 2001 Aug;47:1451–1457. [PubMed] [Google Scholar]
- 24.Woodbury RL, Varnum SM, Zangar RC. Elevated HGF levels in sera from breast cancer patients detected using a protein microarray ELISA. Journal of Proteome Research. 2002 May-Jun;1:233–237. doi: 10.1021/pr025506q. [DOI] [PubMed] [Google Scholar]
- 25.Zangar RC, Seurynck-Servoss SL, Baird CL, Miller KD, Pefaur NB, Gonzalez RM, Apiyo DO, Engelmann HE, Srivastava S, Kagan J, Rodland KD. Immobilization strategies for single-chain antibody microarrays. Proteomics. 2008 Jun;8:2199–2210. doi: 10.1002/pmic.200701036. [DOI] [PubMed] [Google Scholar]
- 26.Daly DS, Anderson KK, White AM, Gonzalez RM, Varnum SM, Zangar RC. Predicting protein concentrations with ELISA microarray assays, monotonic splines and Monte Carlo simulation. Statistical Applications in Genetics and Molecular Biology. 2008;7 doi: 10.2202/1544-6115.1364. [DOI] [PubMed] [Google Scholar]
- 27.Seurynck-Servoss SL, Baird CL, Miller KD, Pefaur NB, Gonzalez RM, Apiyo DO, Engelmann HE, Srivastava S, Kagan J, Rodland KD, Zangar RC. Immobilization strategies for single-chain antibody microarrays. Proteomics. 2008 Jun;8:2199–2210. doi: 10.1002/pmic.200701036. [DOI] [PubMed] [Google Scholar]
- 28.Gonzalez RM, Seurynck-Servoss SL, Crowley SA, Brown M, Omenn GS, Hayes DF, Zangar RC. Development and validation of sandwich ELISA microarrays with minimal assay interference. Journal of Proteome Research. 2008 Jun;7:2406–2414. doi: 10.1021/pr700822t. [DOI] [PubMed] [Google Scholar]
- 29.Ingvarsson J, Wingren C, Carlsson A, Ellmark P, Wahren B, Engstrom G, Harmenberg U, Krogh M, Peterson C, Borrebaeck CAK. Detection of pancreatic cancer using antibody microarray-based serum protein profiling. Proteomics. 2008 Jun;8:2211–2219. doi: 10.1002/pmic.200701167. [DOI] [PubMed] [Google Scholar]
- 30.Carlsson A, Wingren C, Ingvarsson J, Ellmark P, Baldertorp B, Ferno M, Olsson H, Borrebaeck CAK. Serum proteome profiling of metastatic breast cancer using recombinant antibody microarrays. European Journal of Cancer. 2008 Feb;44:472–480. doi: 10.1016/j.ejca.2007.11.025. [DOI] [PubMed] [Google Scholar]
- 31.Zangar R, Woodbury R, Varnum S. Development of a user-friendly microarray ELISA for the analysis of potential protein markers of breast cancer. Faseb Journal. 2003 Mar 17;17:A986–A986. [Google Scholar]
- 32.Woodbury RL, Varnum SM, Zangar RC. Elevated HGF levels in sera from breast cancer patients detected using a protein microarray ELISA. Journal of Proteome Research. 2002;1:233–237. doi: 10.1021/pr025506q. [DOI] [PubMed] [Google Scholar]
- 33.Seurynck-Servoss SL, Baird CL, Rodland KD, Zangar RC. Surface chemistries for antibody microarrays. Frontiers in Bioscience. 2007;12:3956–3964. doi: 10.2741/2362. [DOI] [PubMed] [Google Scholar]
- 34.Seurynck-Servoss SL, White SL, White AM, Baird CL, Rodland KD, Zangar RC. Evaluation of surface chemistries for antibody microarrays. Analytical Biochemistry. 2007;371:105–115. doi: 10.1016/j.ab.2007.07.010. [DOI] [PMC free article] [PubMed] [Google Scholar]
- 35.Gonzalez RM, Seurynck-Servoss SL, Crowley SA, Brown M, Omenn GS, Hayes DF, Zangar RC. Development and Validation of Sandwich ELISA Microarrays with Minimal Assay Interference. Journal of Proteome Research. 2008;7:2406–2414. doi: 10.1021/pr700822t. [DOI] [PubMed] [Google Scholar]
- 36.Zangar RC, Daly DS, White AM, Servoss SL, Tan RM, Collett JR. ProMAT Calibrator: A tool for reducing experimental bias in antibody microarrays. Journal of Proteome Research. 2009;8:3937–3943. doi: 10.1021/pr900247n. [DOI] [PubMed] [Google Scholar]
- 37.Zangar RC, Varnum SM, Bollinger N. Studying cellular processes and detecting disease with protein microarrays. Drug Metab Review. 2005;37:473–487. doi: 10.1080/03602530500205309. [DOI] [PubMed] [Google Scholar]
- 38.Huang CS, George S, Lu M, Chaudhery V, Tan R, Zangar RC, Cunningham BT. Application of photonic crystal enhanced fluorescence to cancer biomarker microarrays. Analytical Chemistry. 2011;83:1425–1430. doi: 10.1021/ac102989n. [DOI] [PMC free article] [PubMed] [Google Scholar]
- 39.Mathias PC, Ganesh N, Cunningham BT. Application of photonic crystal enhanced fluorescence to a cytokine immunoassay. Analytical Chemistry. 2008;80:9013–9020. doi: 10.1021/ac801377k. [DOI] [PubMed] [Google Scholar]
- 40.Varnum SM, Woodbury RL, Zangar RC. A protein microarray ELISA for screening biological fluids. Methods in Molecular Biology. 2004;264:161–172. doi: 10.1385/1-59259-759-9:161. [DOI] [PubMed] [Google Scholar]
- 41.Servoss SL, Gonzalez R, Varnum S, Zangar RC. High throughput analysis of serum antigens using sandwich ELISAs on microarrays. Methods in Molecular Biology. 2009;520:143–150. doi: 10.1007/978-1-60327-811-9_10. [DOI] [PubMed] [Google Scholar]
- 42.Weber WH, Eagen CF. Energy transfer from an excited dye molecule to the surface plasmons of an adjacent metal. Optics Letters. 1979;4:236–238. doi: 10.1364/ol.4.000236. [DOI] [PubMed] [Google Scholar]
- 43.Glass AM, Liao PF, Bergman JG, Olson DH. Interaction of metal particles with adsorbed dye molecules: absorption and luminescence. Optics Letters. 1980;5:368–370. doi: 10.1364/ol.5.000368. [DOI] [PubMed] [Google Scholar]
- 44.Knoll W, Philpott MR, Swalen JD, Girlando A. Emission of light from Ag metal gratings coated with dye monolayer assemblies. Journal of Chemical Physics. 1981;75:4795–4799. [Google Scholar]
- 45.Hung YJ, Smolyaninov II, Davis CC. Fluorescence enhancement by surface gratings. Optics Express. 2006;14:10825–10830. doi: 10.1364/oe.14.010825. [DOI] [PubMed] [Google Scholar]
- 46.Gryczynski I, Malicka J, Gryczynski Z, Lakowicz JR. Radiative decay engineering 4. Experimental studies of surface plasmon-coupled directional emission. Analytical Biochemistry. 2004;324:170–182. doi: 10.1016/j.ab.2003.09.036. [DOI] [PMC free article] [PubMed] [Google Scholar]
- 47.Muskens OL, Giannini V, Sanchez-Gil JA, Rivas JG. Strong Enhancement of the Radiative Decay Rate of Emitters by Single Plasmonic Nanoantennas. Nano Letters. 2007;7:2871–2875. doi: 10.1021/nl0715847. [DOI] [PubMed] [Google Scholar]
- 48.Lakowicz JR. Radiative decay engineering: biophysical and biomedical applications. Analytical Biochemistry. 2001;298:1–24. doi: 10.1006/abio.2001.5377. [DOI] [PMC free article] [PubMed] [Google Scholar]
- 49.Liu Y, Blair S. Fluorescence enhancement from an array of subwavelength metal apertures. Optics Letters. 2003;28:507–509. doi: 10.1364/ol.28.000507. [DOI] [PubMed] [Google Scholar]
- 50.Chen Y, Munechika K, Ginger DS. Dependence of Fluorescence Intensity on the Spectral Overlap between Fluorophores and Plasmon Resonant Single Silver Nanoparticles. Nano Letters. 2007;7:690–696. doi: 10.1021/nl062795z. [DOI] [PubMed] [Google Scholar]
- 51.Pockrand I, Brillante A, Mobius D. Nonradiative Decay of Excited Molecules Near a Metal Surface. Chemical Physics Letters. 1980;69:499–504. [Google Scholar]
- 52.Zhang J, Matveeva E, Gryczynski I, Leonenko Z, Lakowicz JR. Metal-Enhanced Fluoroimmunoassay on a Silver Film by Vapor Deposition. Journal of Physical Chemistry B. 2005;109:7969–7975. doi: 10.1021/jp0456842. [DOI] [PMC free article] [PubMed] [Google Scholar]
- 53.Zhang J, Fu Y, Liang D, Zhao RY, Lakowicz JR. Enhanced Fluorescence Images for Labeled Cells on Silver Island Films. Langmuir. 2008;24:12542–12457. doi: 10.1021/la801749f. [DOI] [PMC free article] [PubMed] [Google Scholar]
- 54.Zhang J, Fu Y, Chowdhury MH, Lakowicz JR. Metal-enhanced signle-molecule fluorescence on silver particle monomer and dimer: coupling effect between metal particles. Nano Letters. 2007;7:2101–2107. doi: 10.1021/nl071084d. [DOI] [PMC free article] [PubMed] [Google Scholar]
- 55.Hayakawa T, Selvan ST, Nogami M. Field enhancement effect of small Ag particles on teh fluorescence from Eu(3+)-doped SiO2 glass. Applied Physics Letters. 1999;74:1513–1515. [Google Scholar]
- 56.Selvan ST, Hayakawa T, Nogami M. Remarkable influence of silver islands on the enhancement of fluorescence from Eu(3+) ion-doped silica gels. J Phys Chem B. 1999;103:7064–7067. [Google Scholar]
- 57.Ganesh N, Block ID, Mathias PC, Zhang W, Chow E, Malyarchuk V, Cunningham BT. Leaky-mode assisted fluorescence extraction: application to fluorescence enhancement biosensors. Optics Express. 2008;16:21626–21640. doi: 10.1364/oe.16.021626. [DOI] [PubMed] [Google Scholar]
- 58.Ganesh N, Mathias PC, Zhang W, Cunningham BT. Distance dependence of fluorescence enhancement from photonic crystal surfaces. Journal of Applied Physics. 2008;103:083104. [Google Scholar]
- 59.Ganesh N, Zhang W, Mathias PC, Chow E, Soares JANT, Malyarchuk V, Smith AD, Cunningham BT. Enhanced fluorescence emission from quantum dots on a photonic crystal surface. Nature Nanotechnology. 2007 Aug;2:515–520. doi: 10.1038/nnano.2007.216. [DOI] [PubMed] [Google Scholar]
- 60.Rosenblatt D, Sharon A, Friesem AA. Resonant Grating Waveguide Structures. IEEE Journal of Quantum Electronics. 1997;33:2038–2059. [Google Scholar]
- 61.Budach W, Neuschafer D, Wanke C, Chibout SD. Generation of transducers for fluorescence-based microarrays with enhanced sensitivity and their application for gene expression profiling. Analytical Chemistry. 2003;75:2571–2577. doi: 10.1021/ac026390k. [DOI] [PubMed] [Google Scholar]
- 62.Neuschafer D, Budach W, Wanke C, Chibout SD. Evanescent resonator chips: a universal platform with superior sensitivity for fluroescence-based microarrays. Biosensors and Bioelectronics. 2003;18:489–497. doi: 10.1016/s0956-5663(02)00272-5. [DOI] [PubMed] [Google Scholar]
- 63.Cunningham B, Lin B, Qiu J, Li P, Pepper J, Hugh B. A plastic colorimetric resonant optical biosensor for multiparallel detection of label-free biochemical interactions. Sensors and Actuators B. 2002;85:219–226. [Google Scholar]
- 64.Mathias PC, Wu HY, Cunningham BT. Employing two distinct photonic crystal resonances to improve fluorescence enhancement. Applied Physics Letters. 2009;95:021111. doi: 10.1063/1.3184573. [DOI] [PMC free article] [PubMed] [Google Scholar]
- 65.Chaudhery V, Lu M, Pokhriyal A, Schulz S, Cunningham BT. Spatially selective photonic crystal enhanced fluorescence and application to background reduction for biomolecule detection assays. Optics Express. 2011;19:2332–23340. doi: 10.1364/OE.19.023327. [DOI] [PMC free article] [PubMed] [Google Scholar]
- 66.Pokhriyal A, Lu M, Chaudhery V, Huang CS, Schulz S, Cunningham BT. Photonic crystal enhanced fluorescence using a quartz substrate to reduce limits of detection. Optics Express. 2010;18:24793–24808. doi: 10.1364/OE.18.024793. [DOI] [PMC free article] [PubMed] [Google Scholar]
- 67.Zhang W, Kim SM, Ganesh N, Block ID, Mathias PC, Wu HY, Cunningham BT. Deposited nanorod films for photonic crystal biosensor applications. Journal of Vacuum Science & Technology A. 2010 Jul-Aug;28:996–1001. [Google Scholar]
- 68.Wu HY, Zhang W, Mathias PC, Cunningham BT. Magnification of photonic crystal fluorescence enhancement via TM resonance excitation and TE resonance extraction on a dielectric nanorod surface. Nanotechnology. 2010 Mar 26;21 doi: 10.1088/0957-4484/21/12/125203. [DOI] [PubMed] [Google Scholar]
- 69.Mathias PC, Wu HY, Cunningham BT. Employing two distinct photonic crystal resonances to improve fluorescence enhancement. Applied Physics Letters. 2009 Jul 13;95 doi: 10.1063/1.3184573. [DOI] [PMC free article] [PubMed] [Google Scholar]
- 70.Mathias PC, Ganesh N, Chan LL, Cunningham BT. Combined enhanced fluorescence and label-free biomolecular detection with a photonic crystal surface. Applied Optics. 2007 Apr 20;46:2351–2360. doi: 10.1364/ao.46.002351. [DOI] [PubMed] [Google Scholar]
- 71.Zhang W, Ganesh N, Mathias PC, Cunningham BT. Enhanced Fluorescence on a Photonic Crystal Surface Incorporating Nanorod Structures. Small. 2008 Dec;4:2199–2203. doi: 10.1002/smll.200800367. [DOI] [PubMed] [Google Scholar]
- 72.Chaudhery V, Lu M, Pokhriyal A, Schulz S, Cunningham BT. Angle-scanning photonic crystal enhanced fluorescence microscopy. IEEE Sensors Journal. 2012 vol. Accepted for publication. [Google Scholar]
- 73.Block ID, Mathias PC, Ganesh N, Jones SI, Dorvel BR, Chaudhery V, Vodkin LO, Bashir R, Cunningham BT. A detection instrument for enhanced-fluorescence and label-free imaging on photonic crystal surfaces. Optics Express. 2009 Jul 20;17:13222–13235. doi: 10.1364/oe.17.013222. [DOI] [PMC free article] [PubMed] [Google Scholar]
- 74.George S, Block ID, Jones SI, Mathias PC, Chaudhery V, Vuttipittayamongkol P, Wu HY, Vodkin LO, Cunningham BT. Label-Free Prehybridization DNA Microarray Imaging Using Photonic Crystals for Quantitative Spot Quality Analysis. Analytical Chemistry. 2010 Oct 15;82:8551–8557. doi: 10.1021/ac101551c. [DOI] [PubMed] [Google Scholar]