

Abstract
Background
Longitudinal magnetic resonance imaging (MRI) studies show that a fraction of the multiple sclerosis (MS) T2-lesions containT1-hypointense components that may persist to represent severe, irreversible tissue damage. It is not known why certain lesions convert to persistent T1-hypointense lesions.
Objective
We hypothesized that the T1-hypointense lesions disproportionately distribute in the more hypoperfused areas of the brain. Here we investigated the association between hypoperfusion and T1-hypointense lesion distributions.
Methods
MRI and cerebral blood flow (CBF) data were acquired on 45 multiple sclerosis (MS) patients and 20 healthy controls. CBF maps were generated using pseudo continuous arterial spin labeling technique. The lesion probability distribution maps were superimposed on the CBF maps.
Results
Two distinct CBF clusters were observed in the white matter (WM) both in healthy controls and MS patients. An overall reduction in the CBF was observed in MS patients compared to healthy controls. The majority of the T1-hypointense lesions was concentrated almost exclusively in the WM regions with lower CBF. The T2-hyperintense lesions were more generally distributed in both higher and lower perfused WM.
Conclusion
This study suggests an association between hypoperfusion and T1-hypointense lesions.
Keywords: multiple sclerosis, magnetic resonance imaging, cerebral blood flow, T1-hypointense lesions, T2-hyperintense lesions
INTRODUCTION
Multiple sclerosis (MS) is a chronic central nervous system (CNS) disease that affects at least 2.5 million people world-wide. Longitudinal MRI studies show that MS is a dynamic disease in which lesions appear and disappear. About 80% of the newly formed T2-hyperintense lesions appear hypointense on T1-weighted images. About 40% of these lesions remain hypointense over many months to years and are generally referred to as persistent black holes that represent severe, irreversible tissue damage.1 The correlation between the persistent T1-hypointense lesion volume and EDSS is not always consistent.2 It is not known why certain T2-lesions or portions of T2-lesions convert to persistent T1-hypointense lesions.
The acute and subacute CNS demyelinated lesions that characterize the disease have a striking inflammatory component, and MS is generally accepted to be a T-cell mediated autoimmune disorder. However, the pathological features in MS also include continued progression of brain atrophy and this can occur despite treatment that effectively reduces inflammation.3
Perfusion studies based on multiple imaging modalities reported reduced cerebral blood flow (CBF) in MS.4–5 In some patients, new focal lesions were observed with reduced mean diffusivity (MD) on diffusion MRI, similar to that observed in acute ischemic lesions.6–8 To better explain aspects of the observed pathological features of MS it was postulated that hypoperfusion plays a critical role in the pathogenesis of MS.9
The MRI-based spatial distribution of lesions lend support to the role of hypoxia in MS.10–14 The spatial distribution of T2-hyperintense and gadolinium enhanced lesions (Gd lesions) in 19 relapsing remitting MS (RRMS) patients scanned serially showed more frequent occurrence of T2 lesions in the lower perfused WM relative to the higher perfused WM, while contrast enhanced lesions were observed with equal frequency in both.15 These observations indicate that persistent lesions appear with lower frequency in relatively well perfused regions of the tissue compared to poorly perfused areas. It may be particularly telling that lesions in the cortex exhibit a higher propensity for repair than do the WM lesions.16 The higher perfusion in GM relative to WM can perhaps explain this observation. The recently reported inverse correlation between CBF and lesion load also suggests that hypoperfusion plays a role in lesion evolution in MS.17
Based on the above lines of evidence, we hypothesized that T1-hypointense lesions, the majority of which represent irreversible tissue damage, disproportionately distribute in the more hypoperfused areas of the brain. In this manuscript we present, for the first time, an association between hypoperfusion and MRI-defined T1-hypointense lesion distributions.
METHODS
Subjects
Forty five MS patients (32 females and 13 males; 1 radiologically isolated syndrome (RIS), 4 clinically isolated syndrome (CIS), 34 relapsing remitting MS (RRMS) and 6 secondary progressive MS (SPMS)) were included for determining the spatial distribution of lesions. The patient demographic data is summarized in Table 1. In addition, 20 healthy controls (12 males, 8 females; median age 30.2 yrs (range 23 to 45 yrs) were included for determining the normative CBF data for comparison with the values obtained from the MS subjects. These studies were approved by our institution review board.
Table 1.
Demographic data on 45 MS subjects
| CIS Subjects (5) | RRMS Subjects (33) | SPMS Subjects (6) | |
|---|---|---|---|
| Age (yrs) (mean ± SD, range) | 38.31 ± 17.77, 20–61 | 36.25 ± 10.69, 21–54 | 53.47 ± 13.21, 35–72 |
| EDSS (mean ± SD, range) | 0.8 ± 1.30, 0–3 | 1.73 ± 1.52, 0–6 | 5.25 ± 0.99, 4–6 |
| T2 lesion load (cc) (mean ± SD, range) | 2.91 ± 3.79, 0.77– 9.64 | 9.14 ± 8.16, 0.96– 32.85 | 12.71 ± 13.83, 1.83– 39.16 |
| T1 lesion load (cc) (mean ± SD, range) | 1.07 ± 1.47, 0.08– 3.59 | 2.12 ± 2.48, 0.08– 11.36 | 4.21 ± 4.81, 0.24– 13.75 |
| GM volume (cc) (mean ± SD, range) | 558.56 ± 31.34, 519.19–591.07 | 563.30 ± 62.70, 468.00–726.89 | 578.35 ± 75.63, 501.88–720.18 |
| WM volume (cc) (mean ± SD, range) | 461.02 ± 61.42, 359.87–513.49 | 499.52 ± 55.86, 412.99–626.53 | 507.69 ± 73.34, 416.23–638.85 |
MRI Acquisition
MRI studies were performed on a 3T Philips scanner using an 8 channel head coil. The MRI protocol is summarized in Table 2.
Table 2.
MRI protocol
| Sequence | Mode | TR (ms) | TE (ms) | TI (ms) | Voxel size (mm × mm × mm) | Number of slices |
|---|---|---|---|---|---|---|
| MPRAGE | 3D | 8100 | 3.7 | - | 0.94×0.94×1.5 | 170 |
| Dual echo TSE | 2D | 6800 | 8.2/90 | - | 0.94×0.94×3 | 44 |
| FLAIR | 2D | 10000 | 90 | 2600 | 0.94×0.94×3 | 44 |
| T1-weighted spin echo (Pre- and post contrast) | 2D | 600 | 9.2 | - | 0.94×0.94×3 | 44 |
MPRAGE: magnetization prepared gradient recalled echo; FLAIR: fluid attenuation by inversion recovery; TR: repetition time; TE: echo time
CBF data was acquired using the pseudo continuous arterial spin labeling (pCASL) with a single shot gradient echo echo-planar imaging (EPI) sequence with the following parameters: TR/TE=4300 ms/16 ms and voxel dimension of 3 mm × 3 mm × 5 mm. The other parameters were: number of slices = 29, acquisition matrix of 80 ×80, number of dynamics = 40, label duration = 1650 ms, post label delay = 1525 ms, average label location relative to the AC-PC line = 85 ± 2.3 mm (mean ± sd), SENSE factor of 2 along the A-P direction. The tagging efficiency is a parameter that influences the estimated CBF based on pCASL. In pCASL the value of tagging efficiency depends on the subject and magnetic field (both static and radio frequency) homogeneity. The tagging efficiency on each subject was determined by combining information from the flow determined by both pCASL and phase contrast magnetic resonance angiography (PCMRA).18 Three dimensional time of flight MRA was acquired using the 3D fast field echo (FFE) sequence for visualizing the internal carotid and vertebral arteries for positioning the labeling plane for pCASL using the following scan parameters: TR/TE = 14 ms/2.4 ms, flip angle = 160, slice thickness of 2 mm, and SENSE factor of 1. We acquired non-gated PCMRA using the 2D FFE sequence to estimate the whole brain average blood flow which acts as a normalization factor,18 using the following scan parameters: TR/TE = 11 ms/6.7 ms, flip angle = 150, single 7 mm slice.
MRI Analysis
Image segmentation was performed using the MRI Automated Processing (MRIAP) pipeline based on algorithms described elsewhere.19–21 The T1-hypointense lesions were automatically identified in a robust way using the procedure described elsewhere.19 The T1-hypointense lesions were removed from all lesions that appear hyperintense on the T2-weighted images and we refer to them as T2-hyperintense lesion components. It should be pointed out that lesions that appear hyperintense on the T2-weighted images do not always contain a T1-hypointense lesion component. The lesion volumes were not corrected for the head size. The segmentation results were manually examined by one of the authors (JSW) with extensive experience in MRI, neuroanatomy, and MS.
We compared MRIAP software with FreeSurfer (http://surfer.nmr.mgh.harvard.edu/), and SPM (www.fil.ion.ucl.ac.uk/spm), two of the most commonly used software packages for segmenting WM, GM, and CSF in normal volunteers. The results of these studies have been published. 22 Four operators have stripped four sets of images and then processed with MRIAP. The final segmentation results were evaluated for all the tissues. The MRIAP software was evaluated for the inter- and intra-operator reproducibility and scan-to-scan reproducibility by analyzing data acquired twice (within a week) on six subjects.
Lesion Distribution Maps
For generating the lesion distribution maps, all images were transformed to the Montreal Neurologic Institute (MNI) space using nonlinear image registration (http://www.picsl.upenn.edu/ANTS/). The T1-hypointense lesion component represents that portion of a lesion with the most severe tissue disruption/destruction. Lesion probability distribution maps were generated for Gd lesions, strictly T2-hyperintense lesion components, and the T1-hypointense component. The threshold for the cluster size for lesions was set at 3 pixels
CBF analysis
All the pCASL images were processed for generating the CBF maps using published equations.18 For calculating absolute CBF the following values were used: time delay between the end of the labeling and the beginning of the acquisition = 1525 ms, T1 of arterial blood = 1624 ms, T1 value in the presence of radio frequency irradiation = 750 ms, blood-brain partition coefficient = 0.98 mL/g (assumed constant for both MS and healthy controls), and arterial transit time from the tagging plane to the imaging slice = 2000 ms. As suggested by Aslan et al, 18 the equilibrium magnetization needed for calculating the CSF was obtained from the thalamus by drawing a region of interest (ROI) within that structure.
For transforming the CBF maps to the MNI space, the T1-weighted images were stripped of the extrameningeal tissues and affine registered to the CBF images. The tissue-specific masks (GM and WM masks) obtained by segmenting the CBF maps were registered to the T1-weighted images. These in turn were registered to the CBF maps to obtain the GM and WM specific CBF values. The CBF maps of individual subjects were then deformed to the MNI space using the diffeomorphic and inverse consistent transformation (http://www.picsl.upenn.edu/ANTS/) for generating the CBF template and calculating the group averaged CBF in GM and WM. The WM atlas in the MNI space,23 was used for automatically identifying different WM structures, such as corpus callosum, fornix, corticospinal tracts, posterior corona radiate, posterior thalamic radiation, sagittal stratum, external capsules, and inferior fronto-occipital fasciculus.
Statistical Analysis
We used SPM5 (http://www.fil.ion.ucl.ac.uk/spm/software/spm5/) to determine the significant differences in the CBF values between normal and MS cohorts. Given the heterogeneity of our MS cohort we explored possible effects of age and gender. For age, we divided the patients into two groups based on median age (20 – 50 and 51–70 years). Phenotype was not considered because of the small number of subjects in CIS and SPMS. Statistical inferences were based on p = 0.05 (family wise error).
RESULTS
Segmentation
The inter- and intra-operator and scan-to-scan reproducibility analyses of segmented images did not reveal any visual differences between the two scans on the same subject. Quantitatively, the coefficients of variation for GM, WM, CSF, and lesion volumes were found to be 1.2%, 1.3%, 1.7%, and 2.4%, respectively, indicating excellent reproducibility. Overall, the difference in the mean tissue volumes between different operators for different sets of images was found to be less than 5%.
Average CBF Maps
The average labeling efficiency in pCASL was 0.87 ± 0.19 and this information was incorporated for correcting the CBF values for each subject. The CBF maps were warped to the International Consortium of Brain mapping (ICBM) template in the MNI coordinate system. As an example, the color coded CBF templates generated on the 45 MS patient cohort and the 20 normal subjects are shown in Figs 1A and 1B, respectively. In the color coded CBF template, red and yellow indicate the highest CBF values, while blue and dark blue represent the lowest. As expected the CBF is higher in GM compared to WM. Figure 1C shows the voxels (in red) that showed significant differences in the CBF values between the control and MS cohorts. As can be seen from this figure, a number of regions in MS patients show lower CBF relative to the normal controls. No effect of gender or age was observed on the global CBF in the MS cohort.
Fig 1.

T1-weighted and the corresponding CBF template (B). In the color coded CBF template, yellow and red indicate highest CBF values and blue and dark blue the lowest (see the color bar in B). The voxels that show significant differences (based on p = 0.05; family wise error) are shown in red and are superimposed on the T1 template (C).
The CBF histogram of WM, averaged over all the 20 normal controls, exhibits two peaks that are nearly normally distributed (top left in Fig. 2). In these plots, the x-axis represents CBF and the y-axis represents the tissue probability at a given voxel. At least two CBF values in WM, represented by green and blue, are evident in Figures 2A and 2B. In contrast, the CBF distribution in GM is represented by a single Gaussian distribution (top right Fig. 2). Qualitatively, similar behavior was seen in the MS subjects (bottom row, Fig. 2). The quantitative CBF values in MS subjects, based on the histogram fit, are 16.3 ± 4.89 and 30.46 ± 4.92 mL/min/100 gm in the WM and 69.6 ± 6.39 mL/min/100 gm in GM. Using the statistical information (mean, standard deviation) from the Gaussian fits, we assigned each WM voxel to one of the two CBF values. In order to determine the WM regions that correspond to these two CBF values, we have overlaid the CBF values on the WM atlas.23 The corona radiata is the dominant WM structure with low CBF while structures with higher CBF include cingulum, corpus callosum, and superior longitudinal fasciculus, among others.
Fig. 2.

The CBF histograms in WM and GM. The values for normal controls are shown in the top row. The corresponding histograms of MS subjects are shown in the bottom row. The y-axis in these plots represents the tissue probability at a given voxel. Qualitatively, the CBF values show similar patterns in both MS and control subjects.
The results of the quantitative analysis of regional CBF in normal and MS patients are summarized in Fig. 3. The quantitative analysis indicates a general reduction in the CBF in MS subjects in multiple structures relative to the healthy controls was observed. The reduction was not found to be either gender or age-dependent.
Fig. 3.
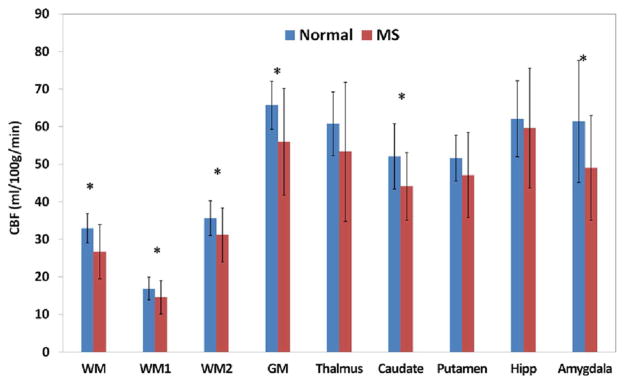
CBF values in normal controls and MS subjects in multiple brain structures. WM1 and WM2 refer to the central and peripheral WM regions, respectively. * indicates P < 0.05
Lesion Probability Distribution
The lesion probability distribution maps for all the three types of lesions superposed on the T1-weighted images are shown in Fig. 4 (top row). The highest lesion frequency (~60%) was observed in the periventricular non-callosal WM that includes the anterior, middle and posterior corona radiata. These are the regions with relatively poor perfusion. The observed T1-hypointense lesion distribution is mainly confined to the WM with low CBF values (see below). The Gd lesion probability distribution and the maximum distribution was observed to be less than 5%.
Fig. 4.

Top row: Superposition of T2 (A), T1 (B), and Gd (C) lesion probability distribution superposed on the T1-weighted images in the MNI space. Bottom row: superposition of the T2 (E) and T1 (F), and Gd (G) lesions on the CBF maps. For comparison the colored CBF map at the same location is shown (D). The range of CBF is from 0 to 100 ml/100g/min. The color bars show the lesion probability. Note the very low probability for the Gd lesions
Lesion Distribution and CBF
We superimposed the lesion distribution on the CBF maps with representative results shown in Fig. 4 (bottom row). The T2-hyperintense lesion components appear with high probability both in the low and high perfused WM. In contrast, majority of the T1-hypointense lesions appear to be mainly confined to the hypoperfused areas. We did not detect any apparent age- or gender effects on the spatial relation between lesions and hypoperfusion. While the probability of Gd lesions is very low (maximum probability is 5%), they appear to be distributed in both low and high perfused WM.
DISCUSSION
In this study we investigated if T1-hypointense lesions, many of which could represent severe tissue injury, are associated with hypoperfusion in MS. Our study is based on the spatial relationship between CBF and the T1-hypointense and T2-hyperintense components of lesions. The most interesting observation is that the T1-hypointense lesions that could lead to most severe tissue disruption localize disproportionately in the more poorly perfused regions of the brain. This suggests an association between hypoperfusion and T1-hypointense lesions.
Gd lesions are generally considered to represent acute lesions. It would have been of interest to determine if initial lesion formation is independent of relative tissue perfusion, as the report by Lee suggests.15 Since Gd lesions usually persist only for 4 to 6 weeks, capturing them requires frequent scanning. In the current cross sectional study we observed enhancements in 10 of 45 (22.2%) patients. Those captured were spread throughout the WM, resulting in a low probability of < 5% of observing these lesions at any given location. Thus, it is difficult to draw any meaningful conclusions about the association between perfusion and appearance of Gd lesions based on these studies.
In one of the largest studies available to date, Holland et al,11 investigated the association between perfusion and lesion location. They measured CBF in normal subjects using SPECT and focused only on the T2 lesions. Our study differs from theirs in a number of ways. We measured CBF in MS patients using pCASL which provided CBF maps with higher spatial resolution. We also determined the absolute value of CBF. Perhaps a more important difference is that we focused on the T1-hypointense lesion components to explore the relationship of the extent of potential most severe tissue destruction and regional CBF. Since an important percentage of T1-hypointense lesions represent the most severely affected tissue and have a high likelihood of persistence, the association between this lesion component and perfusion could prove more informative for investigating the basis of tissue preservation and repair than unfractionated T2 lesions.
Our results suggest an overall reduction of CBF in MS subjects compared to healthy controls. This may suggest that hypoxic condition could provide an environment that is conducive for lesion formation and persistence.
Based on our results we suggest that reduced blood flow compromises tissue repair. However, what is not clear is whether reduced CBF is a consequence of lesion formation or if the hypoxia creates an environment that compromises lesion repair, or contributes to further future permanent tissue destruction. Longitudinal MRI studies suggest that alterations in tissue perfusion may precede lesion formation.24 Neuropathologic studies have documented ischemic changes, at least in a subset of lesions.25 However, the appearance of Gd lesions with equal probability throughout the WM,15 suggesting that lesion formation may not be solely dependent on the state of tissue perfusion. Whatever the mechanism for lesion formation might be, hypoperfusion appears to compromise innate tissue repair following lesion generation, predisposing to the formation of permanent T1-hypointense lesions or ‘black holes’.
In this study our focus has been the role of hypoperfusion/hypoxia on the WM lesion repair or further tissue deterioration. However, hypoxia may also play an important role in WM lesion formation in MS. WM regions with normally low perfusion are vulnerable to hypoxic injury for a number of reasons that include marginal blood supply; CBF that is typically 20 to 40% of GM, and with poor collateral supply.26–28 In rodents subjected to middle cerebral artery occlusion, severe swelling of astrocytes and oligodendrocytes in WM was observed within 30 minutes of occlusion. These changes preceded neuronal necrosis in cortex and basal ganglia.29 These studies clearly demonstrate the high vulnerability of WM to ischemia. This susceptibility to hypoxic injury makes WM particularly vulnerable to lesion formation. The role of hypoxia in lesion formation is further supported by the observation that in some patients, new focal lesions are observed with reduced mean diffusivity on diffusion MRI, similar to that observed in acute ischemic lesions.30,31 Multiple lesions in the centrum semiovale and corona radiata arranged in a linear fashion are commonly associated with hemodynamic impairment.32,33 Such lesion patterns are commonly seen in MS patients. It has been suggested that the centrum semiovale and corona radiata are at a higher risk for ischemia because of the nature of arterial supply.34 On histopathology, similarities between MS lesions and ischemic WM disease were reported.4
One might also argue that the spatial association between hypoperfusion and T1-hypointense lesions is purely coincidental. In view of the published literature (see above and the Introduction), such a coincidence appears unlikely.
Our analysis did not indicate that age or gender had an effect on the CBF values and lesion distribution. However, this result should be interpreted with caution since our cohort size was relatively small with a large age range, and needs to be confirmed on a larger patient sampling.
The CNS is highly dependent on ATP for energy. These energy needs are further increased in demyelinated axons because of the compensatory redistribution of sodium channels along the length of the exposed axolemma, rather than remaining concentrated at the nodes of Ranvier in myelinated axons.35 The resulting increase in the sodium influx places a greater demand on the Na/K/ATPase, a major user of ATP within the CNS.36 As a result of hypoxia the ATP production is reduced and homeostasis disturbed, causing further injury to the tissue. Another possible consequence of the hypoxic environment is the oxidative damage caused by the increased production of superoxide by mitochondria. There is some evidence that hypoxia increases the release of reactive oxygen species by mitochondria.37 In fact, generation of reactive oxygen species by mitochondria appears to be necessary for metabolic adaptation to hypoxia and angiogenesis to increase oxygen supply.38 The oxidative stress caused by the reactive oxygen species damages mitochondrial DNA as is well documented in MS.39,40
It is also reasonable to speculate that poor regional tissue perfusion may reduce the removal of a variety of cytokines and other macromolecules that experimentally have been shown to contribute to oligodendroglial cell damage,41 and to inhibit the ability of otherwise competent oligodendroglial precursor cells to initiate remyelination in MS plaques.42,43 One might also consider the role of relative hypoperfusion in MS WM in predisposing to oligodendroglia apoptosis in the absence of inflammatory influences.44
LIMITATIONS
The cross-sectional nature is a limitation of this preliminary study. It would be quite informative to determine the temporal pattern of T1-hypointense lesion development and persistence in relationship to MS CBF maps. Future studies, including clinical trials, might incorporate CBF as a part of the MRI protocol. Such studies could help establish a robust association between perfusion and the propensity for lesion persistence or repair. MS is a dynamic disease in which new lesions appear and existing lesions expand/shrink/disappear; all contribute to lesion activity. Subtraction imaging was shown to be a powerful and robust technique for automatic detection of lesion activity.45 We intend to pursue such analyses on large datasets. Here we identified T1 hypointense lesions as those lesions which do not show contrast enhancement, but are hypointense on T1-weighted images. Because of the cross-sectional nature of this study, it is not clear that all of the T1-hypointense lesions represent chronic lesions characterized by irreparable tissue destruction. The heterogeneity of the MS subjects in terms of demographics is ignored in this study. We have not included cortical lesions in this study as the conventional sequences used in this study are not sensitive in detecting cortical lesions. Even with advanced sequences such as double inversion recovery sequences, studies suggest that only a fraction of cortical lesions are detected. Finally, because of the noisy nature of the pCASL measurements, we used a relatively large voxel size of 3 mm × 3 mm × 5 mm. This introduced partial volume averaging that could have affected our conclusions. In spite of these limitations, we believe that these are the first studies that report a more direct association between hypoperfusion and tissue destruction/repair using multi-modal MRI and lead to a testable hypothesis about the role of perfusion in MS lesion repair.
CONCLUSIONS
In this study we report an association between hypoperfusion and lesion distribution. We have demonstrated that MS WM exhibits two distinct CBF values. Moreover, the majority of the T1-hypointense lesions, a significant percentage of which reflects more intense tissue disruption/destruction and an increased propensity for persistence as chronic lesions are disproportionately present with highest probability in the most hypoperfused WM regions compared to strictly T2-hyperintense lesions. The results of these multi-modal studies strongly implicate hypoperfusion as a factor that contributes to tissue destruction and may interfere with lesion repair.
Acknowledgments
This publication was made possible by grant number R01 EB02095 from NINDS, grant number R01 NS07824 from NINDs, and grant number S10 RR19186 from NCRR. All the three institutes are part of NIH. Some imaging costs were offset by a gift from BAMS, the Band Against Multiple Sclerosis. We thank Vipulkumar Patel for his help with MRI scans. PAN: Research support from the Department of Defense, National Institutes of Health and consulting agreement with Acorda and Sanofi-Aventis,. YZ: National Institutes of Health and National Science Foundation. KMH: National Institutes of Health and Department of Defense; SD: National Institutes of Health and Sanofi Aventis. XS: National Institutes of Health. JSW: Consulting agreements or speaking for Astellas, Bayer HealthCare, Celgene, Consortium of MS Clinics, Eli Lilly, Hoffman LaRoche, Medscape CME, Novartis, sanofi-aventis, Serono Symposia International Foundation, Texas Neurological Society, Teva and Teva Neurosciences, royalties from Millipore [Chemicon International] Corporation, and research or contractual support from the Clayton Foundation for Research, National Institutes of Health, National MS Society and Sanofi. We thank Drs. Staley A. Brod, Flavia Nelson, J. William Lindsey and John A. Lincoln for contributing their patients for this study.
Footnotes
The contents of the manuscript are solely the responsibility of the authors and do not necessarily represent the official views of the individual institutes or NIH/NINDS/NCRR. None of the investigators have financial interest in the outcome of the study.
References
- 1.Van den Elskamp I, Lembcke J, Dattola V, Beckmann K, Pohl C, Hong W, et al. Persistent T1 hypointensity as an MRI marker for treatment efficacy in multiple sclerosis. Mult Scler. 2008;14:764–769. doi: 10.1177/1352458507087842. [DOI] [PubMed] [Google Scholar]
- 2.Sahraian MA, Radue EW, Haller S, Kappos L. Black holes in multiple sclerosis: definition, evolution, and clinical correlations. Acta Neurol Scand. 2010;122:1–8. doi: 10.1111/j.1600-0404.2009.01221.x. [DOI] [PubMed] [Google Scholar]
- 3.Compston A, Coles A. Multiple sclerosis. Lancet. 2008;372:1502–1517. doi: 10.1016/S0140-6736(08)61620-7. [DOI] [PubMed] [Google Scholar]
- 4.De Keyser J, Steen C, Mostert JP, Koch MW. Hypoperfusion of the cerebral white matter in multiple sclerosis: possible mechanisms and pathophysiological significance. Journal of Cerebral Blood Flow & Metabolism. 2008;28:1645–1651. doi: 10.1038/jcbfm.2008.72. (and references therein) [DOI] [PubMed] [Google Scholar]
- 5.Papadaki EZ, Mastorodemos VC, Amanakis EZ, Tsekouras KC, Papadakis AE, Tsavalas ND, Simos PG, Karantanas AH, Plaitakis A, Maris TG. White matter and deep gray matter hemodynamic changes in multiple sclerosis patients with clinically isolated syndrome. Magn Reson Med. 2012;68:1932–1942. doi: 10.1002/mrm.24194. [DOI] [PubMed] [Google Scholar]
- 6.Rosso C, Remy P, Creange A, Brugieres P, Cesaro P, Hosseini H. Diffusion-weighted MR imaging characteristics of an acute stroke like form of multiple sclerosis. AJNR Am J Neuroradiol. 2006;27:1006–1008. [PMC free article] [PubMed] [Google Scholar]
- 7.Rovira A, Pericot I, Alonso J, Rio J, Grive E, Montalban X. Serial diffusion-weighted MR imaging and proton MR spectroscopy of acute large demyelinating brain lesions: case report. AJNR Am J Neuroradiol. 2002;23:989–994. [PMC free article] [PubMed] [Google Scholar]
- 8.Balashov Konstantin E, Lindzen Eric. Acute demyelinating lesions with restricted diffusion in multiple sclerosis. Mult Scler Journal. 2012;18:1745–1753. doi: 10.1177/1352458512445407. [DOI] [PMC free article] [PubMed] [Google Scholar]
- 9.D’haeseleer M, Cambron M, Vanopdenbosch L, De Keyser J. Vascular aspects of multiple sclerosis. Lancet Neurol. 2011;10:657–666. doi: 10.1016/S1474-4422(11)70105-3. (and references therein) [DOI] [PubMed] [Google Scholar]
- 10.Di Perri C, Battaglinin M, Stromillo ML, Bartolozzi ML, Guidi L, Federico A, De Stefano N. Voxel-Based Assessment of Differences in Damage and Distribution of White Matter Lesions Between Patients With Primary Progressive and Relapsing-Remitting Multiple Sclerosis. Arch Neurol. 2008;65:236–243. doi: 10.1001/archneurol.2007.51. [DOI] [PubMed] [Google Scholar]
- 11.Holland CM, Charil A, Csapo I, Liptak Z, Ichise M, Khoury SJ, Bakshi R, Weiner HL, Guttmann CR. The Relationship between Normal Cerebral Perfusion Patterns and White Matter Lesion Distribution in 1,249 Patients with Multiple Sclerosis. J Neuroimaging. 2012;22:129–136. doi: 10.1111/j.1552-6569.2011.00585.x. [DOI] [PubMed] [Google Scholar]
- 12.Hasan KM, Walimuni IS, Abid H, Frye RE, Ewing-Cobbs L, Wolinsky JS, Narayana PA. Multimodal quantitative magnetic resonance imaging of thalamic development and aging across the human lifespan: implications to neurodegeneration in multiple sclerosis. J Neurosci. 2011;31:16826–16832. doi: 10.1523/JNEUROSCI.4184-11.2011. [DOI] [PMC free article] [PubMed] [Google Scholar]
- 13.Vellinga MM, Geurts JJG, Rostrup E, Uitdehaag BMJ, Polman CH, Barkhof F, Vrenken H. Clinical Correlations of Brain Lesion Distribution in Multiple Sclerosis. J Magnn Reson Imaging. 2009;29:768–773. doi: 10.1002/jmri.21679. [DOI] [PubMed] [Google Scholar]
- 14.Narayanan S, Fu L, Pioro E, et al. Imaging of axonal damage in multiple sclerosis:spatial distribution of magnetic resonance imaging lesions. Ann Neurol. 1997;41:385–391. doi: 10.1002/ana.410410314. [DOI] [PubMed] [Google Scholar]
- 15.Lee MA, Smith S, Palace J, et al. Spatial mapping of T2 and gadolinium-enhancing T1 lesion volumes in multiple sclerosis: Evidence of distinct mechanisms of lesion genesis. Brain. 1999;122:1261–1270. doi: 10.1093/brain/122.7.1261. [DOI] [PubMed] [Google Scholar]
- 16.Albert M, Antel J, Brück W, Stadelmann C. Extensive cortical remyelination in patients with chronic multiple sclerosis. Brain Pathol. 2007;17:129–138. doi: 10.1111/j.1750-3639.2006.00043.x. [DOI] [PMC free article] [PubMed] [Google Scholar]
- 17.Amann M, Achtnichts L, Hirsch JG, Naegelin Y, Gregori J, Weier K, Thöni A, Mueller-Lenke N, Radue EW, Günther M, Kappos L, Gass A. 3D GRASE arterial spin labelling reveals an inverse correlation of cortical perfusion with the white matter lesion volume in MS. Mult Scler J. 2012;18:1570–1576. doi: 10.1177/1352458512441984. [DOI] [PubMed] [Google Scholar]
- 18.Aslan S, Xu F, Wang PL, Uh J, Yezhuvath US, van Osch M, Lu H. Estimation of labeling efficiency in pseudocontinuous arterial spin labeling. Magn Reson Med. 2010;63:765–771. doi: 10.1002/mrm.22245. [DOI] [PMC free article] [PubMed] [Google Scholar]
- 19.Datta S, Sajja BR, He R, Wolinsky JS, Gupta RK, Narayana PA. Segmentation and quantification of black holes in multiple sclerosis. Neuroimage. 2006;29:467–474. doi: 10.1016/j.neuroimage.2005.07.042. [DOI] [PMC free article] [PubMed] [Google Scholar]
- 20.Datta S, Sajja BR, He R, Gupta RK, Wolinsky JS, Narayana PA. Segmentation of gadolinium-enhanced lesions on MRI in multiple sclerosis. J Magn Reson Imaging. 2007;25:932–937. doi: 10.1002/jmri.20896. [DOI] [PubMed] [Google Scholar]
- 21.Sajja BR, Datta S, He R, Mehta M, Gupta RK, Wolinsky JS, Narayana PA. Unified approach for multiple sclerosis lesion segmentation on brain MRI. Ann Biomed Eng. 2006;34:142–151. doi: 10.1007/s10439-005-9009-0. [DOI] [PMC free article] [PubMed] [Google Scholar]
- 22.Datta S, Tao G, He R, Wolinsky JS, Narayana PA. Improved cerebellar tissue classification on magnetic resonance images of brain. J Magn Reson Imaging. 2009;29:1035–1042. doi: 10.1002/jmri.21734. [DOI] [PMC free article] [PubMed] [Google Scholar]
- 23.Mori S, Oishi K, Jiang H, Jiang L, Li X, Akhter K, Hua K, Faria AV, Mahmood A, Woods R, Toga AW, Pike GB, Neto PR, Evans A, Zhang J, Huang H, Miller MI, van Zijl P, Mazziotta J. Stereotaxic white matter atlas based on diffusion tensor imaging in an ICBM template. Neuroimage. 2008;40:570–582. doi: 10.1016/j.neuroimage.2007.12.035. [DOI] [PMC free article] [PubMed] [Google Scholar]
- 24.Wuerfel J, Bellman-strobl J, Brunecker P, Aktas O, McFarland H, Villringer A, Zipp F. Changes in cerebral perfusion precede plaque formation in multiple sclerosis: a longitudinal perfusion MRI study. Brain. 2004;127:111–119. doi: 10.1093/brain/awh007. [DOI] [PubMed] [Google Scholar]
- 25.Lassmann H. Hypoxia-like tissue injury as a component of multiple sclerosis lesions. J Neurol Sci. 2003;206:187–191. doi: 10.1016/S0022-510X(02)00421-5. [DOI] [PMC free article] [PubMed] [Google Scholar]
- 26.White E, Greitz T. Subependymal venous filling sequence at cerebral angiography. Influence of grey and white matter distribution. Acta Radiol Diagn (Stockh) 1972;13(1):272–285. doi: 10.1177/02841851720130p135. [DOI] [PubMed] [Google Scholar]
- 27.Herzog H, Seitz RJ, Tellmann L, Rota Kops E, Julicher F, Schlaug G, Kleinschmidt A, Muller-Gartner HW. Quantitation of regional cerebral blood flow with 15O-butanol and positron emission tomography in humans. J Cereb Blood Flow Metab. 1996;16:645–649. doi: 10.1097/00004647-199607000-00015. [DOI] [PubMed] [Google Scholar]
- 28.Helenius J, Perkio J, Soinne L, Ostergaard L, Carano RA, Salonen O, Savolainen S, Kaste M, Aronen HJ, Tatlisumak T. Cerebral hemodynamics in a healthy population measured by dynamic susceptibility contrast MR imaging. Acta Radiol. 2003;44:538–546. doi: 10.1080/j.1600-0455.2003.00104.x. [DOI] [PubMed] [Google Scholar]
- 29.Pantoni L, Garcia JH, Gutirrez JA. Cerebral White Matter Is Highly Vulnerable to Ischemia. Stroke. 1996;27:1641–1647. doi: 10.1161/01.str.27.9.1641. [DOI] [PubMed] [Google Scholar]
- 30.Rosso C, Remy P, Creange A, Brugieres P, Cesaro P, Hosseini H. Diffusion-weighted MR imaging Cerebral perfusion in multiple sclerosis characteristics of an acute strokelike form of multiple sclerosis. AJNR Am J Neuroradiol. 2006;27:1006–1008. [PMC free article] [PubMed] [Google Scholar]
- 31.Rovira A, Pericot I, Alonso J, Rio J, Grive E, Montalban X. Serial diffusion-weighted MR imaging and proton MR spectroscopy of acute large demyelinating brain lesions: case report. AJNR Am J Neuroradiol. 2002;23:989–994. [PMC free article] [PubMed] [Google Scholar]
- 32.Waterston JA, Brown MM, Butler P, Swash M. Small deep cerebral infarcts associated with occlusive internal carotid artery disease: a hemodynamic phenomenon? Arch Neurol. 1990;47:953–957. doi: 10.1001/archneur.1990.00530090023007. [DOI] [PubMed] [Google Scholar]
- 33.Derdeyn CP, Khosla A, Videen TO, Fritsch SM, Carpenter DL, Grubb RL, Powers WJ. Severe Hemodynamic Impairment and Border Zone–Region Infarction. Radiology. 2001;220:195–201. doi: 10.1148/radiology.220.1.r01jl09195. [DOI] [PubMed] [Google Scholar]
- 34.Moody DM, Bell MA, Challa VR. Features of the cerebral vascular pattern that predict vulnerability to perfusion or oxygen deficiency: an anatomic study. AJNR Am J Neuroradiol. 1990;11:431–439. [PMC free article] [PubMed] [Google Scholar]
- 35.Craner M, Newcombe J, Black J, Hartle C, Cuzner M, Waxman S. Molecular changes in neurons in multiple sclerosis: altered axonal expression of Nav1.2 and Nav1.6 sodium channels and Na+/Ca2+ exchanger. Proc Natl Acad Sci USA. 2004;101:8168–8173. doi: 10.1073/pnas.0402765101. [DOI] [PMC free article] [PubMed] [Google Scholar]
- 36.Ames A. CNS energy metabolism as related to function. Brain Res Brain Res Rev. 2000;34:42–68. doi: 10.1016/s0165-0173(00)00038-2. [DOI] [PubMed] [Google Scholar]
- 37.Smith KJ. Newly lesioned tissue in multiple sclerosis—a role for oxidative damage? Brain. 2011;134:1877–1881. doi: 10.1093/brain/awr144. [DOI] [PubMed] [Google Scholar]
- 38.Klimova T, Chandel NS. Mitochondrial complex III regulates hypoxic activation of HIF. Cell Death Differ. 2008;15:660–666. doi: 10.1038/sj.cdd.4402307. [DOI] [PubMed] [Google Scholar]
- 39.Mao P, Reddy PH. Is multiple sclerosis a mitochondrial disease? Biochim Biophys Acta. 2010;1802:66–79. doi: 10.1016/j.bbadis.2009.07.002. [DOI] [PMC free article] [PubMed] [Google Scholar]
- 40.Campbell GR, Ziabreva I, Reeve AK, Krishnan KJ, Reynolds R, Howell O, Lassmann H, Turnbull DM, Mahad DJ. Mitochondrial DNA deletions and neurodegeneration in multiple sclerosis. Ann Neurol. 2011;69:481–492. doi: 10.1002/ana.22109. [DOI] [PMC free article] [PubMed] [Google Scholar]
- 41.Lisak RP, Benjamins JA, Nedelkoska L, Barger JL, Ragheb S, Fan B, Ouamara N, Johnson TA, Rajasekharan S, Bar-Or A. Secretory products of multiple sclerosis B cells are cytotoxic to oligodendroglia in vitro. J Neuroimmunol. 2012;246:85–95. doi: 10.1016/j.jneuroim.2012.02.015. [DOI] [PubMed] [Google Scholar]
- 42.Kotter MR, Stadelmann C, Hartung HP. Enhancing remyelination in disease--can we wrap it up? Brain. 2011;134:1882–1900. doi: 10.1093/brain/awr014. [DOI] [PubMed] [Google Scholar]
- 43.Syed YA, Hand E, Möbius W, Zhao C, Hofer M, Nave KA, Kotter MR. Inhibition of CNS remyelination by the presence of semaphorin 3A. J Neurosci. 2011;31:3719–28. doi: 10.1523/JNEUROSCI.4930-10.2011. [DOI] [PMC free article] [PubMed] [Google Scholar]
- 44.Caprariello AV, Mangla S, Miller RH, Selkirk SM. Apoptosis of oligodendrocytes in the central nervous system results in rapid focal demyelination. Ann Neurol. 2012;72:395–405. doi: 10.1002/ana.23606. [DOI] [PMC free article] [PubMed] [Google Scholar]
- 45.Moraal B, Wattjes MP, Geurts JJ, Knol DL, van Schijndel RA, Pouwels PJ, Vrenken H, Barkhof F. Improved detection of active multiple sclerosis lesions: 3D subtraction imaging. Radiology. 2010;255:154–163. doi: 10.1148/radiol.09090814. [DOI] [PubMed] [Google Scholar]