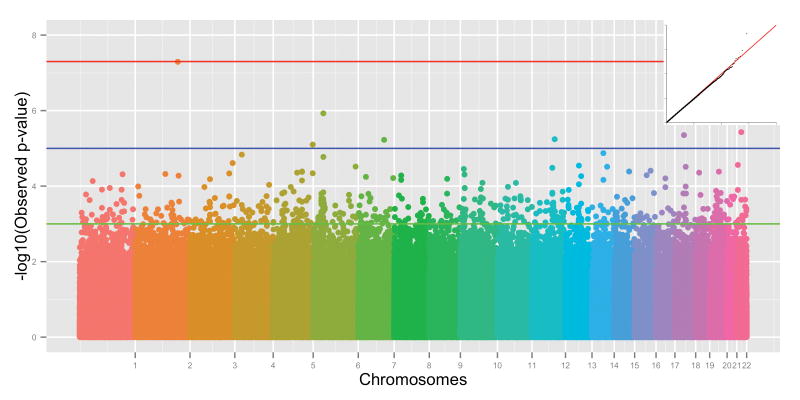
Figure 1.
Manhattan plot and Q–Q plot for the GWAS in the female sample from DNHS. The chromosomes are presented in order and color coded for ease of identification. The individual SNP p-values are represented by circles and are plotted according to –log10 scale. Three lines identify different significance threshold: green for p-value < 0.001, blue for p-value < 1 × 10⁻⁵ and red for p-value < 5 × 10⁻⁸ (i.e., genome-wide significance threshold). In the upper right corner, Q–Q plot of GWAS analyses with correction for population stratification (y-axis: observed –log10(p-value); x-axis: expected –log10(p-value). Lambdagc = 0.99, indicating adequate control of bias. For interpretation of the references to color in this figure legend, the reader is referred to the web version of the article.

