

Abstract
Background
Crossed High Alcohol Preferring (cHAP) mice were selectively bred from a cross of the HAP1xHAP2 replicate lines, and demonstrate blood ethanol concentrations (BECs) during free-choice drinking reminiscent of those observed in alcohol-dependent humans. In this report, we investigated the relationship between free-choice drinking, intoxication, tolerance, and sensitization in cHAP mice. We hypothesized that initially mice would become ataxic after drinking alcohol, but that increased drinking over days would be accompanied by increasing tolerance to the ataxic effects of ethanol.
Methods
Male and female cHAP mice had free-choice access to 10% ethanol and water (E), while Water mice (W) had access to water alone. In experiment 1, the first drinking experience was monitored during the dark portion of the cycle. Once E mice reached an average intake rate of ≥1.5 g/kg/h, they, along with W mice, were tested for footslips on a balance beam, and BECs were assessed. In experiments 2, 3, and 4, after varying durations of free-choice 10% ethanol access (0, 3, 14 or 21 days), mice were challenged with 20% ethanol and tested for number of footslips on a balance beam or locomotor stimulant response. Blood was sampled for BEC determination.
Results
We found that cHAP mice rapidly acquire alcohol intakes that lead to ataxia. Over time, cHAP mice developed behavioral tolerance to the ataxic effects of alcohol, paralleled by escalating alcohol consumption. However, locomotor sensitization did not develop following 14 days of free-choice ethanol access.
Conclusions
Overall, we observed increases in free-choice drinking with extended alcohol access paralleled by increases in functional tolerance, but not locomotor sensitization. These data support our hypothesis that escalating free-choice drinking over days in cHAP mice is driven by tolerance to alcohol’s behavioral effects. These data are the first to demonstrate that escalating free-choice consumption is accompanied by increasing alcohol tolerance. In addition to buttressing the hypothesized importance of tolerance in drinking, our findings suggest that cHAP mice may be a unique, translational resource for studying tolerance as a contributor to and consequence of chronic, excessive ethanol consumption.
Keywords: Alcohol consumption, rodent model, motor ataxia, tolerance, selected line
Introduction
Alcoholism is characterized by chronic, excessive alcohol intake (Mello and Mendelson, 1970). However, it has been difficult to model excessive intake and resulting physiological and behavioral adaptations in a voluntary, translational manner in rodents, because they generally do not sustain pharmacologically relevant voluntary intake levels across the diurnal cycle (Leeman et al., 2010, Crabbe et al., 2010). Recently, we observed stable patterns of excessive-like intake and high blood ethanol concentrations (BEC) in selectively bred high alcohol preferring (HAP) mice following 3 weeks of 24-hour free-choice ethanol access, which were derived from heterogeneous stock (Hs/Ibg). (Matson and Grahame, 2011, Matson et al., 2012). In particular, crossed HAP mice (cHAP), derived from a cross of HAP replicate 1 (HAP1) and HAP replicate 2 (HAP2) mice, drink in excess of 25 g/kg/day, achieve mean BECs in excess of 250 mg/dl, and sustain pharmacologically relevant BECs throughout the active (dark) portion of their light-dark cycle following chronic (3 weeks) ethanol access. These BECs and intakes are reminiscent of those achieved in chronic alcoholics (Mello and Mendelson, 1970), allowing investigations into causes of and effects associated with this level of intake using an animal model.
Tolerance is one of the DSM-IV criteria for alcohol abuse and dependence, and is defined as a need for markedly increased amounts of a substance to achieve intoxication, or a diminished effect with continued use of the same amount of a substance (American Psychological Association, 2000). Studying tolerance with voluntarily drinking animals allows more flexibility than human investigations because drinking history is known and can be manipulated experimentally. The development of tolerance after self-administration is an important criterion for a successful rodent model of alcoholism, particularly because tolerance is hypothesized to drive increased human consumption (Cicero, 1980, Tabakoff and Hoffman, 1988). We observed that cHAP mice show a pattern of increasing alcohol intakes during the first 7–10 days of access. This pattern is consistent with the hypothesis that mice acquire tolerance as they drink, which in turn escalates drinking levels (Matson and Grahame, 2011, Oberlin et al., 2011). We also recently observed metabolic tolerance after 3–4 weeks of free-choice ethanol access, supporting the idea that cHAP mice acquire at least one type of tolerance during ethanol consumption (Matson et al., 2012).
Because rodents have not consistently achieved high levels of intake, there are few examples of tolerance following oral self-administration of ethanol. Those present in the literature have included a history of forced alcohol exposure (Lumeng and Li, 1986), scheduled access to alcohol in the absence of water (Linsenbardt et al., 2011), or sweetened ethanol access (Darbra et al., 2002). To our knowledge, there are no examples of functional tolerance following 24-hour, 2-bottle ethanol access, let alone a demonstration that tolerance is associated with increases in alcohol consumption. To develop functional tolerance, it is arguably necessary to experience intoxication, resulting in the BEC levels and practice necessary for functional and behavioral tolerance to occur (Poulos and Cappell, 1991). Here, we sought evidence for pharmacologically relevant BECs and intoxication during the first 12 hours of voluntary drinking. Further, we ask whether tolerance to alcohol’s ataxic effects develops following free-choice ethanol access in cHAP mice.
Behavioral sensitization is an increase in responsiveness to a drug following multiple administrations, and is hypothesized to be an important process underlying the development of craving in drug dependence (Kalivas et al., 1998, Robinson and Berridge, 2000). Sensitization to the locomotor activating effects of ethanol, or locomotor sensitization, has been observed in humans and mice following repeated ethanol dosing (Newlin and Thomson, 1999, Newlin and Thomson, 2006, Phillips et al., 1994, Lessov and Phillips, 1998, Grahame et al., 2000). Linsenbardt and colleagues (2011) observed locomotor sensitization in C57Bl/6J (B6) mice following oral ethanol consumption using the drinking in the dark (Didone et al., 2008) procedure. Similarly, Lessov and colleagues (2001) observed that 24-hour, free-choice ethanol exposure in B6 mice resulted in locomotor sensitization to an ethanol challenge. However, sensitization development following drinking has not been studied in cHAP mice, which reach higher BECs during free-choice drinking than B6 mice (Matson and Grahame, 2011).
This report is separated into four experiments investigating the relationship among free-choice drinking, intoxication, tolerance, and sensitization in cHAP mice. First, we predicted that initial alcohol drinking would lead to ataxia (Experiment 1). Second, we hypothesized that increases in alcohol drinking would be accompanied by acquisition of tolerance (Experiment 2), and that longer exposure would result in more tolerance and higher alcohol drinking (Experiment 4). Third, we speculated that drinking would lead to locomotor sensitization to an ethanol challenge (Experiments 2 and 3).
Methods
Subjects
Subjects were selectively bred male and female cHAP mice, generations 18–20, bred on-site and aged 61–90 days at the beginning of the experiment. All mice were single-housed one week before testing, had ad libitum access to food and water except during behavioral test days, and were maintained at a temperature of 21 ± 2°C. In all experiments except experiment 3, mice were acclimated to a reverse 12:12 light-dark cycle for 2 weeks (lights on 20:00-08:00), and were tested during the dark cycle under red illumination. In experiment 3, mice were on a 12:12 light-dark cycle (lights on 21:00-09:00), and tested during the light portion of the cycle. Groups were counter-balanced evenly across sex and family. N’s were as follows: 24 subjects in experiment 1, 24 subjects in experiment 2, 48 subjects in experiment 3, and 79 subjects in experiment 4. In experiment 4, two cohorts of mice were used, with cohort 1 consisting of of 48 mice and cohort 2 consisting of 31 mice. Home-cage housing was in shoebox caging using pine bedding.
Procedures
Apparatus
All ataxia testing was performed on a balance beam. The balance beam was a 122x2x4 cm wooden block attached at both ends to two 48 cm ring stands placed on the floor. Mice were allowed to traverse the 2 cm portion of the wooden block. In experiment 2, activity monitors (30.5x15.5 cm) were encased in sound-attenuating chambers and had horizontal photocell beams above metal grid floors (Columbus Instruments, Columbus, OH). In experiment 3, Versamax animal activity monitors (Accuscan Instruments, Columbus, OH) were used for 15 minutes to record locomotor activity. These activity boxes (40x40 cm) had photocell beams located 2 cm above the Plexiglas floors, and are held within sound-attenuating chambers with a house light.
Free-Choice Drinking Procedures
All mice were weighed weekly. For ethanol groups, water and 10% ethanol (v/v) intakes were measured and bottles were side-switched 3 times weekly, using 25- and 50-ml graduated cylinders readable to ± 0.5 ml. For bihourly intake readings, water and 10% ethanol were presented in 10-ml pipets readable to ± 0.10 ml. Intakes were read every 2 hours beginning at lights off through lights on (08:00-20:00). Water control mice were provided with 2 water bottles using either 25 ml or 10 ml tubes, depending on the drinking procedure. All readings were taken on the home cage to minimize spillage. In the case of a leak or incorrect reading, the median value for that animal’s group and sex was used, which we previously showed results in less than 1% of the intake scores being imputed for each experiment (Matson and Grahame, 2011).
Balance Beam Procedures
Mice were weighed and trained on the balance beam 30 minutes before lights off. For all balance beam training, mice were gently prodded to traverse the beam in both directions, which has been shown to be sufficient to train mice to traverse the beam without difficulty during testing (Crabbe et al., 2003). During testing, mice were allowed to traverse the beam in both directions while an observer counted number of hind footslips. For experiments 2 and 4, mice were given a 1.75 g/kg injection of 20% ethanol/saline (v/v), which was chosen because a pilot experiment indicated that this was an optimal dose, sufficient to detect ataxia on the balance beam without mice falling off the beam.
BEC assessment
Blood samples were taken via the retro-orbital sinus, collected in heparinized Eppendorf tubes, and immediately centrifuged or stored on ice until centrifuged. Plasma was collected and stored in 1.5-ml Eppendorf tubes at -20 °C until analysis via gas chromatography (Lumeng et al., 1982).
Experiment 1
Mice were assigned to Ethanol or Water control groups, presented with drinking tubes, and bi-hourly readings were taken throughout the dark portion of the light-dark cycle (08:00-20:00). Once an Ethanol mouse reached an average intake rate of 1.5 g/kg/h during a 2-h intake period, that mouse and a sex-matched Water mouse were immediately tested on the balance beam, and a blood sample was taken from Ethanol mice to assess BEC. Although this resulted in mice being tested at different times across the dark cycle, this procedure was necessary to capture BECs immediately following initial drinking to pharmacologically relevant levels, in this case within 5 min of recording intakes.
Experiment 2
Mice were assigned to Ethanol or Water groups, and had 21 days of access to 10% alcohol and water or water only, respectively. Ethanol was removed at lights on (20:00) on day 21 to ensure ethanol clearance before behavioral testing 12 h later. On test day, mice were trained on the balance beam approximately 30 minutes prior to lights off. Beginning at lights off (08:00), mice were injected with 1.75 g/kg injection of ethanol and immediately placed in the activity monitors for 9 minutes to test for differences in sensitivity to ethanol induced locomotor stimulation as a function of drinking experience. Ten minutes after injection, mice were tested on the balance beam and a blood sample was taken.
Experiment 3
Mice were assigned to Ethanol or Water groups, and had 14 days of free-choice ethanol or water access. Ethanol was removed from the cages at lights off (21:00) on Day 14 to allow for ethanol clearance before testing. On locomotor test days, subjects were moved into the activity monitoring room 60 minutes prior to injections to habituate to the room. On Days 15 and 17, all mice received a saline injection and were immediately placed in activity monitors for 15 minutes for habituation and to obtain a baseline activity measure, respectively. A 2.0 g/kg ethanol challenge was given on Day 19 using an i.p. injection of 20% ethanol/saline (v/v). This dose was chosen based on previous successful evaluations of sensitization expression in this and other mouse genotypes (Grahame et al., 2000; Boehm et al., 2008; Lessov et al., 2001). Activity was monitored for 15 minutes immediately following injection, and blood samples were taken immediately following removal from the activity boxes.
Experiment 4
To examine the acquisition of functional tolerance, mice were assigned to one of four conditions (Figure 4a). Mice were given 0, 3, 14, or 21 days of ethanol access, and all groups were tested for ataxia on the same calendar day to avoid historical confounds with group differences. On day 21, bottles were removed at lights on (20:00) to allow for ethanol clearance. On test day (day 22), all mice were trained on the balance beam, and then injected with a 1.75 g/kg dose of ethanol. Mice were placed back in their homecage, then allowed to traverse the balance beam 10 minutes after the injection. Immediately after, blood samples were taken to assess BEC.
Figure 4.
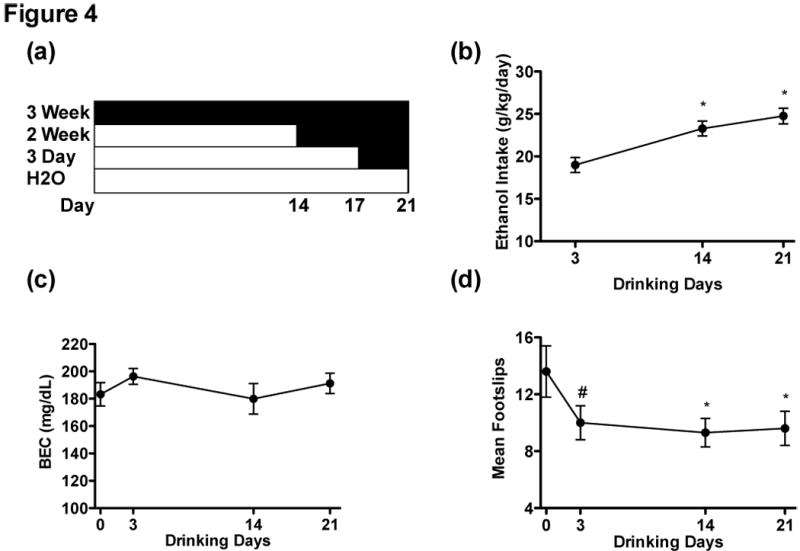
(a) Timeline for Experiment 4 . (b) Ethanol intake (in g/kg/d) during the last point of intake by the 3-day (n = 20), 2-week (n = 20), and 3-week groups (n = 20), Water group n = 19. (c) BECs did not differ across the groups immediately following balance beam testing, meaning BEC cannot account for differences in foot slips. (d) The 3-week and 2-week groups exhibited significantly fewer hindslips than the Water group following a 1.75 g/kg injection of 20% ethanol. The 3-day had a trend for fewer footslips than the Water group (p = .05). Asterisk (*) indicates p < .05, hash mark (#) indicates a trend.
Analyses
Preliminary data screening was performed using z-scores to test for outliers in the balance beam and BEC data. In the case of a z-score greater than +/- 3, a subject was removed from analysis. For balance beam and BEC data, univariate ANOVAs were performed using the between subjects variables Group, Sex (and Cohort if applicable) as independent variables. For experiment 3, an ANOVA was run using Sex, Group, and the repeated measure Inject Day as variables. Sex, Group and the repeated measure Minutes were used to analyze the ethanol challenge day for experiment 3. If Mauchley’s test of sphericity was significant, a Greenhouse-Geisser test for repeated measures was used. Dunnet’s t-tests were used as post-hoc tests to compare Ethanol groups to Water control groups. Pearson and Spearman correlations were run to assess for relationships between rate of intake and BEC, and rate of intake and footslips for experiments 1.
Results
Experiment 1: Acute Ataxia Following Free-choice Drinking
cHAP mice rapidly acquire ethanol drinking to levels that produce pharmacologically relevant BECs and ataxia. Of 12 Ethanol mice, 10 met the drinking criterion, reaching an average intake rate of 1.5 g/kg/h during the first 12-h of ethanol access. A Univariate Sex x Group ANOVA indicated that Ethanol mice exhibited more footslips than Water mice, F(1,16) = 8.32, p < 0.01, but there was no main effect of Sex, F(1,16) = 2.28, p > 0.05 (Figure 1a). There was a trend for Sex and Group to interact, F(1,16) = 4.24, p = 0.06, which appeared to be driven by female Ethanol mice, who exhibited the highest number of footslips.
Figure 1.
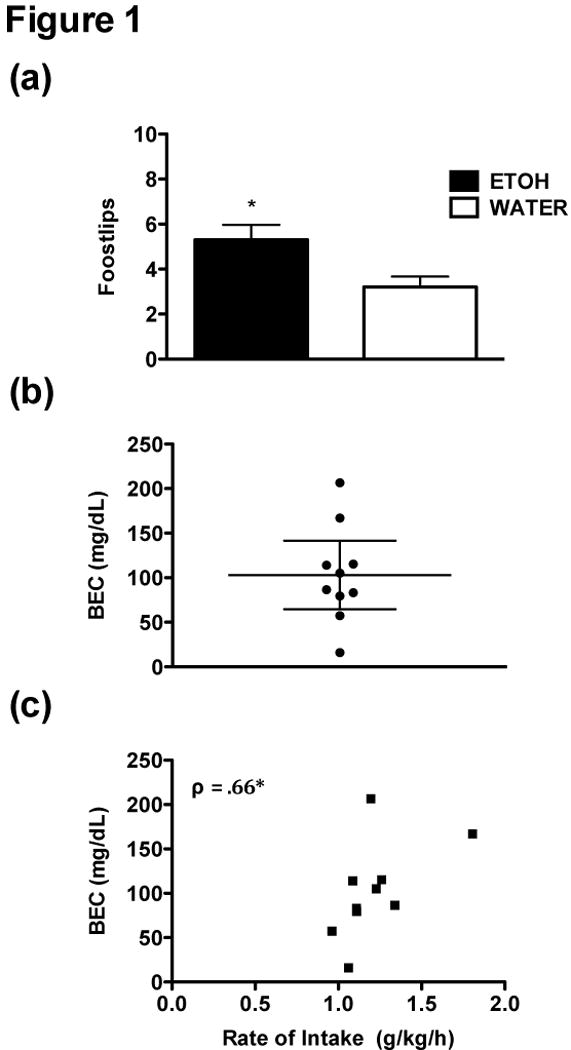
(a) Hindslips in Ethanol mice (n = 10) during the first 12 hours of ethanol access compared to Water controls (n = 10). Ethanol animals were tested after meeting a criterion intake rate of 1.5 g/kg/h during a 2-hour period (10 of 12 mice met criterion). (b) Mean and 95% confidence interval of BECs (mg/dl) following balance beam testing. A majority of tested mice reached pharmacologically relevant BECs during the first 12 h of ethanol access, with 7 of 10 mice reaching BECs >80 mg/dl (one mouse had a BEC of 79 mg/dl). (c) Spearman’s rho correlation between rate of intake (g/kg/h) and BEC. Rate of intake was calculated by dividing total intake (in g/kg) by the number of drinking hours prior to sampling. Asterisk (*) indicates p < .05.
Seven of the 10 tested mice reached BECs >80 mg/dl during the first 12 h of ethanol access (Figure 1b). Although we constricted intake rates by using a criterion, we calculated the rate of intake across the dark period and prior to sampling, and there was a significant Spearman’s correlation between rate of intake and BEC (r = .55, p > 0.05; ρ = .66, p < 0.05), indicating a non-linear relationship between rate of intake and BEC values (Figure 1c). Rate of intake was not correlated with number of footslips (ps > 0.05).
Experiment 2: Free-Choice Ethanol and Functional Tolerance
Ethanol mice reached intakes of 26.1 ± 1.5 g/kg/d by the end of the 3-week drinking period without any sex difference at this time point (p > 0.05) (Figure 2a). There was some evidence for tolerance following 3 weeks of alcohol drinking, as seen in a strong trend for Ethanol mice to have fewer footslips than Water mice after the ethanol injection, F(1, 20) = 4.35, p = 0.05 (Figure 2b), but there was no main effect of Sex or an interaction (ps > .05). BECs resulting from the injected alcohol did not differ between Ethanol and Water groups at the time of balance beam testing, showing that metabolic tolerance cannot account for the trend in Ethanol mice. Five blood samples were lost during testing due to experimenter error (3 Ethanol, 2 Water). A Sex x Group ANOVA on the remaining samples indicated there were no main effects of Sex or Group, and no interaction (ps > 0.05) (Figure 2c). The locomotor activity results are presented in the supplementary materials.
Figure 2.
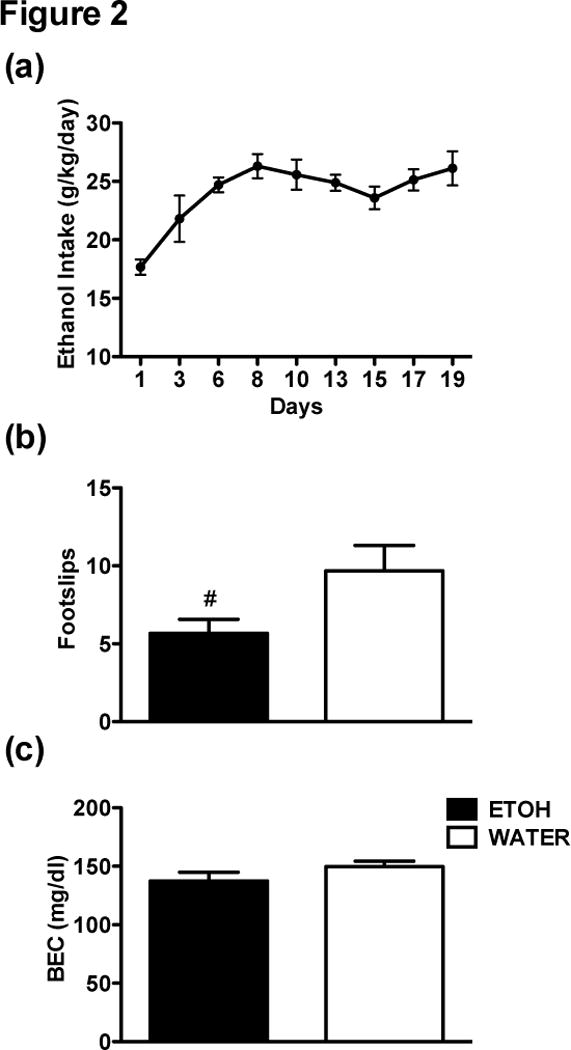
(a) Acquisition of ethanol drinking across 21 days by the Ethanol group (n = 12). Each data point is a mean of 2–3 days of drinking. (b) The Ethanol group had a trend for fewer hindslips and Water controls (n = 12) following a 1.75 g/kg injection of 20% ethanol (p = .05). (c) BECs did not differ between Ethanol and Water groups immediately following balance beam testing. Hash mark (#) indicates a trend.
Experiment 3: Free-Choice Ethanol and Locomotor Sensitization
Ethanol-exposed animals consumed 26.15 ± 6.6 g/kg/d after 2 weeks of ethanol access without any sex differences (p > 0.05). Previous ethanol experience did not induce ethanol locomotor sensitization. Mauchley’s Test for Sphericity was significant for both analyses, therefore we report Greenhouse-Geisser statistics. A repeated measures Sex x Test Day x Group ANOVA indicated a main effect of Test Day, F(1, 44) = 104.77, p < .01, with locomotion increasing on the ethanol challenge day compared to the saline day and no main effects of Sex, Group, or interactions (ps < .05) (Figure 3a). A repeated measures Sex x Group x Minutes ANOVA indicated a main effect of Minutes, F(5.8, 248.3) = 20.24, p < 0.01 but no other main effects or interactions (ps > .05). Follow-up tests revealed linear and quadratic trends, F(1, 43) = 96.90, p < 0.01 and F(1, 43) = 6.75, p < .05, respectively (Figure 3b).
Figure 3.
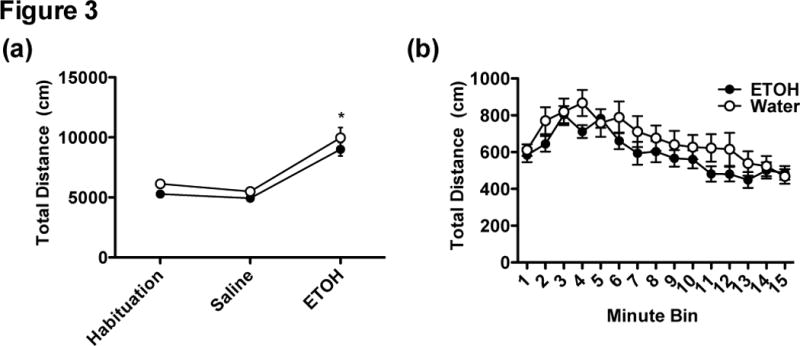
(a) The total distance traveled (cm) on habituation, saline, and ethanol challenge days. Both Ethanol (n = 24) and Water (n = 24) groups demonstrated a stimulant response following a 2 g/kg injection with 20% ethanol compared to the saline injection day. (b) Distance traveled across 15 minutes by the Ethanol and Water groups on ethanol challenge day. Asterisk (*) indicates p < .05.
Experiment 4: Time-Course of Functional Tolerance
At the end of their acquisition periods, the 2- and 3-week groups were drinking more ethanol than the 3-day group. A Group x Cohort x Sex ANOVA revealed main effects of Group and Sex, F(2, 47) = 11.08, p < 0.001 and F(1, 47) = 7.91, p < 0.007. There was also an interaction of Cohort x Sex, F(1,47) = 4.36, p < 0.05, but no other main effects or interactions (ps > 0.05). As no control was compared, a Tukey’s post-hoc was used and revealed that the 2- and 3-week groups drank significantly more than the 3-day group, but were not different from each other (ps < 0.05) (Figure 4b). Females also drank more than males, with mean intakes of 23.8 ± .7 and 20.9 ± .7 g/kg/d, respectively. The Cohort x Sex interaction appeared to be driven by female intake differences between cohorts 1 and 2, 22.4 ± .9 and 25.1 ± 1.1, while males drank similarly with intakes of 21.7 ± .9 and 20.1 ± 1.2 g/kg/d, respectively.
Alcohol drinking led to functional tolerance after 2 and 3 weeks, and a strong trend for tolerance after 3 days of free-choice ethanol exposure. A preliminary analysis revealed that one subject had a z-score of greater than -3.0 for footslips, therefore, this subject was treated as an outlier and removed from the footslip analysis. Five mice were removed from all footslip and BEC analyses because their BECs were less than 50 mg/dl at the point of testing, indicating that these were likely bad injections (a 1.75 g/kg injection should yield BECs of 150-200 mg/dl). A univariate Group x Cohort x Sex ANOVA indicated that there were main effects of Group, Cohort, and Sex, F(3, 56) = 4.19, p < 0.05, F(1, 56) = 8.75, p < 0.01, and F(1, 56) = 12.04, p < 0.005, respectively but no interactions (all ps > 0.05). Males exhibited more footslips than females (13.3 ± 0.9 and 8.8 ± 0.9, respectively). A Dunnet’s one-sided t-test indicated that the 2-week and 3-week groups had significantly fewer footslips than the water group (ps < .05), while there was a strong trend for the 3-day group to have fewer footslips than the water group (p = .06) (Figure 4c). Differences in footslips across the groups cannot be due to BEC differences at the time of testing (10 minutes), as an ANOVA showed that although there was a main effect of Cohort F(1,57) = 29.53, p < 0.001, there were no main effects of Sex or Group (ps > 0.05) or any interactions (ps > 0.05) (Figure 4b).
Discussion
We found that cHAP mice rapidly acquire alcohol intakes that lead to intoxication. As far as we know, these data are the first to demonstrate that free-choice drinking produces behavioral tolerance, and that escalating drinking accompanies tolerance. These findings support our hypothesis that tolerance to alcohol’s ataxic effects may play an important role in the ability of these animals to drink such large amounts of alcohol. Further, these data provide substantial evidence for older hypotheses about the role of tolerance in drinking (e.g., Tabakoff and Hoffman, 1988). On the other hand, we find no evidence that locomotor sensitization develops following 2 or 3 weeks of free-choice ethanol access. Overall, we document how changes in drinking associate with changes in alcohol sensitivity, utilizing a 2-bottle choice free-choice procedure, which we believe is fundamentally translational, as human consumption is voluntary in nature.
During the first 12 hours of free-choice ethanol exposure, cHAP mice encounter pharmacologically relevant BECs that cause ataxia, demonstrating evidence of intoxication. A majority (10 of 12) cHAP mice achieved a criterion intake rate of 1.5 g/k/h, resulting in a mean BEC of 103 mg/dl. Ataxia has been observed following consumed ethanol using the DID procedure (Rhodes et al., 2007, Moore et al., 2007, Linsenbardt et al., 2011). In these cases, impairment was observed following 2–3 days of ethanol experience. To our knowledge, this is the first demonstration of locomotor impairment following a single drinking session, as well as the first demonstration of intoxication with free-choice, 2-bottle ethanol access in rodents. Recently, Fritz and colleagues (2013) observed that HAP mice are initially more sensitive to the motor-impairing effects of ethanol than LAP mice, and therefore may be particularly sensitive during initial ethanol drinking. Future studies should investigate the microstructure and activity patterns during early ethanol experience in cHAP mice to further characterize early ethanol experience.
Arguably, development of functional tolerance permits drinkers to reach higher levels of intake and BECs without incapacitation, permitting high levels of alcohol exposure that may lead to the acute and chronic health problems. Most animal models of alcoholism show stable intakes over time that do not model excessive human intake. Recently, we observed that C57 and cHAP mice begin drinking around 15 g/kg/d of ethanol, and while C57 mice continue at this level for weeks, cHAP mice show about a 10 g/kg escalation in daily intakes (Matson and Grahame, 2011). BECs also escalate with extended access, as cHAP mice reach BECs of around 100 mg/dl during initial access (Figure 1), but reach in excess of 250 mg/dl following 3 weeks of access (Matson and Grahame, 2011). We have repeatedly observed an escalating intake pattern in HAP mice, which led us to pursue tolerance as a factor that promotes cHAP drinking (Oberlin et al., 2010; Matson and Grahame, 2011; Figures 2 and 4). This hypothesis receives some support here, as free-choice drinking leads to tolerance, and escalated drinking during chronic access is associated with increases in tolerance to alcohol’s ataxic effects. Therefore, future studies may employ these mice to study tolerance associated with free-choice drinking in an externally valid manner.
Genetic differences in the susceptibility to develop tolerance may contribute to higher levels of alcohol consumption. For example, following alcohol injections, alcohol-preferring (P) rats develop tolerance while alcohol-nonpreferring (NP) rats sensitize to the sedative-hypnotic effects of ethanol (Kurtz et al., 1996). In humans, alcohol produces less of a sedative response in heavy than light drinkers, but it is not apparent whether this effect is due to differences in innate sensitivity or adaptations to alcohol caused by a history of differential alcohol consumption (King et al., 2011). Further, although HAP mice are initially more sensitive to the ataxic effects of ethanol, acute functional tolerance develops faster in HAP than LAP mice (Fritz et al., 2013). The available evidence suggests that tolerance to the sedative and/or ataxic effects of ethanol may facilitate higher levels of consumption, a statement that is supported by our present findings.
Functional tolerance develops rapidly in cHAP mice, as there is a strong trend for it to be present after just 3 days of ethanol access. Although the increase in drinking by this point did not reach significance, other types of tolerance likely are associated with the escalation of intake, as we continue to observe an increase in intake after this point. Thus, there is rationale to investigate which types of tolerance are present at different timepoints after ethanol access. Although our results provide support for ataxic tolerance associated with increases in drinking, future studies should investigate metabolic tolerance, and also explicitly manipulate tolerance to determine whether it drives escalated drinking in cHAP mice.
As we did not use a habituation or saline injection day in experiment 2, experiment 3 was performed to more stringently test for the locomotor sensitization to ethanol. In sensitization paradigms using ethanol injections, locomotor sensitization has been shown to last longer than a few days after exposure, thus we hypothesized that if sensitization developed, it would persist after removal of ethanol tubes as described in experiment 2 (Lessov and Phillips, 1998, Boehm et al., 2008). For example, after 10 days of ethanol injections, locomotor sensitization has been shown to persist up to 23 days in heterogenous stock (HS/Ibg) and four weeks in D2 mice (Lessov and Phillips, 1998, Boehm et al., 2008).
We failed to observe locomotor sensitization following free-choice ethanol exposure in experiments 2 and 3. Phillips and colleagues (1995) reported a negative genetic correlation between locomotor sensitization and free-choice drinking. We reported that locomotor sensitization develops in HAP compared to Low Alcohol Preferring (LAP) mice (Grahame et al., 2000), but sensitization was not accompanied by genetic differences in acute functional tolerance. A more recent study demonstrated that HAP mice appear to be more sensitive to the ataxic effects of ethanol initially, but develop acute functional tolerance faster than LAP mice (Fritz et al., 2013). Overall, there is evidence that ataxic tolerance and locomotor sensitization are unrelated phenomena, and our data supports a role for ataxic tolerance rather than locomotor sensitization in the escalating intakes we observe in cHAP mice.
On the other hand, we observed a strong stimulant response in both water and ethanol-exposed cHAP mice (Figure 2). It is possible that a ceiling effect in locomotor activity was reached, and did not permit the observation of sensitization. Route of administration may play a role, as ethanol locomotor sensitization studies are normally conducted using injections, and it is plausible that development of ethanol sensitization is promoted by using injection procedures. Further, we used a 2.0 g/kg dose of ethanol to test for expression of sensitization, which was used in a past sensitization experiment with HAP mice (Grahame et al., 2000), but it is possible that other ethanol doses might have produced evidence of sensitization in cHAP mice following free-choice drinking. That being said, a single ethanol dose to detect the presence of sensitization is typical in the literature. To the limited extent that they have been performed, studies of other test doses support the use of 2 g/kg as a sensitive dose for detecting locomotor sensitization when it is present (Didone et al., 2008).
In conclusion, cHAP mice can be used as a model to study intoxication and to examine adaptations resulting from excessive ethanol consumption. In this case, we demonstrate that cHAP mice become intoxicated during early ethanol access, which likely contributes to the rapid development of functional tolerance we observed. Lastly, we find no evidence that 2-bottle free-choice ethanol exposure in cHAP mice results in the development of locomotor sensitization. Our findings may be important because cHAP mice encounter ethanol at a level analogous to the degree of exposure seen in chronic, excessive human consumption, suggesting they can be used as a translational model for studying the consequences of excessive ethanol consumption.
Supplementary Material
Acknowledgments
The authors would like to thank Amy Buckingham, Elizabeth Tombers, Robin Zimmer, Chrissie Best, Tammy Graves, and Laverne Melon for their technical assistance or advice. Supported by IUPUI School of Science, NIAAA P60AA07611 to David Crabb, and NIAAA T32AA07462 to William McBride.
Footnotes
Author Contributions
LM, NG, CK, and SB were responsible for the study concept and design, as well as data analysis and interpretation of the findings. All authors also contributed to the critical review and approved the final version for publication. LM and CK contributed to the acquisition of animal data.
Works Cited
- American Psychological Association. Diagnostic and Statistical Manual of Mental Disorders, in Fourth Edition, Text Revision, Fourth Edition. American Psychiatric Press; Washington, DC: 2000. Text Revision. [Google Scholar]
- Boehm SL, Goldfarb KJ, Serio KM, Moore EM, Linsenbardt DN. Does context influence the duration of locomotor sensitization to ethanol in female DBA/2J mice? Psychopharmacology. 2008;197:191–201. doi: 10.1007/s00213-007-1022-6. [DOI] [PMC free article] [PubMed] [Google Scholar]
- Cicero T. In: Alcohol self-administration, tolerance, and withdrawal in humans and animals: theoretical and methodological issues, in Alcohol tolerance and dependence Alcohol tolerance and dependence. RIGTER HC J, editor. Elsevier North Holl and Biomedical Press; Amsterdam: 1980. [Google Scholar]
- Crabbe JC, Metten P, Yu CH, Schlumbohm JP, Cameron AJ, Wahlsten D. Genotypic differences in ethanol sensitivity in two tests of motor incoordination. J Appl Physiol. 2003;95:1338–1351. doi: 10.1152/japplphysiol.00132.2003. [DOI] [PubMed] [Google Scholar]
- Crabbe JC, Phillips TJ, Belknap JK. The Complexity of Alcohol Drinking: Studies in Rodent Genetic Models. Behav Genet. 2010;40:737–750. doi: 10.1007/s10519-010-9371-z. [DOI] [PMC free article] [PubMed] [Google Scholar]
- Darbra S, Prat G, Pallares M, Ferre N. Tolerance and sensitization to the hypnotic effects of alcohol induced by chronic voluntary alcohol intake in rats. J Psychopharmacol. 2002;16:79–83. doi: 10.1177/026988110201600107. [DOI] [PubMed] [Google Scholar]
- Didone V, Quoilin C, Tirelli E, Quertemont E. Parametric analysis of the development and expression of ethanol-induced behavioral sensitization in female Swiss mice: effects of dose, injection schedule, and test context. Psychopharmacology. 2008;201:249–260. doi: 10.1007/s00213-008-1266-9. [DOI] [PubMed] [Google Scholar]
- Fritz BM, Grahame NJ, Boehm SL. Selection for high alcohol preference drinking in mice results in heightened sensitivity and rapid development of acute functional tolerance to alcohol’s ataxic effects. Genes Brain Behav. (2) 2013;12:78–86. doi: 10.1111/j.1601-183X.2012.00830.x. [DOI] [PMC free article] [PubMed] [Google Scholar]
- Grahame NJ, Rodd-Henricks K, Li TK, Lumeng L. Ethanol locomotor sensitization, but not tolerance correlates with selection for alcohol preference in high-and low-alcohol preferring mice. Psychopharmacology. 2000;151:252–260. doi: 10.1007/s002130000388. [DOI] [PubMed] [Google Scholar]
- Kalivas PW, Pierce RC, Cornish J, Sorg BA. A role for sensitization in craving and relapse in cocaine addiction. J Psychopharmacology. 1998;12:49–53. doi: 10.1177/026988119801200107. [DOI] [PubMed] [Google Scholar]
- King AC, de Wit H, McNamara PJ, Cao D. Rewarding, stimulant, and sedative alcohol responses and relationship to future binge drinking. Arch Gen Psychiatry. 2011;68:389–399. doi: 10.1001/archgenpsychiatry.2011.26. [DOI] [PMC free article] [PubMed] [Google Scholar]
- Kurtz D, Stewart R, Zweifel M, Li TK, Froehlich J. Genetic differences in tolerance and sensitization to the sedative/hypnotic effects of alcohol. Pharmacol Biochem Behav. 1996;53:585–591. doi: 10.1016/0091-3057(95)02055-1. [DOI] [PubMed] [Google Scholar]
- Leeman RF, Heilig M, Cunningham CL, Stephens DN, Duka T, O’Malley SS. Ethanol consumption: how should we measure it? Achieving consilience between human and animal phenotypes. Addict Biol. 2010;15:109–124. doi: 10.1111/j.1369-1600.2009.00192.x. [DOI] [PMC free article] [PubMed] [Google Scholar]
- Lessov CN, Phillips TJ. Duration of sensitization to the locomotor stimulant effects of ethanol in mice. Psychopharmacology. 1998;135:374–382. doi: 10.1007/s002130050525. [DOI] [PubMed] [Google Scholar]
- Linsenbardt DN, Moore EM, Griffin KD, Gigante ED, Boehm SL. Tolerance to ethanol’s ataxic effects and alterations in ethanol-induced locomotion following repeated binge-like ethanol intake using the DID model. Alcohol Clin Exp Res. (2) 2011;35:1246–1255. doi: 10.1111/j.1530-0277.2011.01459.x. [DOI] [PMC free article] [PubMed] [Google Scholar]
- Lumeng L, Li TK. The development of metabolic tolerance in the alcohol-preferring P rats: comparison of forced and free-choice drinking of ethanol. Pharmacol Biochem Behav. 1986;25:1013–1020. doi: 10.1016/0091-3057(86)90079-1. [DOI] [PubMed] [Google Scholar]
- Lumeng L, Waller MB, McBride WJ, Li TK. Different sensitivities to ethanol in alcohol-preferring and -nonpreferring rats. Pharmacol Biochem Behav. 1982;16:125–130. doi: 10.1016/0091-3057(82)90023-5. [DOI] [PubMed] [Google Scholar]
- Matson L, Liangpunsakul S, Crabb D, Buckingham A, Ross RA, Halcomb M, Grahame N. Chronic Free-Choice Drinking in Crossed High Alcohol Preferring Mice Leads to Sustained Blood Ethanol Levels and Metabolic Tolerance Without Evidence of Liver Damage. Alcohol Clin Exp Res. 2012;37:194–201. doi: 10.1111/j.1530-0277.2012.01873.x. [DOI] [PMC free article] [PubMed] [Google Scholar]
- Matson LM, Grahame NJ. Pharmacologically relevant intake during chronic, free-choice drinking rhythms in selectively bred high alcohol-preferring mice. Addict Biol. 2011 doi: 10.1111/j.1369-1600.2011.00412.x. [DOI] [PMC free article] [PubMed] [Google Scholar]
- Mello NK, Mendelson JH. Experimentally induced intoxication in alcoholics: a comparison between programed and spontaneous drinking. J Pharmacol Exp Ther. 1970;173:101–116. [PubMed] [Google Scholar]
- Moore EM, Serio KM, Goldfarb KJ, Stepanovska S, Linsenbardt DN, Boehm II., SL GABAergic modulation of binge-like ethanol intake in C57BL/6J mice. Pharmacol Biochem Behav. 2007;88:105–113. doi: 10.1016/j.pbb.2007.07.011. [DOI] [PMC free article] [PubMed] [Google Scholar]
- Newlin DB, Thomson JB. Chronic tolerance and sensitization to alcohol in sons of alcoholics: II. Replication and reanalysis. Exper Clin Psychopharmacology. 1999;7:234. doi: 10.1037//1064-1297.7.3.234. [DOI] [PubMed] [Google Scholar]
- Newlin DB, Thomson JB. Chronic tolerance and sensitization to alcohol in sons of alcoholics. Alcohol Clin Exp Res. 2006;15:399–405. doi: 10.1111/j.1530-0277.1991.tb00537.x. [DOI] [PubMed] [Google Scholar]
- Oberlin B, Best C, Matson L, Henderson A, Grahame N. Derivation and characterization of replicate high- and low-alcohol preferring lines of mice and a high-drinking crossed HAP line. Behavior genetics. 2011;41:288–302. doi: 10.1007/s10519-010-9394-5. [DOI] [PMC free article] [PubMed] [Google Scholar]
- Phillips TJ, Crabbe JC, Metten P, Belknap JK. Localization of genes affecting alcohol drinking in mice. Alcohol Clin Exp Res. 1994;18:931–941. doi: 10.1111/j.1530-0277.1994.tb00062.x. [DOI] [PubMed] [Google Scholar]
- Phillips TJ, Huson M, Gwiazdon C, Burkhart, Kasch S, Shen EH. Effects of acute and repeated ethanol exposures on the locomotor activity of BXD recombinant inbred mice. Alcohol Clin Exp Res. 1995;19:269–278. doi: 10.1111/j.1530-0277.1995.tb01502.x. [DOI] [PubMed] [Google Scholar]
- Poulos CX, Cappell H. Homeostatic theory of drug tolerance: a general model of physiological adaptation. Psychol Rev. 1991;98:390–408. doi: 10.1037/0033-295x.98.3.390. [DOI] [PubMed] [Google Scholar]
- Rhodes JS, Ford MM, Yu CH, Brown LL, Finn DA, Garland T, Jr, Crabbe JC. Mouse inbred strain differences in ethanol drinking to intoxication. Genes Brain Behav. 2007;6:1–18. doi: 10.1111/j.1601-183X.2006.00210.x. [DOI] [PubMed] [Google Scholar]
- Robinson TE, Berridge KC. The psychology and neurobiology of addiction: an incentive-sensitization view. Addiction 95 Suppl. 2000;2:S91–117. doi: 10.1080/09652140050111681. [DOI] [PubMed] [Google Scholar]
- Tabakoff B, Hoffman PL. Tolerance and the etiology of alcoholism: Hypothesis and mechanism. Alcohol Clin Exp Res. 1988;12:184–186. doi: 10.1111/j.1530-0277.1988.tb00157.x. [DOI] [PubMed] [Google Scholar]
Associated Data
This section collects any data citations, data availability statements, or supplementary materials included in this article.