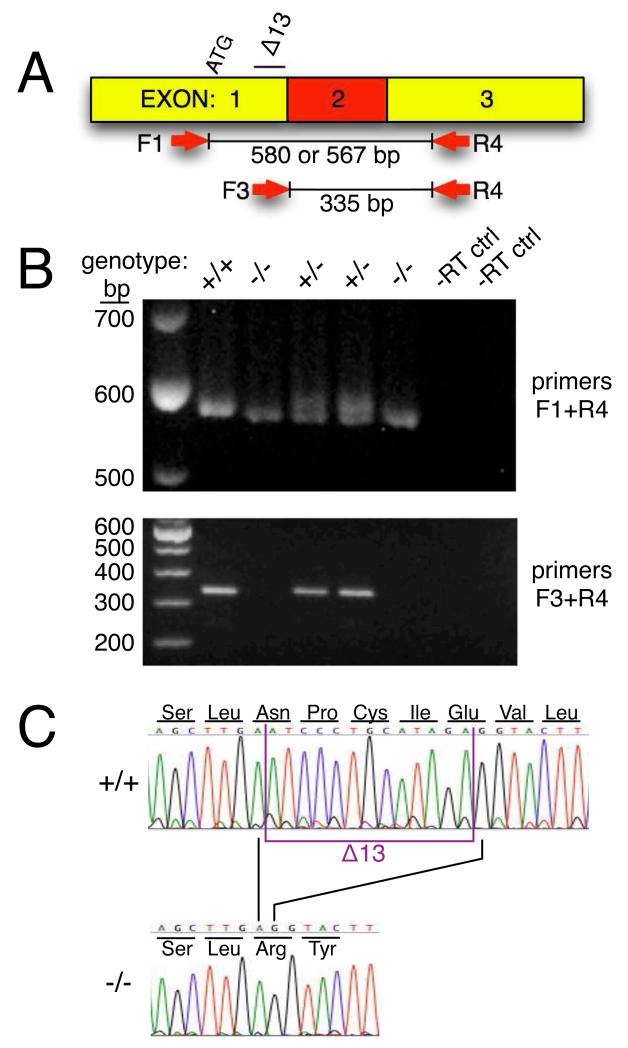
Figure 2.
Analysis of Tlr4 mRNA A. Diagram of Tlr4 cDNA illustrating position of start codon (ATG), 13-bp deletion (Δ13), and PCR primers used for RT-PCR analyses. B. Top panel is an agarose gel photograph of RT-PCR products using primers F1 + R4. Note that samples of all genotypes amplified with this primer set. The wild type allele produces a 580-bp product whereas the mutant allele produces a 567-bp product. Samples processed without the addition of reverse transcriptase to the reactions (-RT ctrl) did not amplify. Bottom panel is an agarose gel photograph of RT-PCR products using primers F3 + R4. Note that wild type (+/+) and heterozygous (+/−) samples produced the 335-bp product but the 2 homozygous mutant (−/−) samples failed to amplify. C. DNA sequence chromatograms of F1 + R4 RT-PCR products demonstrating the 13-bp deletion in the −/− sample.

