Abstract
The nature and organization of segregation shifted profoundly in the United States over the course of the twentieth century. During the first two-thirds of the century, segregation was defined by the spatial separation of whites and blacks. What changed over time was the level at which this racial separation occurred, as macro-level segregation between states and counties gave way steadily to micro-level segregation between cities and neighborhoods. During the last third of the twentieth century, the United States moved toward a new regime of residential segregation characterized by moderating racial-ethnic segregation and rising class segregation, yielding a world in which the spatial organization of cities and the location of groups and people within them will increasingly be determined by an interaction of race and class and in which segregation will stem less from overt prejudice and discrimination than from political decisions about land use, such as density zoning.
Segregation involves the separation of socially defined groups in space, such that members of one group are disproportionately concentrated in a particular set of geographic units compared with other groups in the population. The groups themselves may be defined on the basis of any socially meaningful trait—race, ethnicity, income, education, age, and so on—and segregation may occur at a variety of geographic levels—state, county, municipality, neighborhood, or block. Which social groups are spatially separated and at what levels define the nature of segregation in any society.
During the first two-thirds of the twentieth century, the United States was segregated primarily on the basis of race, with a high degree of spatial separation maintained between blacks and whites (Massey and Denton 1993). What changed over time was the level at which the segregation occurred, with the locus of racial separation progressively shifting from the macro level (states and counties) to the micro level (municipalities and neighborhoods) from 1900 to 1970 (Massey and Hajnal 1995). Until the 1970s, neighborhood segregation stemmed from overt white prejudice, pervasive discrimination in housing and lending markets, and racially biased federal policies (Jackson 1985; Massey and Denton 1993; Katznelson 2005). As civil rights laws passed in the 1960s and 1970s began to blunt the forces of prejudice and discrimination, levels of black–white segregation began to trend downward, albeit slowly.
The new antidiscrimination legislation applied to Latinos and Asians as well, whose numbers burgeoned after 1965 with the revival of mass immigration (Massey 1995). Yet, despite the huge increase in immigrant populations throughout the United States, Hispanic and Asian segregation barely rose. Even as immigrant enclaves expanded in many cities, earlier arrivals were able to join second- and third-generation group members in more integrated neighborhoods as socioeconomic status rose (Iceland and Wilkes 2006). With black segregation declining and the segregation of Asians and Latinos remaining moderate despite their huge increase in population, segregation on the basis of race and ethnicity became less salient in American society during the last third of the twentieth century.
Although the outlawing of racial discrimination and the implementation of new civil rights protections slowly mitigated the centrality of racial-ethnic segregation in American life, a radical transformation of the U.S. political economy was under way to create a new potential for spatial segregation along economic lines. The period from 1940 to 1970 had been an age of egalitarian capitalism when the median income rose, poverty rates fell, and income inequality declined (Danziger and Gottschalk 1995; Levy 1998). During the 1970s, however, these trends reversed themselves and poverty rates rose, the ranks of the affluent expanded, and the middle class withered. By 2005, income inequality had reached levels not seen since 1929, and these new economic divisions were expressed geographically in the form of rising socioeconomic segregation (Massey and Fischer 2003; Massey 2007).
In this article, we consider the changing nature of segregation in the United States over the course of the twentieth century. We begin by addressing the historical separation of blacks and whites on the basis of race and document the shift from macro- to micro-level segregation during the first two-thirds of the century. We then consider the emergence of a new, more moderate regime of racial-ethnic segregation in the post–civil rights era by analyzing trends in the residential segregation of blacks, Hispanics, and Asians after 1970. We then document the emergence of new forms of socioeconomic segregation by studying recent trends in segregation by income, education, and ideology between 1970 and 2000. We conclude with a discussion of the nature of contemporary segregation in the United States and the mechanisms by which it is maintained.
SEGREGATION IN BLACK AND WHITE
It Is no secret that black and white Americans historically have occupied very different spaces in American political geography, with the former generally being relegated to the least advantaged segments of the socioeconomic landscape (see Taeuber and Taeuber 1965; Massey and Denton 1993). Segregation can be measured along five distinct conceptual dimensions (Massey and Denton 1988): evenness, isolation, clustering, centralization, and concentration. The latter three assess the physical location of geographic units inhabited by members of a particular group. Clustering is the tendency for geographic units to bunch together in space, centralization is the tendency for them to be located around some central point, and concentration refers to the amount of physical space they occupy. Although of considerable interest in studying neighborhood-level segregation, these dimensions are less relevant to segregation at other geographic levels, so we focus our attention here on the first two dimensions—evenness and isolation.
Evenness is the degree to which two or more groups are distributed evenly over a set of geographic units. It is most commonly measured by the index of dissimilarity, which varies from 0 to 1.0, with the former value indicating perfect evenness and the latter maximum separation. A group is evenly distributed when each geographic unit has the same percentage of group members as the total population. The index gives the relative share of group members who would have to exchange places to achieve an even distribution (see White 1986; Massey and Denton 1988). In terms of black–white segregation, a score of .60 means that 60 percent of blacks would have to exchange places with whites in other units to achieve an even geographic distribution.
Isolation is the degree to which people inhabit geographic units inhabited primarily by members of their own group. It is commonly measured using the P* isolation index, which also varies from 0 to 1.0 and is defined as the proportion of own-group members in the unit of the average person (see Massey and Denton 1988). In measuring black isolation, for example, a score of 1.0 means that the average black person lives in a neighborhood that is 100 percent black, and a score approaching 0 means that this person lives in a neighborhood where he or she is nearly the only black resident.
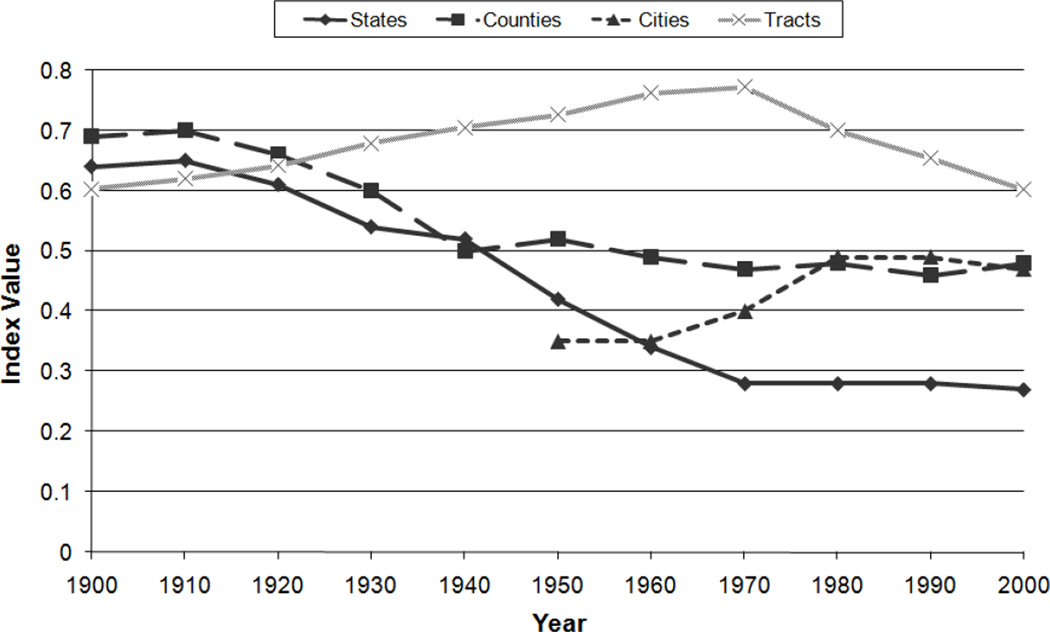
Figure 1 shows trends in black–white dissimilarity at the state, county, municipal, and tract levels from 1900 to 2000. Indices defined at the first three levels are taken from Massey and Hajnal (1995) and updated to 2000 by new computations from census data (the data necessary to compute municipal-level segregation are unavailable before 1950). Tract-level indices are taken from Cutler,Glaeser, and Vigdor (1999) and represent average dissimilarity scores computed for sixty-five cities with small area data (tracts or wards) throughout the period.1 In the original Cutler et al. (1999) data, the indices computed from 1900 to 1930 refer to wards rather than tracts, which creates a scale problem in assessing trends. Because wards are geographically larger than tracts, they yield systematically lower levels of measured segregation, so to put the entire series on the same metric we took advantage of the fact that for 1940, Cutler et al. computed indices for both sets of units, enabling us to estimate a simple conversion formula: Tract Dissimilarity = .501 + .433 H Ward Dissimilarity (r2 = .719), which we estimated over the cities with data accessible in 1940. We applied this formula to adjust the ward-based indices from 1900 to 1930 to the same metric as the tract-based indices from 1940 to 2000.
Figure 1.
Black-white dissimilarity at different geographic levels
In general, tract-level dissimilarity indices above .60 are considered “high” (Kantrowitz 1979), and by this criterion, black–white segregation was high at all geographic levels at the dawn of the twentieth century. Most white Americans never came into contact with African Americans because the vast majority of the latter lived in rural southern counties. In 1900, for example, the black–white dissimilarity was .64 at the state level and .69 at the county level. Within cities, black–white segregation was high but not extreme, with a dissimilarity index of .60. At the outset of the twentieth century, therefore, blacks and whites were quite highly segregated at all geographic levels.
This situation changed little until the First World War, when the great black migration began in earnest (Massey and Denton 1993). The period 1920 through 1970 witnessed a sustained out-migration of blacks from the rural South to cities in the North as well as the South (Grossman 1989; Lemann 1991). As African Americans redistributed themselves regionally, state-level dissimilarity fell, going from .65 in 1900 to bottom out at .28 in 1970. Over the same period, black–white dissimilarity at the county level fell from .69 to .47. As African Americans increasingly urbanized, however, segregation within cities rose from high to rather extreme levels, with the tract-level dissimilarity between blacks and whites going from an average of .60 in 1900 to .77 in 1970. In many cities levels reached .80 and even .90. No group in the history of the United States has ever experienced such extreme residential segregation, either before or since (Massey and Denton 1993).
By the 1960s, the rural-urban migration of African Americans had cumulated to such an extent that for the first time in American history entire cities—Atlanta, Baltimore, Detroit, Gary, Washington, and others—became majority-black, yielding a new geography of segregation across municipal boundaries. When we first pick up municipal-level segregation in 1950 the black-white dissimilarity across city lines was .35, but three decades later it had reached a value of .49.
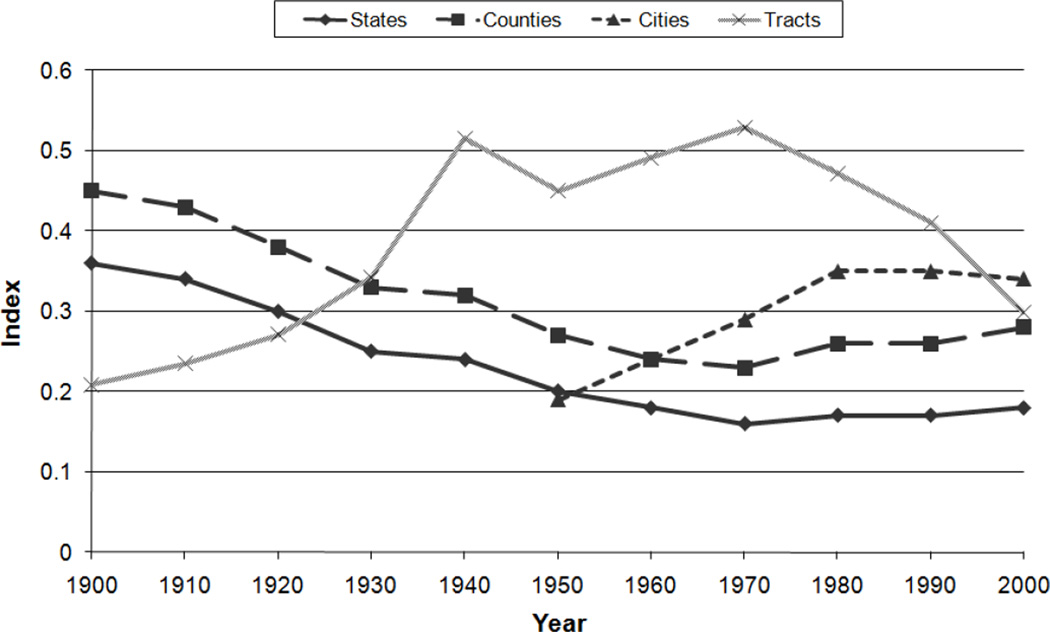
In sum, as blacks and whites became more evenly distributed across states and counties during the first two-thirds of the twentieth century, they became less evenly distributed at the city and neighborhood levels. This shift from macro to micro segregation is also clear in trends for racial isolation indices. As before, we used data from 1940 to estimate a ward-tract conversion equation (Tract Isolation = .158 + .984 H Ward Isolation, r2 = .704) and used it to convert the 1900 to 1930 ward indices to the metric of tracts, with the equation again estimated across cities in 1940. Figure 2 plots trends in black isolation at the state, county, municipal, and tract levels from 1900 to 2000.
Figure 2.
Black isolation at different geographic levels
In 1900, black isolation occurred mainly at the regional rather than the neighborhood level. In that year, the average African American lived in a state that was 36 percent black and occupied a county that was 45 percent black. As the great black migration unfolded over the next seventy years, however, these values steadily dropped to reach respective values of 16 and 23 percent by 1970, but as black isolation within states and counties fell, isolation within tracts shot upward. From an average tract-level isolation of .21 in 1900, the index rose steeply to hit .52 by 1950; from then until 1980, it fluctuated between .45 and .52. By mid-century, the average urban African American lived in a neighborhood that was roughly half black. Even as neighborhood isolation stabilized after 1940, black isolation at the municipal level continued to rise. Whereas the average African American lived in a municipality that was 19 percent black in 1950, by 1980, the figure had climbed to 35 percent.
After 1970, however, the geographic structure of black segregation began to change once again. While residential dissimilarity and isolation at the state, county, and city levels remained relatively stable at low to moderate levels, indices at the tract level began to fall. From 1970 to 2000, average black–white dissimilarity fell from .77 to .60, essentially wiping out the increases of the middle century and returning to the level observed in 1900. Over the same period, the isolation index fell from .53 to .30. Thus, after rising steadily during the first two-thirds of the twentieth century, the walls of the black urban ghetto fell slowly but surely in the last third.
SEGREGATION IN A MULTIRACIAL WORLD
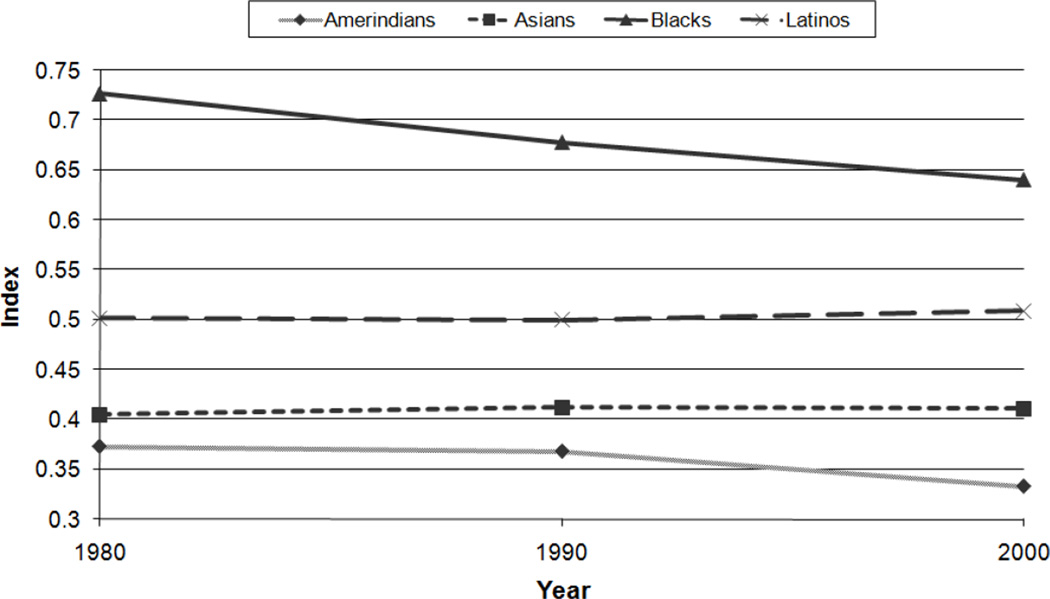
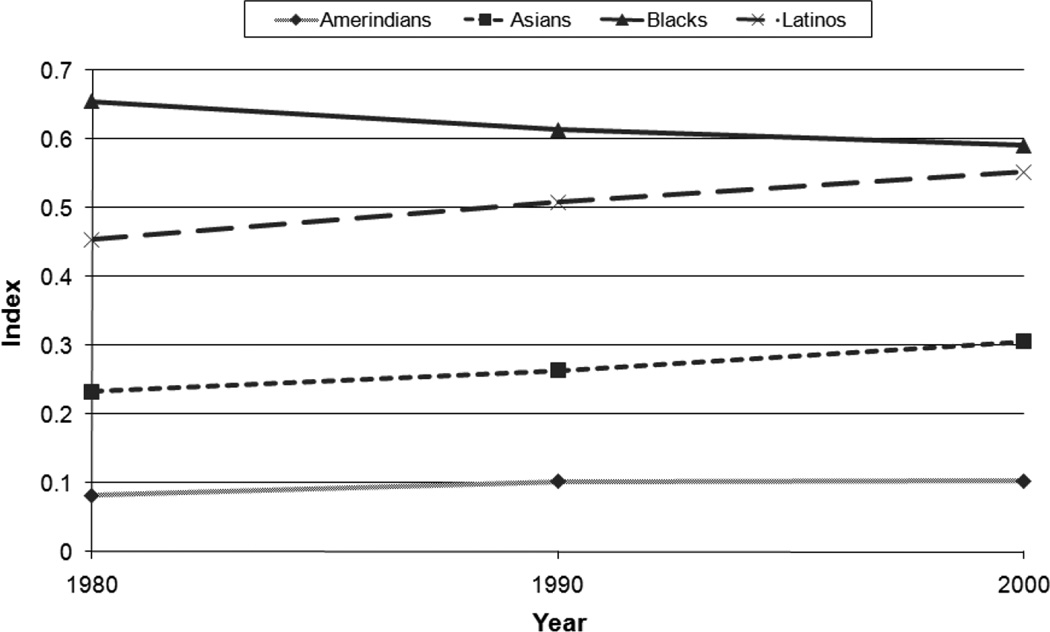
By the end of the twentieth century, however, the social world of the United States had been radically transformed from a binary division of people into black and white into a more variegated division that included new groups from Asia, Latin America, the Caribbean, Africa, and the Pacific. In this section, we use dissimilarity and isolation indices computed by Iceland, Weinberg, and Steinmetz (2002) for all metropolitan areas in the United States to consider recent trends in tract-level segregation for Asians, African Americans, Latinos, and American Indians. Figure 3 presents dissimilarity indices for each group relative to non-Hispanic whites, and Figure 4 shows each group’s tract-level isolation index for 1980 to 2000. The decline in black segregation noted earlier for the subset of sixtyfive cities with historical data is replicated here across all metropolitan areas in the United States, though the decline is somewhat less pronounced. During the last decades of the twentieth century, the average black–white dissimilarity index fell from .73 to .64, while average black isolation dropped from .66 to .59. Although by no means close to elimination, the black–white residential color line was receding as a boundary in American life, however slow and tentative the pace of change.
Figure 3.
Dissimilarity from non-Hispanic whites in U.S. metropolitan areas
Figure 4.
Residential isolation within U.S. metropolitan areas
Compared with African Americans, the other major racial-ethnic groups displayed much lower levels of segregation throughout the period. The dissimilarity index for Latinos stood at .50 in 1980, whereas that for Asians was .31 and that for American Indians was .37, compared with a black index of .73. As with African Americans, over the next two decades, dissimilarity for American Indians slowly fell, going from .37 to .33, while indices for Asians and Latinos remained virtually constant. This constancy does not indicate a lack of progress on the residential front, however. On the contrary, it is quite remarkable given the marked increase in immigration from Asia and Latin America during the period, a demographic trend that earlier in the century had brought rising levels of ethnic segregation (Lieberson 1963, 1980). The lack of an increase in residential dissimilarity despite massive population growth among Latinos and Asians suggests the relative openness of U.S. housing markets to newcomers, as one might expect in the post–civil rights era.
When combined with constant residential dissimilarities, however, rising numbers of Asians and Latinos necessarily yield higher levels of isolation, and this is what we observe in Figure 4. In the absence of a simultaneous increase in dissimilarity, however, the increases in tract-level isolation brought by rising numbers are quite modest. The Asian isolation index goes from .23 to .31, and the Latino index shifts from .45 to .55. The isolation of American Indians within urban neighborhoods remained low throughout the period, being .08 in 1980 and just .10 in 2000.
During the final decades of the twentieth century, therefore, black residential dissimilarity and isolation steadily fell, and dissimilarity levels remained virtually constant for American Indians, Latinos, and Asians, despite huge increases in the population of the latter two groups. Over the same period, isolation levels remained low for Asians and American Indians, while Latino isolation approached that of blacks, owing to radically increased numbers. In the new multiracial America, then, segregation seemed to moderate as a structural feature of American society.
THE NEW SOCIOECONOMIC SEGREGATION
As racial-ethnic segregation declined in importance during the final decades of the twentieth century, however, new forms of socioeconomic segregation were on the rise, enabled by a spectacular rise in income inequality. The average constant dollar income earned by the top 5 percent of households went from $145,000 in 1973 to $253,000 in 2003, a gain of 75 percent in real terms. In contrast, the income earned by the median household went from $38,000 to $43,000, for a gain of just 13 percent; and that earned by the bottom 20 percent of households went from $9,500 to $10,000, for a gain of just 5 percent. From 1973 to 2003, the Gini coefficient for household income went from .395 to .464 (Massey 2007).
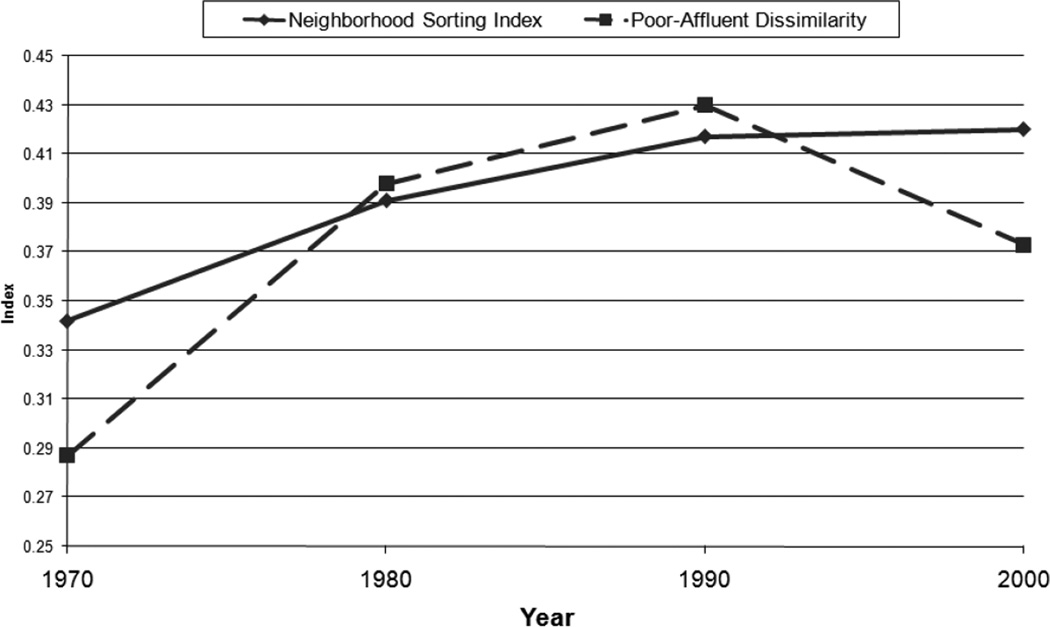
Rising inequality in the economic sphere was accompanied by growing separation in the spatial realm, as households increasingly sorted themselves by income and wealth within America’s urban geography. Figure 5 draws on Massey and Fischer (2003) to show average tract-level residential dissimilarities between poor and affluent households in U.S. metropolitan areas from 1970 to 2000, where poor households are defined as those earning under the federal poverty threshold for a family of four, and affluent households are those with incomes at least four times this amount. As an alternative measure of income segregation, we also show neighborhood sorting indices computed by Watson (2005). This index is defined as the square root of the ratio of between-tract income variance to the total income variance; it offers an overall measure of income segregation that reflects separation throughout the income distribution rather than just between the top and bottom (see Jargowsky 1997).
Figure 5.
Measures of income segregation in U.S. metropolitan areas.
Whatever index one uses, the figure clearly shows that the period 1970 through 1990 was one of growing residential segregation on the basis of economic status. In just two decades the affluent-poor dissimilarity index rose from .29 in 1970 to .43 in 1990, and the class sorting index climbed from .34 to .42. Although in both cases class segregation appeared to moderate during the economic boom of the 1990s, the degree of neighborhood segregation between affluent and poor families remained much greater in 2000 than in 1970. The income and wealth created in the 1990s did not return the United States to the status quo ante of the 1960s.
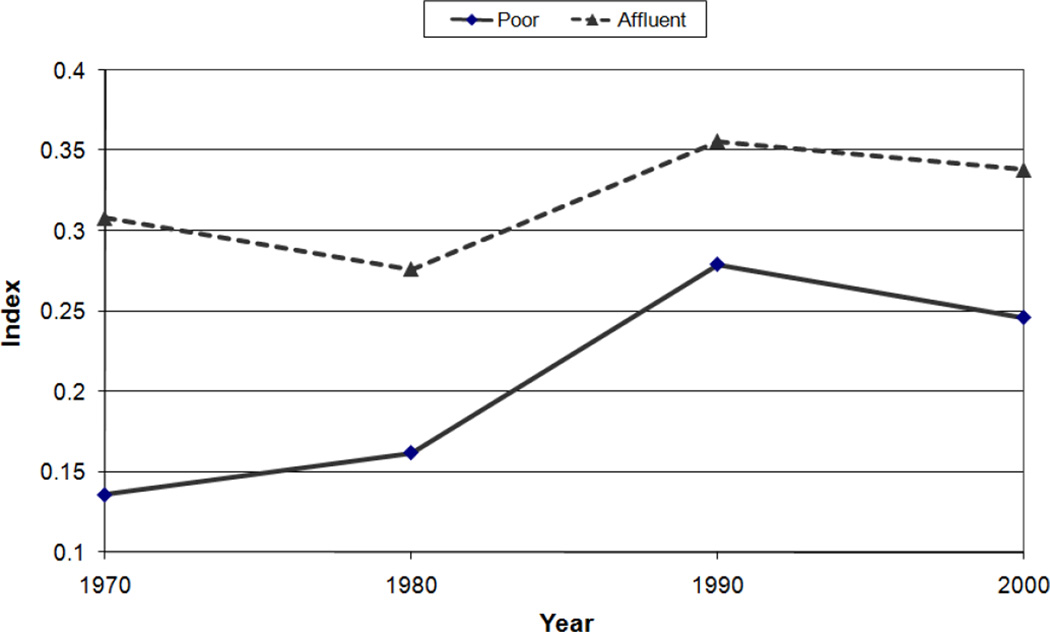
The increase in segregation by income was accompanied by a corresponding increase in class isolation. Figure 6 shows average isolation indices for affluent and poor households computed by Massey and Fischer (2003) for U.S. metropolitan areas between 1970 and 2000. Whereas the average poor family lived in a tract that was 14 percent poor in 1970, the percentage had doubled to 28 percent by 1990, and whereas the average affluent family lived in a neighborhood that was 31 percent affluent in 1970, this figure reached 36 percent by 1990. Although both indices dipped slightly between 1990 and 2000, levels once again remained well above those observed in 1970. As class segregation rose, in other words, both poverty and affluence grew more geographically concentrated within the neighborhoods of U.S. metropolitan areas.
Figure 6.
Measures of income isolation in U.S. metropolitan areas
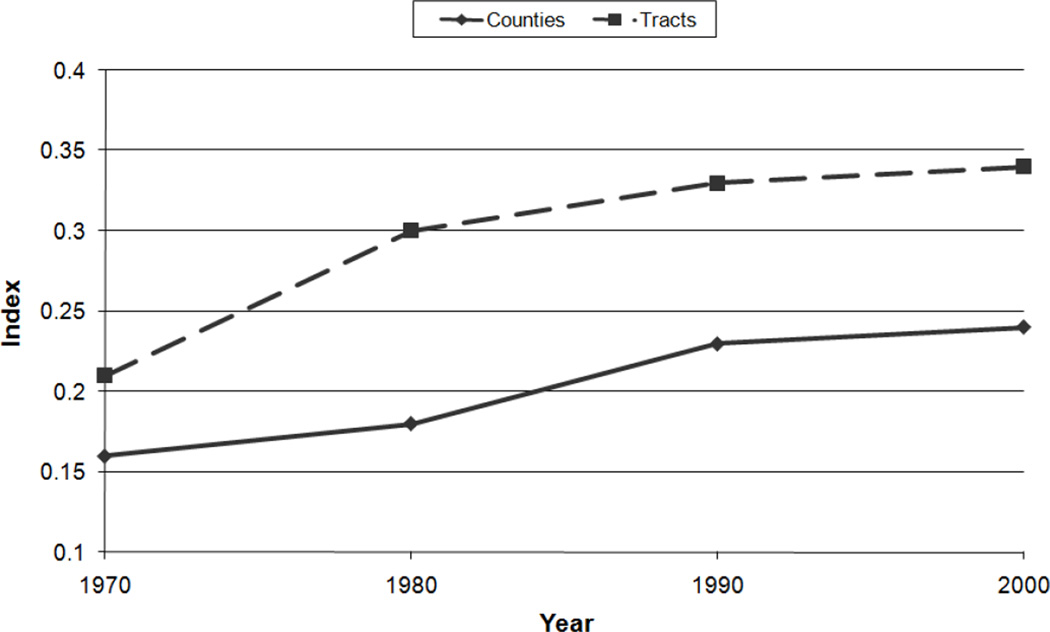
The trend toward segregation on the basis of social class is steadier when measured using the neighborhood sorting index, going from a value of .34 in 1970 to .42 in 1990 and staying there through the year 2000. The permanence of the shift is also suggested when we use education to indicate socioeconomic status. Figure 7 presents dissimilarity indices computed between high school and college graduates by Domina (2006) for counties and census tracts in the United States between 1970 and 2000. As can be seen, over this period college graduates increasingly came to occupy different locations in the political geography than those having only a high school education. The high school–college dissimilarity index rose from .16 in 1970 to .24 in 2000 at the county level and from .21 to .34 at the tract level.
Figure 7.
Dissimilarity between high school and college graduates
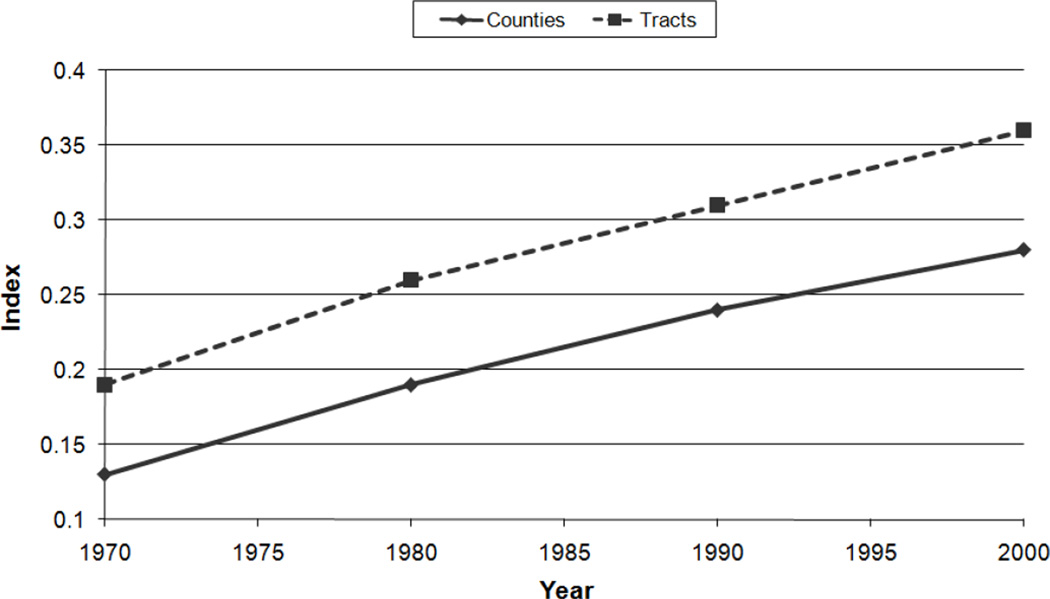
As Figure 8 shows, these increases in dissimilarity were accompanied by even sharper increases in isolation, as college- educated people increasingly came to inhabit spaces populated mainly by other college-educated people. Thus, from 1970 to 2000, the isolation index for college graduates steadily increased, climbing from .13 to .28 at the county level and from .19 to .36 at the tract level. During the late twentieth century, in other words, the well educated and the affluent increasingly segmented themselves off from the rest of American society, a trend that Reich (1991) labeled “the secession of the successful.” The New Ideological Segregation According to data assembled by McCarty, Poole, and Rosenthal (2006), the rise in income inequality in the United States was accompanied by a parallel polarization of the polity on the basis of ideology. Here, we seek to assess whether this new ideological polarization was expressed geographically. Unfortunately, national data on political attitudes come mainly from surveys based on samples that are not large enough to produce stable estimates for areas as small as census tracts.
Figure 8.
Isolation of the college educated within counties and census tracts.
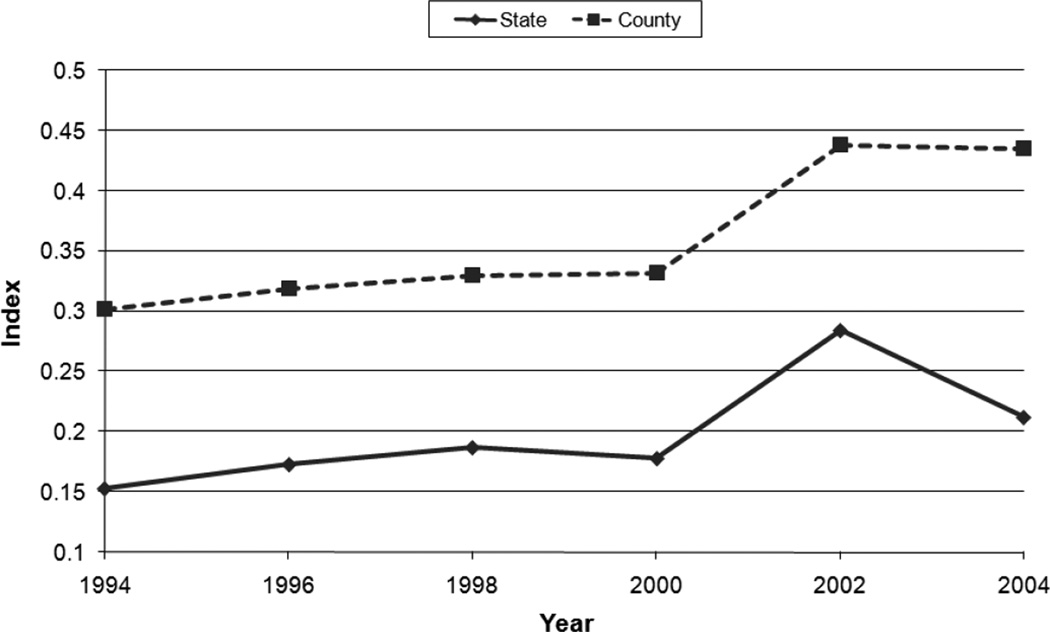
We were able, however, to use the General Social Survey question on political identification to compute county- and state-level indices of dissimilarity between liberals and conservatives for the period 1994 to 2004, and these computations are presented in Figure 9. As can be seen, the spatial segregation of liberals from conservatives generally increased slowly from 1994 up to the bitterly divided election of 2000, but after that, ideological dissimilarity shot markedly upward. Whereas the liberal-conservative dissimilarity index moved from .15 to .18 at the state level between 1994 and 2000, it jumped from .18 to .28 in the two years from 2000 to 2002. At the county level, the index drifted upward from .30 to .33 between 1994 and 2000 before spiking to .43 in 2002. Although dissimilarity fell somewhat at the state level by 2004, it held steady at the county level, suggesting that at the dawn of the new century, liberals and conservatives increasingly occupied different locations in the American political geography, a phenomenon often captured popularly by the “red state–blue state” metaphor.
Figure 9.
Dissimilarity between liberals and conservatives
The segmentation of the national geography by class and ideology will inevitably be reflected at the level of congressional districts, which in size generally lie between tracts and counties or states. Of course, the gerrymandering of district lines to create Democratic-leaning or Republican-leaning districts has been a staple of American political life since the nation’s inception; but with new geographic databases and software, what was once an art has become a science, resulting in a Congress that is increasingly polarized along ideological lines (McCarty, Poole, and Rosenthal 2006). Although we could not locate a data file of congressional districts that included information on income, education, or ideology, we did uncover a data set generated by Adler (2008) that included information on the occupational composition of districts, enabling us to compute rudimentary indices of class segregation across district lines.
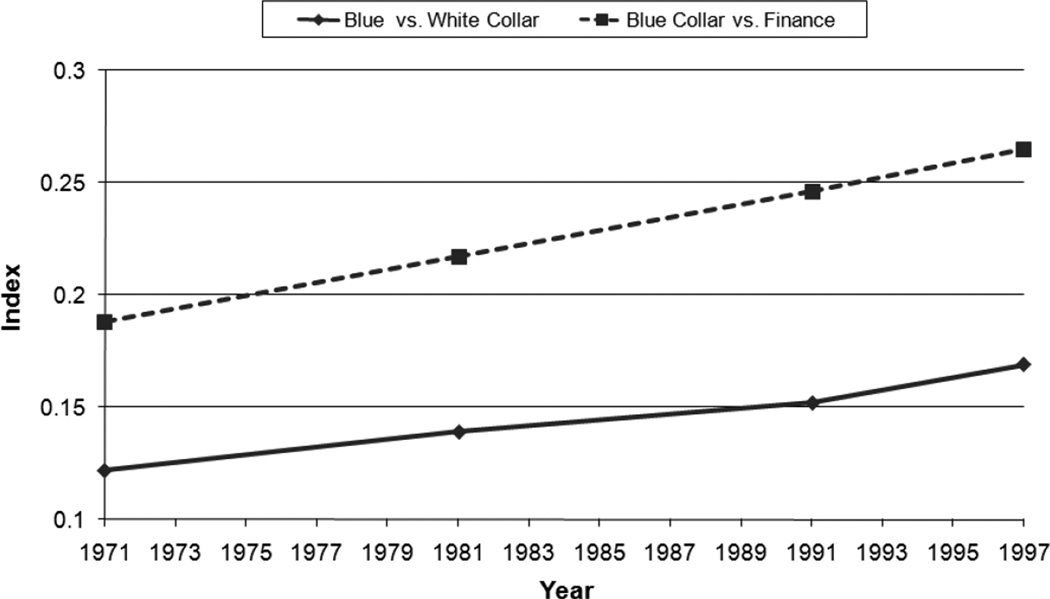
Figure 10 shows dissimilarity indices computed between blue- and whitecollar workers and between blue-collar workers and those in the financial sector across congressional districts from 1971 through 1997. The former is a very broad measure of class segregation, as the white- and blue- collar categories embrace a wide range of occupations, some of which differ in status only a little. The latter index is sharper in that it compares the distribution of one category of high-status workers with a large number of skilled and unskilled laborers in the blue-collar category. Not surprisingly, class segregation is higher when measured as financial workers versus blue-collar workers than as simply white- versus blue-collar workers, but in both series the trend in segregation is unambiguously upward. Over the period under consideration, the dissimilarity between white- and blue-collar workers across congressional districts rose from .12 to .17 and that between financial and blue-collar workers rose from .22 to .27, increases of 42 percent and 23 percent, respectively. While not large in absolute terms, as indicators of class, these broad occupational categorizations are crude tools, and the direction of the trend is clear, reinforcing conclusions from the prior section.
Figure 10.
Measures of class dissimilarity across congressional districts.
AMERICA’S NEW REGIME OF SEGREGATION
During the last third of the twentieth century, the United States moved toward a new regime of residential segregation. Whether measured in terms of dissimilarity or isolation, black segregation steadily declined after 1970, while the segregation of other groups—Latinos, Asians, and American Indians—did not rise and continued to vary from low to moderate despite mass immigration from Asia, Latin America, and the Caribbean. As racial-ethnic segregation moderated, however, socioeconomic segregation rose, as indicated by rising levels of dissimilarity between the poor and the affluent and between the college educated and high school graduates, yielding rising spatial isolation among people at the top and bottom of the socioeconomic distribution. This increase in class segregation was accompanied by a marked increase in ideological segregation during the first years of the new century.
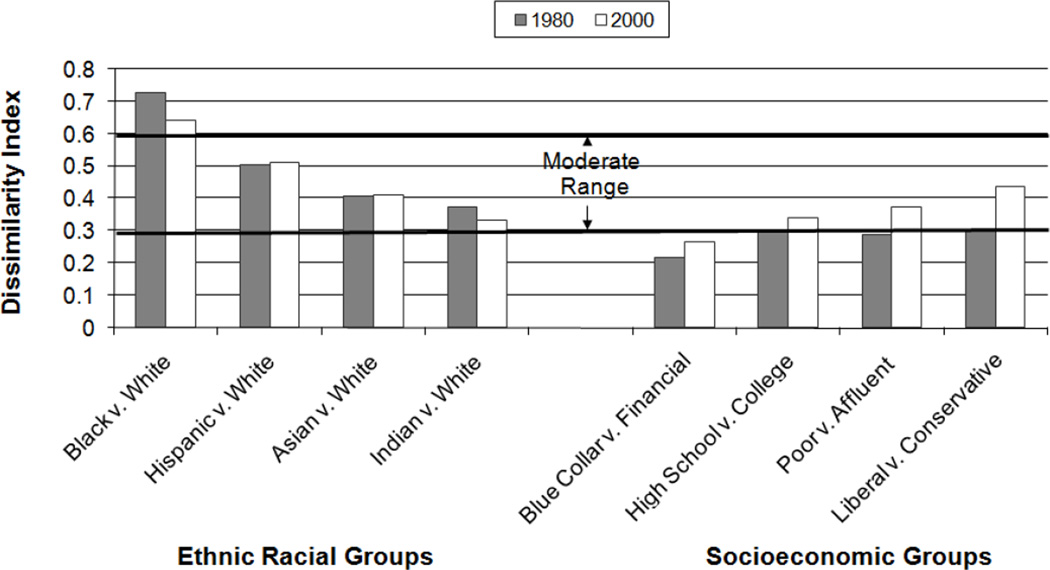
The new regime of American segregation is summarized in Figure 11, which shows shifts in racial-ethnic and socioeconomic dissimilarity from circa 1980 to circa 2000. Segregation for the racial-ethnic groups arrayed on the left-hand side of the figure either remained constant or fell over the period. In contrast, segregation for the socioeconomic groups arrayed on the right-hand side all increased. It is as if the values of the various indices of dissimilarity were all moving toward a common convergence in the range of .30 to .60, conventionally taken to indicate moderate levels of segregation (Kantrowitz 1979).
Figure 11.
Residential dissimilarity between selected groups circa 1980 and 2000.
In the new regime, it seems unlikely that racial-ethnic segregation will disappear or that socioeconomic segregation will reach the heights experienced by African Americans in the past. Rather, both will increasingly vary in the moderate range. This new configuration does not mean either will become unimportant. Indeed, it may simply mean that racial and socioeconomic segregation will become more important in combination than apart and that it will be the interaction of race-ethnicity and class that becomes the key nexus in defining urban The groups themselves may be defined on the spatial structure and determining the location of people within it, harking back to Gordon’s (1964) concept of “ethclass” as the central social category in understanding spatial relations.
In addition, as race-ethnicity and class interact in new and powerful ways to determine spatial outcomes, old patterns of prejudice, preference, and discrimination will likely become less important in structuring patterns of segregation in American urban areas. Despite some ups and downs, Americans are generally becoming more tolerant of racial-ethnic mixture within intimate settings, are less likely to prefer racially homogenous neighborhoods, and report less severe discrimination in housing and lending markets (Charles 2003). Despite the rise in class segregation, it is unlikely that this increase stems from a rise in prejudice or discrimination against poor people or that the residential preferences of rich and poor have suddenly changed. Instead, urban segregation will increasingly derive from institutionalized land use policies that are not themselves explicitly racist or class biased, though racial and class prejudice may indeed underlie them.
A good example is density zoning: regulations that restrict and regulate the density of residential construction. Research shows that density zoning varies widely across states and regions and across municipalities within the same metropolitan area and that these variations are strongly associated with variations in the supply and price of housing, as well as the distribution of affordable housing (Pendall 2000; Rothwell 2008). In general, restrictive zoning reduces access to affordable housing and is associated with higher levels of both racial and class segregation.
In a pair of recent analyses, Rothwell and Massey used two-stage least squares estimation to show that the link between density zoning and segregation is not merely associational but causal, whether one considers race (Rothwell and Massey forthcoming) or class (Rothwell and Massey 2009). According to their estimates, shifting average density zoning in suburbs from the most restrictive to the least restrictive levels observed in their data would lower racial segregation by the equivalent of 60 percent of the observed range in racial segregation and 25 percent of the observed range in class segregation. Although markets allocate people to housing based on income and price, political decisions allocate housing of different prices to different neighborhoods and thereby turn the market into a mechanism of both class and racial segregation. In an era when naked prejudice and overt discrimination are receding, exclusionary zoning has become a core institutional mechanism limiting opportunities for the poor and minorities to live in better neighborhoods and enjoy better access to public and private goods.
Footnotes
Data available online at http://trinity.aas.duke.edu/~jvigdor/segregation/.
REFERENCES
- Adler E Scott. Congressional district data file [Congressional term] Boulder: University of Colorado; 2008. [accessed December 30, 2008]. Data accessed from author's Web site: http://sobek.colorado.edu/~esadler/districtdatawebsite/CongressionalDistrictDatasetwebpage.htm. [Google Scholar]
- Charles Camille Z. The dynamics of racial residential segregation. Annual Review of Sociology. 2003;29:167–207. [Google Scholar]
- Cutler David, Glaeser Edward L, Vigdor Jacob. The rise and decline of the American ghetto. Journal of Political Economy. 1999;107:455–450. [Google Scholar]
- Danziger Sheldon, Gottschalk Peter. America unequal. New York: Russell Sage Foundation; 1995. [Google Scholar]
- Domina Thurston. Brain drain and brain gain: Rising educational segregation in the United States 1940–2000. City & Community. 2006;5:387–407. [Google Scholar]
- Gordon Milton M. Assimilation in American life: The role of race, religion and national origins. New York: Oxford University Press; 1964. [Google Scholar]
- Grossman James R. Land of hope: Chicago, Black southerners, and the great migration. Chicago: University of Chicago Press; 1989. [Google Scholar]
- Iceland John, Weinberg Daniel H, Steinmetz Erika. Racial and ethnic residential segregation in the United States 1980–2000. Washington, DC: U. S. Census Bureau; 2002. [Google Scholar]
- Iceland John, Wilkes Rima. Does socioeconomic status matter? Race, class, and residential segregation. Social Problems. 2006;53:248–273. [Google Scholar]
- Jackson Kenneth T. Crabgrass frontier: The suburbanization of the United States. New York: Oxford University Press; 1985. [Google Scholar]
- Jargowsky Paul A. Poverty and place: Ghettos, barrios, and the American city. New York: Russell Sage Foundation; 1997. [Google Scholar]
- Kantrowitz Nathan. Racial and ethnic segregation in Boston: 1830–1970. The Annals of the American Academy of Political and Social Science. 1979;441:41–54. [Google Scholar]
- Katznelson Ira. When affirmative action was white: An untold history of racial inequality in twentieth-century America. New York: Norton; 2005. [Google Scholar]
- Lemann Nicholas. The promised land: The great black migration and how it changed America. New York: Knopf; 1991. [Google Scholar]
- Levy Frank. The New Dollars and Dreams: American Incomes and Economic Change. New York: Russell Sage Foundation; 1998. [Google Scholar]
- Lieberson Stanley. Ethnic patterns in American cities. New York: Free Press; 1963. [Google Scholar]
- Lieberson Stanley. A piece of the pie: Blacks and white immigrants since 1880. Berkeley: University of California Press; 1980. [Google Scholar]
- Massey Douglas S. The new immigration and the meaning of ethnicity in the United States. Population and Development Review. 1995;21:631–652. [Google Scholar]
- Massey Douglas S. Categorically unequal: The American stratification system. New York: Russell Sage Foundation; 2007. [Google Scholar]
- Massey Douglas S, Denton Nancy A. The dimensions of residential segregation. Social Forces. 1988;67:281–315. [Google Scholar]
- Massey Douglas S, Denton Nancy A. American apartheid: Segregation and the making of the underclass. Cambridge, MA: Harvard University Press; 1993. [Google Scholar]
- Massey Douglas S, Fischer Mary J. The geography of inequality in the United States 1950–2000. In: Gale William G, Pack Janet Rothenberg., editors. Brookings-Wharton papers on urban affairs 2003. Washington, DC: Brookings Institution; 2003. pp. 1–40. [Google Scholar]
- Massey Douglas S, Hajnal Zoltan. The changing geographic structure of black-white segregation in the United States. Social Science Quarterly. 1995;76:527–542. [Google Scholar]
- McCarty Nolan, Poole Keith T, Rosenthal Howard. Polarized America: The dance of ideology and unequal riches. Cambridge, MA: MIT Press; 2006. [Google Scholar]
- Pendall Rolf. Local land-use regulation and the chain of exclusion. Journal of the American Planning Association. 2000;66:125–142. [Google Scholar]
- Reich Robert B. Secession of the successful. New York Times Magazine. 1991 Jan 20;:16. [Google Scholar]
- Rothwell Jonathan. Working Paper, Woodrow Wilson School of Public and International Affairs. Princeton, NJ: Princeton University; 2008. The effects of density regulation on metropolitan housing markets. [Google Scholar]
- Rothwell Jonathan, Massey Douglas S. Working Paper under review, Woodrow Wilson School of Public and International Affairs. Princeton University; Princeton, NJ: 2009. Density zoning and class segregation in U. S. metropolitan areas. [Google Scholar]
- Rothwell Jonathan, Massey Douglas S. The effect of density zoning on racial segregation in U. S. urban areas. Urban Affairs Review. doi: 10.1177/1078087409334163. Forthcoming. [DOI] [PMC free article] [PubMed] [Google Scholar]
- Taeuber Karl E, Taeuber Alma F. Negroes in cities: Residential segregation and neighborhood change. Chicago: Aldine; 1965. [Google Scholar]
- Watson Tara. Metropolitan growth and neighborhood segregation by income. [accessed December 30, 2008];Seminar Paper, Department of Economics, Williams College. 2005 http://www.williams.edu/Economics/seminars/watson_brook_1105.pdf.
- White Michael J. Segregation and diversity: Measures in population distribution. Population Index. 1986;52:198–221. [PubMed] [Google Scholar]


