

Abstract
An LCMSMS method was developed and fully validated for the simultaneous quantification of buprenorphine (BUP), norbuprenorphine (NBUP), buprenorphine-glucuronide (BUP-Gluc), and norbuprenorphine-glucuronide (NBUP-Gluc) in 0.5mL plasma, fulfilling confirmation criteria with 2 transitions for each compound with acceptable relative ion intensities. Transitions monitored were 468.3>396.2 and 468.3>414.3 for BUP, 414.3>340.1 and 414.3>326.0 for NBUP, 644.3>468.1 and 644.3>396.3 for BUP-Gluc, and 590.3>414.3 and 590.3>396.2 for NBUP-Gluc. Linearity was 0.1–50 ng/mL for BUP and BUP-Gluc, and 0.5–50 ng/mL for NBUP and NBUP-Gluc. Intra-day, inter-day, and total assay imprecision (%RSD) were <16.8%, and analytical recoveries were 88.6–108.7%. Extraction efficiencies ranged from 71.1–87.1%, and process efficiencies 48.7–127.7%. All compounds showed ion enhancement, except BUP-Gluc that demonstrated ion suppression: variation between 10 different blank plasma specimens was <9.1%. In 6 umbilical cord plasma specimens from opioid-dependent pregnant women receiving 14–24 mg/day BUP, NBUP-Gluc was the predominant metabolite (29.8±7.6 ng/mL), with BUP-Gluc (4.6±4.8 ng/mL), NBUP (1.5±0.8 ng/mL) and BUP (0.4±0.2 ng/mL). Although BUP biomarkers can be quantified in umbilical cord plasma in low ng/mL concentrations, the significance of these data as predictors of neonatal outcomes is currently unknown.
Keywords: Buprenorphine, Plasma, LCMSMS, Umbilical cord plasma
1. Introduction
Buprenorphine (BUP) is a semi-synthetic opioid derived from thebaine, prescribed at low doses (0.3–0.6 mg IV or IM) to treat moderate-to-severe pain, and at higher doses (4–24 mg) by the sublingual route as pharmacotherapy for opioid dependence [1]. BUP was recently approved for treatment of opioid-dependent pregnant women in some countries, and is under consideration for this indication in the US [2–5].
BUP is well absorbed in the gastrointestinal tract, but has low oral bioavailability due to high first-pass hepatic metabolism. BUP is rapidly N-dealkylated to norbuprenorphine (NBUP), mainly by CYP3A4 in the liver [6]. BUP and NBUP are further metabolized by phase II glucuronidation to buprenorphine-glucuronide (BUP-Gluc) and norbuprenorphine glucuronide (NBUP-Gluc) [7]. The simultaneous determination of BUP, NBUP, BUP-Gluc, and NBUP-Gluc in plasma is important for characterizing BUP pharmacokinetics, and to interpret clinical and forensic toxicology results.
Umbilical cord plasma is an interesting alternative matrix for identifying in utero drug exposure [8,9]. This specimen is available at the time of birth and reflects concurrent drug concentrations in the newborn. Furthermore, specimen collection is non-invasive, especially in comparison to infant plasma collection. Few data are available on drug concentrations in umbilical cord plasma [10–14], and no data on BUP in this matrix. In adult plasma, the predominant metabolite is NBUP-Gluc [1,15], but BUP and metabolites distribution in umbilical cord plasma are unknown.
Gas chromatography-mass spectrometry (GCMS) [16–18] methods are available for quantification of BUP and NBUP in plasma. LCMS offers several advantages compared to GCMS for analysis of these biomarkers. No derivatization is required and glucuronide metabolites can be quantified without the need for costly and time-consuming hydrolysis. LCMS and LCMSMS have been applied for BUP and metabolites’ analysis in a wide variety of matrices including, urine [1,19–28], hair [21,23,25,29–32], sweat [33], meconium [34], breast milk [35], placenta [36], and umbilical cord [37]. In plasma, several methods were published for BUP alone [18,38], BUP and NBUP [23,39–41]; BUP, NBUP, and glucuronides after hydrolysis [25,42]; BUP, NBUP and BUPG [43]; and all four analytes [1,15,44]. For compound identification by LCMSMS, FDA [45] and European guidelines [46] require chromatographic separation, a minimum of 2 transitions per analyte or 3 characteristic ions if LCMS (single MS) is employed, and acceptable relative ion intensities. Despite this recommendation, none of the published LCMS or LCMSMS methods fulfilled these requirements for glucuronides identification; either one ion in single ion monitoring mode (SIM) [44] or only one characteristic transition [1,15,43,44] was monitored. In the literature, several examples of false positive results have been reported utilizing a single transition [47,48], demonstrating the importance of following confirmation guidelines.
We developed and fully validated an LCMSMS method for the simultaneous determination of BUP, NBUP, BUP-Gluc, and NBUP-Gluc in umbilical cord plasma with 2 characteristic transitions for each analyte with acceptable relative ion intensities, fulfilling FDA and European guidelines requirements for confirmatory analysis. This method was applied to the analysis of umbilical cord plasma specimens from infants of pregnant women receiving observed daily BUP doses as pharmacotherapy for opioid dependence in a randomized, double-blind, controlled clinical study [49].
2. Materials and methods
2.1. Chemicals and materials
BUP, NBUP, BUP-Gluc, NBUP-Gluc, buprenorphine-d4 (BUP-d4), and norbuprenorphine-d3 (NBUP-d3) 100 µg/mL in methanol 1mL ampoules of standards and internal standards were obtained from Cerilliant (Austin, TX). BUP, NBUP, BUP-Gluc, and NBUP-Gluc quality control (QC) samples were prepared from a different lot from Cerilliant, when possible, or from a different vial, with preparation on different days than for calibrators. Reagent grade formic and perchloric acid were from Sigma Chemicals (St. Louis, MO) and Acros Organics (Morris Plains, NJ), respectively. All solvents were HPLC grade. Solid phase extraction (SPE) was performed with Strata-XC columns (60 mg/3 mL) (Phenomenex, Torrance, CA). Different pools of drug-free human plasma were obtained from the Department of Transfusion Medicine, National Institutes of Health (Bethesda, MD).
2.2. Apparatus
LCMSMS analysis was performed with a Shimadzu LC system (Kyoto, Japan) interfaced to a 3200 QTrap (Applied Biosystem / MDS Sciex, Foster City, CA) with an electrospray (ESI) ion source. The Shimadzu system consisted of a binary pump LC-20AD, degasser DGU-20A3, autosampler SIL-20AD, and a column oven CTO-20A. Data acquisition, peak integration and calculation were assigned to a computer work station running Analyst™ Software 1.4.1. A 5804R centrifuge from Eppendorf (Hamburg, Deutshland) was employed. Solvent evaporation was carried out on a TurboVap LV evaporator from Zymark (Hopkinton, MA).
2.3. Preparation of standard solutions
Solutions containing 10, 1, and 0.1 µg/mL of BUP, NBUP, BUP-Gluc, and NBUPGluc were prepared separately in methanol from 100 µg/mL stock calibrators. Different working solutions of the 4 analytes were prepared by appropriate dilution in methanol. The internal standard (IStd) solution, 0.4 µg/mL BUP-d4 and NBUP-d3, was prepared by dilution of 100 µg/mL stock solutions in methanol. QC solutions containing BUP, NBUP, BUP-Gluc, and NBUP-Gluc were prepared in methanol from different stock solutions than those used for calibrators at 3 different working concentrations across the linear range of the assay.
2.4. Calibrator, quality control, and specimen preparation
A nine-point calibration curve (0.1, 0.2, 0.5, 1, 2, 5, 10, 20, and 50 ng/mL) was prepared by adding 25 µL of working calibrator and 20 µL of IStd solution to 0.5 mL blank plasma. 0.1 and 0.2 ng/mL calibrators were not used for NBUP and NBUP-Gluc. Low, medium, and high QC samples were 0.3, 7.5 and 30 ng/mL for BUP and BUP-Gluc, and 1.5, 7.5 and 30 ng/mL for NBup and NBUP-Gluc. QCs were prepared by adding 25 µL of working QC solution and 20 µL of IStd solution to 0.5 mL blank plasma. For authentic specimens, 20 µL of IStd solution were added to 0.5 mL plasma. After adding 1 mL of 0.1% perchloric acid in water, samples were centrifuged at 5 974 ×g for 5 min and supernatants were subjected to SPE.
2.5. Extraction
SPE cartridges were preconditioned with 2 mL methanol and 2 mL 0.1% perchloric acid in water. Supernatants were applied followed by washing with 2 mL 2% formic acid in water and 2 mL methanol. Cartridges were dried for 15 min under vacuum before eluting with 3 mL methylenechloride:isopropanol: concentrated ammonium hydroxide (60:35:5, v/v/v). Eluates were dried completely under nitrogen at 45°C. Dried extracts were reconstituted with 50 µL mobile phase, 85% A (0.1% formic acid in water) and 15% B (0.1% formic acid in acetonitrile), and 20 µL were injected into the LCMSMS.
2.6. Liquid Chromatography
Chromatographic separation was achieved with a Synergi Polar-RP 80A (75 × 2 mm, 4 µm) column with a 4 × 2 mm, identically packed guard column (Phenomenex, Torrance, CA) and gradient elution with mobile phase A and B at a 300 µL/min flow rate. The initial mixture (85% A, 15% B) was maintained for 0.5 min, B was increased from 15% to 65% over 5.5 min, returned to initial conditions over 1 min, followed by a 3 min equilibration for a total run time of 10 min.
2.7. Mass Spectrometry
Mass spectrometric data were acquired in positive ion mode with the following ESI-MS parameters: IonSpray voltage: 5 500 V; Temperature: 600°C; Curtain gas: 10; ion source gas 1: 50; and ion source gas 2: 55. The curtain and ion source gases were nitrogen. Data were recorded in single reaction monitoring (SRM) mode. MSMS optimization was established by infusing 100 ng/mL of each analyte in methanol directly. The precursor ions, product ions, and LCMSMS parameters are displayed in Table 1.
Table 1.
LCMSMS parameters, retention times and internal standards (IStd) for buprenorphine (BUP), norbuprenorphine (NBUP), buprenorphine-glucuronide (BUP-Gluc), and norbuprenorphine-glucuronide (NBUP-Gluc).
| Analyte | MRM Transitiona |
DPb (V) |
EPc (V) |
CEPd (V) |
CEe (eV) |
CXPf (V) |
RTg (min) |
IStd |
|---|---|---|---|---|---|---|---|---|
| NBUP-Gluc | 590.3>414.3 | 96 | 9.5 | 34 | 51 | 4 | 3.3 | NBUP-d3 |
| 590.3>396.2 | 96 | 9.5 | 27 | 50 | 3 | |||
| BUP-Gluc | 644.3>468.1 | 101 | 9.5 | 30 | 45 | 4 | 4 | BUP-d4 |
| 644.3>396.3 | 101 | 9.5 | 30 | 71 | 4 | |||
| NBUP | 414.3>340.1 | 86 | 12 | 26 | 43 | 4 | 4.2 | NBUP-d3 |
| 414.3>326 | 86 | 12 | 26 | 40 | 5 | |||
| NBUP-d3 | 417.3>343.4 | 86 | 12 | 16 | 39 | 4 | 4.2 | |
| 417.3>326 | 86 | 12 | 22 | 43 | 4 | |||
| BUP | 468.3>396.2 | 86 | 12 | 18 | 53 | 6 | 5 | BUP-d4 |
| 468.3>414.3 | 86 | 12 | 18 | 45 | 12 | |||
| BUP-d4 | 472.5>400.1 | 86 | 11 | 24 | 61 | 6 | 5 | |
| 472.5>415.3 | 86 | 11 | 24 | 45 | 8 | |||
The quantification transition is underlined
declustering potential
entrance potential
collision cell entrance potential
collision energy
collision cell exit potential
retention time.
2.8. Validation
Validation parameters included linearity, limits of detection (LOD) and quantification (LOQ), imprecision, analytical recovery, extraction efficiency, process efficiency, matrix effect, selectivity, carryover, dilution integrity, and stability studies. Linearity was determined by least-squares regression with 1/x weighting. Acceptable linearity was achieved when the coefficient of determination was at least 0.99 and calibrators quantified within ±20% at the LOQ and ±15% at other concentrations. LOD and LOQ were evaluated with decreasing analyte concentrations in drug-fortified plasma. LOD was defined as the lowest concentration with acceptable chromatography, presence of all qualifier ions with signal-to-noise ratios of at least 3, and a retention time (RT) within ± 0.2 min of the average calibrator RT. LOQ was the lowest concentration that met LOD criteria and a signal-to-noise ratio of at least 10, imprecision lower than 20%, and analytical recovery between 80–120%.
Imprecision and analytical recovery were determined at 3 concentrations by analyzing 5 replicates on 4 different days (n=20). Imprecision, expressed as % relative standard deviation (%RSD) of the measured values, was expected to be less than 15%. The guidelines given by Krouwer and Rabinowitz [50] were followed for the calculation of pooled intra-day, inter-day, and total imprecision. According to the authors [50], within-run imprecision is subtracted from the standard deviation of the mean run averages to obtain a pure between-run component of imprecision. The estimates of imprecision standard deviation with-in day (SW), between-day (SB), and total (ST), were:
In the SB equation, n is the number of replicates and it can happen that mean square between day is less than mean square within day, which means that the quantity under the square-root sign can be negative. In this case, one sets SB = 0, and then the inter-day imprecision is 0. Analytical recovery was evaluated as the percent of target concentration (n=20) with required criteria of 85–115%.
Extraction efficiency for each analyte was measured at each QC concentration. Blank plasma was fortified with QC and IStd solution before and after SPE. Percent extraction efficiency from plasma was expressed as mean analyte area of samples (n=5) fortified with control solution before extraction divided by mean area of samples (n=5) with control solution added after SPE. Matrix effect was assessed by comparing analyte peak areas in 10 different blank extracted plasma specimens fortified with QC and IStd solutions after SPE to peak areas of samples at the same nominal concentrations prepared in an 85:15 mixture of mobile phase A and mobile phase B (neat). Matrix suppression or enhancement was calculated as follows: (100 × mean peak area of fortified plasma after SPE / mean peak area of neat) −100. Process efficiency examined the overall effect of SPE extraction efficiency and matrix effect on the quantification of analytes of interest. It was determined by comparing mean analyte peak areas of 5 samples fortified before SPE with mean peak areas of 5 neat samples prepared in mobile phase at the same concentration.
Interferences from endogenous matrix components were evaluated by analyzing plasma samples from 10 healthy non-drug-consuming subjects only fortified with IStd solution. Endogenous interferences were considered insignificant if analytes were not detected in these 10 plasma samples. Method specificity was demonstrated by adding high concentrations (500 ng/mL) of potentially interfering licit and illicit drugs to low QC samples. The following drugs and metabolites were examined: cocaine, benzoylecgonine, norcocaine, norbenzoylecgonine, ecgonine ethyl ester, ecgonine methyl ester, anhydroecgonine methyl ester, ecgonine, amphetamine, methamphetamine, p-hydroxyamphetamine, p-hydroxymethamphetamine, norephedrine, hydroxynorephedrine, 3,4-methylenedioxymethamphetamine (MDMA), 3,4-methylenedioxyamphetamine (MDA), 3,4-methylenedioxyethylamphetamine (MDEA), 3-hydroxy-4-methoxyamphetamine (HMA), 3-hydroxy-4-methoxymethamphetamine (HMMA), methadone, 2-ethyl-5-methyl-3,3-diphenylpyrroline (EMDP), 2-ethylidene-1,5-dimethyl-3,3-diphenylpyrrolidine (EDDP), methadol, Δ9-tetrahydrocannabinol (THC), 11-hydroxy-THC, 11-nor-9-carboxy-THC, morphine, normorphine, morphine 3-β-glucuronide, morphine 6-β-glucuronide, codeine, norcodeine, 6-acetylmorphine, 6-acetylcodeine, diazepam, lorazepam, oxazepam, alprazolam, imipramine, clomipramine, fluoxetine, norfluoxetine, clonidine, ibuprofen, pentazocine, caffeine, diphenhydramine, chlorpheniramine, brompheniramine, acetylsalicylic acid, acetaminophen, and phencyclidine. Sufficient specificity was achieved if BUP, NBUP, BUP-Gluc, and NBUP-Gluc quantified within ±15% of low QC concentrations.
Lack of carryover was demonstrated by injecting IStd-fortified blank plasma immediately after a sample spiked with all analytes at 100 ng/mL, 2 times the upper LOQ. Carryover was considered negligible if the measured concentration was below the LOD. Dilution integrity was evaluated by diluting plasma samples (n=2) containing 100 ng/mL of each analyte with blank plasma to achieve a 1:4 dilution. IStd was added to diluted samples that were extracted as described. Dilution integrity was maintained if samples quantified within ±15% of 25 ng/mL.
Analyte stability was evaluated for drug-fortified plasma stored at room temperature (22°C) for 16 h, in the refrigerator (4°C) for 72 h, and after 3 freeze-thaw cycles (frozen 24h, thawed kept at room temperature for 3h). Plasma samples were fortified with all 4 analytes at 3 concentrations (low, medium and high QC) in triplicate. Stability was considered acceptable if QC samples quantified within ±15% of target.
2.9. Identification criteria
Identification criteria included RT within ± 0.2 min of average calibrator RT, presence of 2 transitions, and relative ion intensities (% of base peak) within ±20%, if relative ion intensity was >50%; ±25% if 20–50%; ±30% if 10–20%; and ±50% if ≤10% [46]. Relative ion intensities were calculated based on ion ratios (most abundant transition divided by less abundant) 468.3>396.2/468.3>414.3 for BUP, 414.3>340.1/414.3>326 for NBUP, 644.3>468.1/644.3>396.3 for BUP-Gluc, and 590>414.3/590.3>396.2 for NBUP-Gluc. These values were compared to mean relative ion intensity of all calibrators.
2.10. Method application
The method was applied to the analysis of umbilical cord plasma and maternal plasma specimens collected at delivery from 5 opioid-dependent pregnant women receiving controlled buprenorphine treatment; one set of twins, participant A, and 3 single births, participants B, C, D, and E. Six umbilical cord plasma (Participant A twins, B, C, D, and E), and 2 maternal plasma at delivery (Participants B and E) were collected for research purposes. BUP doses ranged from 14 to 24 mg/day. Specimens were collected as part of a protocol providing BUP pharmacotherapy to opioid-dependent pregnant women approved by the Johns Hopkins Bayview and National Institute on Drug Abuse’s Institutional Review Boards. Subjects provided written informed consent to participate.
3. Results
3.1. Analytical method
Linearity of analyte-to-IStd peak area ratio versus theoretical concentration was verified in plasma with 1/x-weighted linear regression. Curvature tested on a set of 4 calibration curves yielded determination coefficients (r2) above 0.99 (BUP intercept = 0.0042±0.0011, slope = 0.7970±0.0061, r2 = 0.9952±0.0033; NBUP intercept = 0.0246±0.0103, slope = 0.0446±0.0021, r2 = 0.9949±0.0010; BUP-Gluc intercept = 0.0066±0.0131, slope = 0.2525±0.0606, r2 = 0.9970±0.0021; and NBUP-Gluc intercept = 0.0597±0.0252, slope = 0.3425±0.1157, r2 = 0.9956±0.0022), with residuals within ±20% at the LOQ and ±15% at other calibrator concentrations. The linear calibration range included 9 concentrations from 0.1–50 ng/mL for BUP and BUP-Gluc, and 7 concentrations from 0.5–50ng/mL for NBUP and NBUP-Gluc. LODs were 0.075 ng/mL for BUP and BUP-Gluc, 0.4 ng/mL for NBUP, and 0.2 ng/mL for NBUP-Gluc.
Imprecision and analytical recovery results were satisfactory for all tested concentrations (Table 2). Extraction efficiencies for all analytes ranged from 71.1 to 87.1%, and process efficiencies from 48.7 to 127.7%. Matrix effect ranged from 10.2 to 58.4% with variation between 10 different plasma <9.1%. Matrix effect included ion enhancement for all compounds except BUP-Gluc that demonstrated ion suppression. Data are shown in Table 3.
Table 2.
Imprecision and analytical recovery for buprenorphine (BUP), and metabolites norbuprenorphine (NBUP), buprenorphine-glucuronide (BUP-Gluc), and norbuprenorphine-glucuronide (NBUP-Gluc) in plasma by LCMSMS.
| Analyte | Concentration (ng/mL) |
Total mean (n=20, ng/mL) |
Imprecision (n=20a, %RSD) | Analytical recovery (n=20a, % of target) |
||
|---|---|---|---|---|---|---|
| Pooled intra- day |
Inter- day |
Total | ||||
| BUP | 0.3 | 0.3 | 10.7 | 0 | 10.7 | 98.7 |
| 7.5 | 8.2 | 5.4 | 0 | 5.4 | 108.7 | |
| 30 | 31.6 | 6 | 0 | 5.9 | 105.2 | |
| NBUP | 1.5 | 1.5 | 11 | 6.8 | 13 | 101.3 |
| 7.5 | 7.6 | 8.5 | 0 | 8.5 | 100.7 | |
| 30 | 30.3 | 6.8 | 0 | 6.8 | 100.9 | |
| BUP- Gluc |
0.3 | 0.3 | 0 | 16.8 | 16.8 | 88.6 |
| 7.5 | 7.3 | 7.8 | 4.9 | 9.2 | 97.4 | |
| 30 | 30 | 7.2 | 4.8 | 8.6 | 100 | |
| NBUP- Gluc |
1.5 | 1.4 | 8.1 | 7.6 | 11.1 | 93.9 |
| 7.5 | 8 | 8 | 0 | 7.8 | 106 | |
| 30 | 32.5 | 6.7 | 0 | 6.7 | 108.3 | |
5 replicates on four different days for a total of 20.
Table 3.
Extraction efficiency, process efficiency and matrix effect for buprenorphine (BUP), and metabolites norbuprenorphine (NBUP) buprenorphine-glucuronide (BUP-Gluc), and norbuprenorphine-glucuronide (NBUP-Gluc) in plasma by LCMSMS.
| Analyte | Concentration (ng/mL) |
Extraction Efficiency (%, n=5) |
Process Efficiency (%, n=5) |
Matrix Effect (n=10) | |
|---|---|---|---|---|---|
| Effect (%) |
% RSD | ||||
| BUP | 0.3 | 87.1 | 96.3 | 10.2 | 7.1 |
| 7.5 | 83.8 | 127.7 | 54.9 | 6.4 | |
| 30 | 77.9 | 110.5 | 44.6 | 3.9 | |
| NBUP | 1.5 | 75.9 | 93.3 | 20.8 | 8.4 |
| 7.5 | 82.7 | 105.9 | 31.3 | 7.3 | |
| 30 | 77.9 | 93.6 | 22.1 | 4.6 | |
| BUP- Gluc |
0.3 | 79.9 | 53.2 | −32.9 | 9.1 |
| 7.5 | 81.5 | 51.7 | −35.6 | 6 | |
| 30 | 73.1 | 48.7 | −32.6 | 4 | |
| NBUP- Gluc |
1.5 | 75.2 | 118.8 | 57.1 | 5.9 |
| 7.5 | 76 | 117.7 | 58.4 | 6.9 | |
| 30 | 71.1 | 104.6 | 50.4 | 4.1 | |
Under described conditions, no interference with any extractable endogenous compound in plasma was observed (Fig. 1). Method selectivity was demonstrated by adding high concentrations (500 ng/mL) of 52 potentially interfering licit and illicit drugs, and metabolites to low QC samples. All test samples quantified within ±15% of target, indicating no interference with the 4 analytes of interest. No analyte was detected in a blank sample injected immediately following analysis of a 100 ng/mL sample, indicating no carryover at this concentration. The ability of the method to accurately quantify specimens containing high concentrations of analytes was evaluated by diluting 100 ng/mL samples (n=2) with blank plasma; 375 µL of blank plasma was added to 125 µL of fortified sample to achieve a 1:4 dilution. Samples quantified within 14% of 25 ng/mL, confirming dilution integrity. Analytes were stable when stored at room temperature (22°C) for 16 h, refrigerated at 4°C for 72 h, and after three freez-ethaw cycles. These results are shown in Table 4.
Fig. 1.

LCMSMS chromatogram of blank plasma with retention times of analytes of interest noted. Panel (a) shows the quantification transitions and panel (b) qualifier transitions.
Table 4.
The stability of buprenorphine (BUP) and metabolites norbuprenorphine (NBUP), buprenorphine-glucuronide (BUP-Gluc), and norbuprenorphine-glucuronide (NBUP-Gluc) in plasma (n=3) under different storage conditions. Room temperature (RT) for 16 h; 4°C for 72 h; 3 freeze/thaw cycles (F/T); Percentage difference from fresh controls (Diff %).
| Compound | Fresh (n=3) | RT (n=3) | 4°C (n=3) | F/T (n=3) | ||||
|---|---|---|---|---|---|---|---|---|
| Mean (ng/mL) |
Mean (ng/mL) |
Diff % | Mean (ng/mL) |
Diff % | Mean (ng/mL) |
Diff % | ||
| BUP | 0.26 | 0.31 | 16.3 | 0.27 | 3.0 | 0.28 | 5.3 | |
| 8.4 | 8.3 | −1.1 | 8.6 | 2.5 | 8.9 | 5.8 | ||
| 33.6 | 31.9 | −5.3 | 34.3 | 2.0 | 32.9 | −2.1 | ||
| NBUP | 1.4 | 1.6 | 16.8 | 1.3 | −6.0 | 1.4 | 3.8 | |
| 7.8 | 7.7 | −1.0 | 7.9 | 1.4 | 8.2 | 4.6 | ||
| 31.6 | 30.4 | −3.7 | 32 | 1.4 | 31.4 | −0.4 | ||
| BUP-Gluc | 0.25 | 0.27 | 7.9 | 0.24 | −4.5 | 0.24 | −4.7 | |
| 8 | 7.9 | −0.8 | 7.2 | −9.7 | 8.5 | 6.5 | ||
| 30.5 | 32.7 | 7.3 | 34.1 | 12 | 31.8 | 4.3 | ||
| NBUP-Gluc | 1.3 | 1.3 | 1 | 1.3 | −0.8 | 1.3 | −4 | |
| 8.1 | 7.2 | −11.4 | 8.5 | 5.1 | 7.8 | −3.6 | ||
| 34.8 | 29.8 | −14.6 | 31.6 | −9.3 | 32.4 | −6.9 | ||
3.2. Specimen analysis
This plasma method was applied to the analysis of umbilical cord plasma specimens from pregnant women receiving 14 to 24 mg SL BUP prior to delivery. The predominant compound identified was NBUP-Gluc (29.8±7.6 ng/mL), followed by BUP-Gluc (4.6±4.8 ng/mL), NBUP (1.5±0.8 ng/mL), and BUP (0.4±0.2 ng/mL). Table 5 shows results and Fig. 2 represents the extracted transitions chromatogram of one authentic specimen. Fig. 3 describes BUP and metabolite relative concentrations in each specimen, including also the times between last maternal BUP dose and specimen collection. Two maternal plasma specimens collected at delivery from participants B and E also were analyzed. Participant B’s plasma concentrations were NBUP-Gluc 23.1 ng/mL, BUP-Gluc 6.5 ng/mL, NBUP 1.9 ng/mL, and BUP 0.6 ng/mL, and participant’s E NBUP-Gluc 42 ng/mL, BUP-Gluc 18.2 ng/mL, NBUP 2.9 ng/mL, and BUP 0.2 ng/mL.
Table 5.
Buprenorphine (BUP), norbuprenorphine (NBUP), buprenorphine-glucuronide (BUP-Gluc), and norbuprenorphine-glucuronide (NBUP-Gluc) concentrations in umbilical cord plasma from buprenorphine maintained pregnant women.
| Umbilical cord plasma |
Dose at delivery (mg) |
Time between last dose and delivery (h) |
BUP (ng/mL) |
NBUP (ng/mL) |
BUP-Gluc (ng/mL) |
NBUP-Gluc (ng/mL) |
|---|---|---|---|---|---|---|
| A_Baby 1 | 18 | 4.3 | 0.7 | 0.8 | 4.4 | 22.8 |
| A_Baby 2 | 18 | 4.3 | 0.6 | 0.9 | 3.8 | 22.0 |
| B | 24 | 24 | NDa | 1.1 | 1.6 | 34.4 |
| C | 18 | 3.3 | 0.3 | 1.3 | 13.9 | 35.8 |
| D | 18 | 10.5 | 0.3 | 2.8 | 2.2 | 39.4 |
| E | 14 | 16.5 | 0.1 | 1.9 | 2.0 | 24.2 |
Not detected
Fig. 2.

LCMSMS chromatogram of authentic umbilical cord plasma containing buprenorphine (BUP, 0.7 ng/mL), norbuprenorphine (NBUP, 0.8 ng/mL), buprenorphine-glucuronide (BUP-Gluc, 4.4 ng/mL), and norbuprenorphine glucuronide (NBUP-Gluc, 22. 8 ng/mL). Panel (a) shows the quantification transitions and panel (b) qualifier transitions.
Fig. 3.
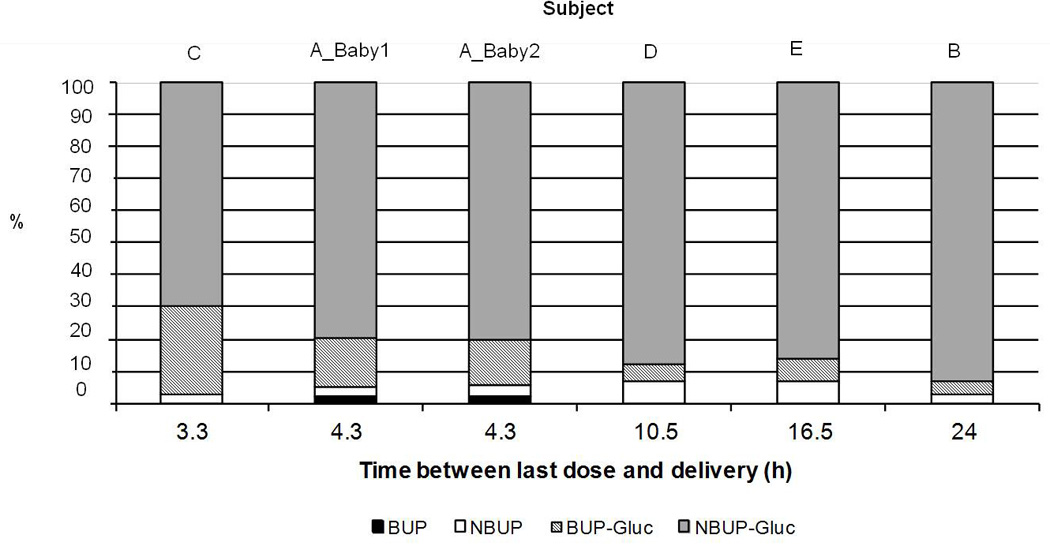
Graphic representation of relative % concentrations of buprenorphine (BUP), norbuprenorphine (NBUP), buprenorphine-glucuronide (BUP-Gluc), and norbuprenorphine-glucuronide (NBUP-Gluc) in 6 different umbilical cord plasma specimens collected at different times after last BUP dose.
4. Discussion
4.1. Analytical method
A sensitive quantitative method for the simultaneous determination of BUP and 3 metabolites in plasma was developed and fully validated. Therapeutic BUP plasma levels decrease to 0.3–1.9 ng/mL concentrations within 24 h of a 24 mg dose [18], documenting the need for a highly sensitive method. This assay satisfied sensitivity requirements with limits of quantification of 0.1 ng/mL for BUP and BUP-Gluc, and 0.5 ng/mL for NBUP and NBUP-Gluc. Other published methods achieved similar or better LOQ for BUP and NBUP [1,18,23,39,41,43,51,52]; however, none fulfilled compound identification criteria [45,46] due to monitoring of only a single ion [23,41,42], the surviving transition ion [18,39,43], or only one characteristic transition [1,52]. Favretto et al. [25] achieved 0.1 ng/mL LOQ for BUP and NBUP with an ion trap mass spectrometer performing quantification in SRM mode. Murphy and Huestis [15] and Al-Asmari et al. [44] also employed ion trap mass spectrometry, and were able to monitor 2 transitions for BUP and NBUP, but LOQ were higher than the present method (0.6 ng/mL and 5 ng/mL, respectively), with a required sample volume of 1 mL of plasma compared to 0.5 mL utilized in this method.
Only published methods with ion trap mass spectrometry were able to monitor 2 characteristic transitions for BUP and NBUP [15,25,44]. With triple quadrupole mass spectrometry, the surviving ion transition [18,39,43,53] or only one characteristic transition [52] was monitored, because at low collision energies there was little fragmentation and at high collision energy many low intensity products were obtained. Musshoff et al. [38] monitored 2 transitions for BUP with a triple quadrupole mass spectrometer, but selected product ions were not characteristic (468.5>55, 468.5>83.4).
Glucuronides also have been quantified for BUP and NBUP [1,15,43,44]. Murphy and Huestis [15], and Al-Ashmari et al. [44] monitored one transition for glucuronides, the cleavage of the glucuronic acid moiety, or just one ion for BUP-Gluc [44], with a higher LOQ (0.6 ng/mL and 5 ng/mL, respectively) than the present method. Polettini and Huestis [43] achieved a LOQ of 0.1 ng/mL for BUP-Gluc, and Huang et al. [44] for NBUP-Gluc, but in both cases only one transition was monitored.
Chromatographic separation of the 4 compounds was achieved in a reverse-phase column in gradient mode with a total run time of 10 min, whereas in previously published methods for the simultaneous quantification of these analytes a run time of 20 [1] or 30 min [15] was required. Al-Asmari et al. [44] developed a method with a run time of 35 min, but analysis of 19 opioids and metabolites were included.
A linear range of 0.1–50 ng/mL for BUP and BUP-Gluc and 0.5–50 ng/mL for NBUP and NBUP-Gluc allowed analysis of most clinical and forensic specimens without dilution. With an upper LOQ of 10 ng/mL [18,25,39–41,52], dilution was unavoidable in many cases. Two methods [15,25] evaluated dilution integrity, but dilution was done with water instead of blank plasma [15] or blood [25]. It is highly recommended to dilute with blank matrix because important parameters such as matrix effect can be modified if the matrix is diluted with water, potentially affecting quantification.
Ion enhancement was detected for all compounds except BUP-Gluc that demonstrated ion suppression. BUP and NBUP deuterated analogs were included as IStd to compensate for these effects. Unfortunately, glucuronide deuterated analogs were not commercially available. Matrix effect was not concentration-dependent, except for BUP that showed no matrix effect at the low QC, but enhancement at medium and high QC concentrations. Variance in matrix effect in plasma specimens from 10 different sources was < 9.1% at low, medium, and high QC concentrations, and all validation parameters satisfied criteria. IStd matrix effect also was tested to check variability among 10 different plasma specimens [54]. IStds showed ion enhancement (BUP-d4 62.8%; NBUP-d3 35.0%) with low variation among the 10 alternative matrices (BUP-d4 CV 2.8%; NBUP-d3 CV 3.1%).
Short- and long- term stability of BUP and NBUP [39,41,52], and their glucuronides [1,15,43,44] were previously reported. No degradation was observed for BUP and NBUP 24h at room temperature [39,52], up to 238 days at −20°C [52], and after 3 freeze/thaw cycles [39,41,52]; however, Murphy and Huestis [15] reported NBUP concentration reduction >40% after 3 freeze/thaw cycles. BUP-Gluc was stable up to 6 months at −20°C [43], and NBUP-Gluc up to 1 month at this temperature [44], with both stable for 24h at room temperature [1,15,55]. After 3 freeze/thaw cycles, Huang et al.[1] and Al-Asmari et al. [44] reported no degradation observed for glucuronides, whereas Murphy and Huestis [15] reported 30% degradation. In this study, no significant degradation of BUP and metabolites was detected under different storage conditions (storage at room temperature for 16 h, refrigerated at 4°C for 72 h, and after 3 freeze-thaw cycles).
4.2. Specimen analysis
BUP and metabolites were detected in all umbilical cord plasma specimens, except for BUP in umbilical cord plasma B (24h between dosing and delivery). Glucuronides were quantified at higher concentrations (NBUP-Gluc from 22 to 39.4 ng/mL, BUP-Gluc from 2 to13.9 ng/mL) than NBUP (0.8–2.8 ng/mL) and BUP (0–0.7 ng/mL). Differences in BUP and metabolites’ concentrations between specimens could be related to inter-individual variability, different BUP doses (14–24 mg/day), and different times between last dose and specimen collection. Based on these factors, it appears that BUP-Gluc concentrations decrease as time between last dose and delivery increases, whereas the relative percentage of NBUP-Gluc increases (Fig. 3). This suggests that NBUP-Gluc should be monitored if the longest window of drug detection is needed. NBUP-Gluc also was identified as the predominant BUP analyte in adult plasma following BUP administration [1], and in the 2 maternal plasma specimens collected at delivery from participants B and E. BUP and metabolites showed the same distribution as in umbilical cord plasma. Future comparisons of BUP biomarker concentrations in umbilical cord plasma with those in other newborn matrices (placenta, umbilical cord, meconium) collected at birth will help us to understand drug distribution to and metabolism by the fetus.
One set of monozygotic twins was included in the analysis (one placenta but 2 umbilical cords); both umbilical cord plasma specimens had similar BUP and metabolite concentrations. In the literature, significant differences in fetal cocaine and cannabinoid exposure between dizygotic twins were reported, whereas cocaine levels were similar in monozygotic twins [56].
5. Conclusion
A method for the simultaneous determination of BUP, NBUP, BUP-Gluc and NBUP-Gluc in plasma by LCMSMS was developed and fully validated, achieving good sensitivity and fulfilling confirmation FDA and European Union Commission criteria with 2 transitions monitored for each analyte and acceptable relative ion intensities. The method was applied to determining the disposition of BUP and metabolites in umbilical cord plasma specimens from BUP-maintained pregnant women.
Acknowledgement
This research was supported by the National Institutes of Health, Intramural Research Program, National Institute on Drug Abuse.
Footnotes
Publisher's Disclaimer: This is a PDF file of an unedited manuscript that has been accepted for publication. As a service to our customers we are providing this early version of the manuscript. The manuscript will undergo copyediting, typesetting, and review of the resulting proof before it is published in its final citable form. Please note that during the production process errors may be discovered which could affect the content, and all legal disclaimers that apply to the journal pertain.
References
- 1.Huang W, Moody DE, McCance-Katz EF. Ther. Drug Monit. 2006;28:245. doi: 10.1097/01.ftd.0000197094.92559.b4. [DOI] [PubMed] [Google Scholar]
- 2.Lejeune C, Simmat-Durand L, Gourarier L, Aubisson S. Drug Alcohol Depend. 2006;82:250. doi: 10.1016/j.drugalcdep.2005.10.001. [DOI] [PubMed] [Google Scholar]
- 3.Fischer G. Addiction. 2000;95:1141. doi: 10.1046/j.1360-0443.2000.95811411.x. [DOI] [PubMed] [Google Scholar]
- 4.Dunlop A, Panjari M, O’Sullivan H, Henschke P, Love V, Ritter A, Lintzeris N. Clinical guidelines for the use of buprenorphine in pregnancy, Turning Point Alcohol and Drug Centre, Fitzroy. 2003 [Google Scholar]
- 5.Jones HE, Martin PR, Heil SH, Kaltenbach K, Selby P, Coyle MG, Stine SM, O’Grady KE, Arria AM, Fischer G. J. Subst. Abuse Treat. 2008;35:245. doi: 10.1016/j.jsat.2007.10.007. [DOI] [PMC free article] [PubMed] [Google Scholar]
- 6.Kobayashi K, Tamamoto T, Chiba K, Tani M, Shimada N, Ishizaki T, Kuroiwa Y. Drug Metab. Dispos. 1998;26:818. [PubMed] [Google Scholar]
- 7.Cone EJ, Gorodetzky CW, Yousefnejad D, Buchwald WF, Johnson RE. Drug Metab. Dispos. 1984;12:577. [PubMed] [Google Scholar]
- 8.Lozano J, Garcia-Algar O, Vall O, de la Torre R, Scaravelli G, Pichini S. Ther. Drug Monit. 2007;29:711. doi: 10.1097/FTD.0b013e31815c14ce. [DOI] [PubMed] [Google Scholar]
- 9.Gray T, Huestis M. Anal. Bioanal. Chem. 2007;388:1455. doi: 10.1007/s00216-007-1228-9. [DOI] [PMC free article] [PubMed] [Google Scholar]
- 10.Dempsey DA, Partridge JC, Jones RT, Rowbotham MC. J. Anal. Toxicol. 1998;22:220. doi: 10.1093/jat/22.3.220. [DOI] [PubMed] [Google Scholar]
- 11.Papini O, da Cunha SP, da Silva Mathes Ado C, Bertucci C, Moises EC, de Barros Duarte L, de Carvalho Cavalli R, Lanchote VL. J. Pharm. Biomed. Anal. 2006;40:397. doi: 10.1016/j.jpba.2005.07.021. [DOI] [PubMed] [Google Scholar]
- 12.Nikolaou PD, Papoutsis II, Atta-Politou J, Athanaselis SA, Spiliopoulou CA, Calokerinos AC, Maravelias CP. J. Chromatogr. B. 2008;867:219. doi: 10.1016/j.jchromb.2008.04.006. [DOI] [PubMed] [Google Scholar]
- 13.Bardy AH, Lillsunde P, Hiilesmaa VK, Seppälä T. Clin. Pharmacol. Ther. 1994;55:471. doi: 10.1038/clpt.1994.57. [DOI] [PubMed] [Google Scholar]
- 14.Newport DJ, Calamaras MR, DeVane CL, Donovan J, Beach AJ, Winn S, Knight BT, Gibson BB, Viguera AC, Owens MJ, Nemeroff CB, Stowe ZN. Am. J. Psychiatry. 2007;164:1214. doi: 10.1176/appi.ajp.2007.06111886. [DOI] [PubMed] [Google Scholar]
- 15.Murphy CM, Huestis MA. J. Mass Spectrom. 2005;40:70. doi: 10.1002/jms.776. [DOI] [PubMed] [Google Scholar]
- 16.Everhart ET, Cheung P, Shwonek P, Zabel K, Tisdale EC, Jacob PI, Mendelson J, Jones RT. Clin. Chem. 1997;43:2292. [PubMed] [Google Scholar]
- 17.Kuhlman JJ, Magluilo J, Cone E, Levine B. J. Anal. Toxicol. 1996;20:229. doi: 10.1093/jat/20.4.229. [DOI] [PubMed] [Google Scholar]
- 18.Moody DE, Laycock JD, Spanbauer AC, Crouch DJ, Foltz RL, Josephs JL, Amass L, Bickel WK. J. Anal. Toxicol. 1997;21:406. doi: 10.1093/jat/21.6.406. [DOI] [PubMed] [Google Scholar]
- 19.Hegstad S, Khiabani HZ, Oiestad EL, Berg T, Christophersen AS. J. Anal. Toxicol. 2007;31:214. doi: 10.1093/jat/31.4.214. [DOI] [PubMed] [Google Scholar]
- 20.Kronstrand R, Selden TG, Josefsson M. J. Anal. Toxicol. 2003;27:464. doi: 10.1093/jat/27.7.464. [DOI] [PubMed] [Google Scholar]
- 21.Cirimele V, Etienne S, Villain M, Ludes B, Kintz P. Forensic Sci. Int. 2004;143:153. doi: 10.1016/j.forsciint.2004.02.035. [DOI] [PubMed] [Google Scholar]
- 22.Cirimele V, Kintz P, Lohner S, Ludes B. J. Anal. Toxicol. 2003;27:103. doi: 10.1093/jat/27.2.103. [DOI] [PubMed] [Google Scholar]
- 23.Tracqui A, Kintz P, Mangin P. J. Forensic Sci. 1997;42(1):111. [PubMed] [Google Scholar]
- 24.Miller EI, Torrance HJ, Oliver JS. J. Anal. Toxicol. 2006;30:115. doi: 10.1093/jat/30.2.115. [DOI] [PubMed] [Google Scholar]
- 25.Favretto D, Frison G, Vogliardi S, Ferrara SD. Rapid Commun. Mass Spectrom. 2006;20:1257. doi: 10.1002/rcm.2444. [DOI] [PubMed] [Google Scholar]
- 26.Liu AC, Lin TY, Su LW, Fuh MR. Talanta. 2008;75:198. doi: 10.1016/j.talanta.2007.10.050. [DOI] [PubMed] [Google Scholar]
- 27.Hull MJ, Bierer MF, Griggs DA, Long WH, Nixon AL, Flood JG. J. Anal. Toxicol. 2008;32:516. doi: 10.1093/jat/32.7.516. [DOI] [PubMed] [Google Scholar]
- 28.Kacinko S, Concheiro-Guisan M, Shakleya D, Huestis M. Anal. Bioanal. Chem. 2008;392:903. doi: 10.1007/s00216-008-2326-z. [DOI] [PMC free article] [PubMed] [Google Scholar]
- 29.Wilkins DG, Rollins DE, Valdez AS, Mizuno A, Krueger GC, Cone EJ. J. Anal. Toxicol. 1999;23:409. doi: 10.1093/jat/23.6.409. [DOI] [PubMed] [Google Scholar]
- 30.Kintz P. J. Anal. Toxicol. 1993;17:443. doi: 10.1093/jat/17.7.443. [DOI] [PubMed] [Google Scholar]
- 31.Goodwin RS, Wilkins DG, Averin O, Choo RE, Schroeder JR, Jasinski DR, Johnson RE, Jones HE, Huestis MA. Clin. Chem. 2007;53:2136. doi: 10.1373/clinchem.2007.091413. [DOI] [PubMed] [Google Scholar]
- 32.Thieme D, Sachs H, Thevis M. J. Mass Spectrom. 2008;43:974. doi: 10.1002/jms.1433. [DOI] [PubMed] [Google Scholar]
- 33.Kintz P, Tracqui A, Mangin P, Edel Y. J. Anal. Toxicol. 1996;20:393. doi: 10.1093/jat/20.6.393. [DOI] [PubMed] [Google Scholar]
- 34.Kacinko SL, Shakleya DM, Huestis MA. Anal. Chem. 2008;80:246. doi: 10.1021/ac701627q. [DOI] [PMC free article] [PubMed] [Google Scholar]
- 35.Grimm D, Pauly E, Poschl J, Linderkamp O, Skopp G. Ther. Drug Monit. 2005;27:526. doi: 10.1097/01.ftd.0000164612.83932.be. [DOI] [PubMed] [Google Scholar]
- 36.Concheiro-Guisan M, Shakleya DM, Huestis MA. Anal. Bioanal. Chem. 2009;394:513. doi: 10.1007/s00216-009-2706-z. [DOI] [PMC free article] [PubMed] [Google Scholar]
- 37.Concheiro M, Shakleya DM, Huestis MA. Forensic Sci. Int. 2009;188:144. doi: 10.1016/j.forsciint.2009.04.005. [DOI] [PMC free article] [PubMed] [Google Scholar]
- 38.Musshoff F, Trafkowski J, Kuepper U, Madea B. J. Mass Spectrom. 2006;41:633. doi: 10.1002/jms.1021. [DOI] [PubMed] [Google Scholar]
- 39.Ceccato A, Klinkenberg R, Hubert P, Streel B. J. Pharm. Biomed. Anal. 2003;32:619. doi: 10.1016/s0731-7085(03)00169-9. [DOI] [PubMed] [Google Scholar]
- 40.Scislowski M, Piekoszewski W, Kamenczak A, Florek E. J. Anal. Toxicol. 2005;29:249. doi: 10.1093/jat/29.4.249. [DOI] [PubMed] [Google Scholar]
- 41.Rodriguez-Rosas ME, Lofwall MR, Strain EC, Siluk D, Wainer IW. J. Chromatogr. B. 2007;850:538. doi: 10.1016/j.jchromb.2006.11.025. [DOI] [PubMed] [Google Scholar]
- 42.Hoja H, Marquet P, Verneuil B, Lotfi H, Dupuy JL, Lachatre G. J. Anal. Toxicol. 1997;21:160. doi: 10.1093/jat/21.2.160. [DOI] [PubMed] [Google Scholar]
- 43.Polettini A, Huestis MA. J. Chromatogr. B. 2001;754:447. doi: 10.1016/s0378-4347(01)00029-9. [DOI] [PubMed] [Google Scholar]
- 44.Al-Asmari AI, Anderson RA. J. Anal. Toxicol. 2007;31:394. doi: 10.1093/jat/31.7.394. [DOI] [PubMed] [Google Scholar]
- 45.US Department of Health and Human Services Food and Drug Administration. Center for Veterinary Medicine. 2003 [Google Scholar]
- 46.European Union Decision 2002/657/EC (17/8/2002) Off. J. Eur. Commun. 2002;221:8. [Google Scholar]
- 47.Allen KR. Clin. Toxicol. (Phila) 2006;44:147. doi: 10.1080/15563650500514434. [DOI] [PubMed] [Google Scholar]
- 48.Nordgren HK, Holmgren P, Liljeberg P, Eriksson N, Beck O. J. Anal. Toxicol. 2005;29:234. doi: 10.1093/jat/29.4.234. [DOI] [PubMed] [Google Scholar]
- 49.Jones HE, Johnson RE, Jasinski DR, O'Grady KE, Chisholm CA, Choo RE, Crocetti M, Dudas R, Harrow C, Huestis MA, Jansson LM, Lantz M, Lester BM, Milio L. Drug Alcohol Depend. 2005;79:1. doi: 10.1016/j.drugalcdep.2004.11.013. [DOI] [PubMed] [Google Scholar]
- 50.Krouwer JS, Rabinowitz R. Clin. Chem. 1984;30:290. [PubMed] [Google Scholar]
- 51.Potsch L, Skopp G, Moeller MR. Forensic Sci. Int. 1997;84:25. doi: 10.1016/s0379-0738(96)02045-2. [DOI] [PubMed] [Google Scholar]
- 52.Moody DE, Slawson MH, Strain EC, Laycock JD, Spanbauer AC, Foltz RL. Anal. Biochem. 2002;306:31. doi: 10.1006/abio.2002.5673. [DOI] [PubMed] [Google Scholar]
- 53.Wilkinson PK. Alcohol. Clin. Exp. Res. 1980;4:6. doi: 10.1111/j.1530-0277.1980.tb04785.x. [DOI] [PubMed] [Google Scholar]
- 54.Wang S, Cyronak M, Yang E. J. Pharm. Biomed. Anal. 2007;43:701. doi: 10.1016/j.jpba.2006.08.010. [DOI] [PubMed] [Google Scholar]
- 55.Leonardi ET, Azmitia EC. Neuropsychopharmacology. 1994;10:231. doi: 10.1038/npp.1994.26. [DOI] [PubMed] [Google Scholar]
- 56.Boskovic R, Klein J, Woodland C, Karaskov C, Koren G. Can. J. Physiol. Pharmacol. 2001;79:942. [PubMed] [Google Scholar]