
Figure 6.
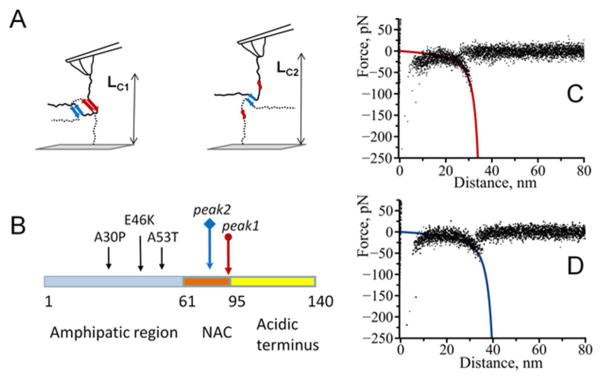
Interaction model of alpha-synuclein molecules. The model describes two (observed for all the variants of alpha-synuclein) major peaks in the contour length histograms as sites of same identity interacting with each other with the formation of a dimer. A) Position of the interacting site further from C-end (point of attachment) results in longer contour length value. B) Positions of the beginning of detected interaction sites. Colored arrows correspond to two detected major interaction sites schematically shown in A), black arrows show the positions of A30P, E46K and A53T mutations in alpha-synuclein. C) and D) superposition of representative force-distance curves for the detected rupture events corresponding to LC1 and LC2.