

Abstract
Cortical processing of sensory information initiates from the transformation of thalamically-relayed signals. By optogenetically silencing intracortical circuits to isolate thalamic inputs to layer 4 neurons, we show that intracortical excitation linearly amplifies thalamocortical responses underlying frequency and direction selectivity with preserved spectral range and tuning, and prolongs the response duration. This signal pre-amplification and prolongation enhances the salience of thalamocortically-relayed information and ensures its robust, faithful and more persistent representation.
Across sensory modalities, information undergoes lamina-specific processing in the cortex1,2. Layer 4 is the major thalamo-recipient layer1-4. Instead of passively receiving the afferent input, it has been proposed to play an active role in thalamocortical transformation by integrating local and distant intracortical excitatory inputs5-7. In previous attempts to dissect the thalamocortical and intracortical excitatory inputs to individual cortical neurons, technical limitations exist in silencing the cortex in a specific and reversible manner so that the precise functional role of intracortical excitation remains not well understood5-10. Specifically, in the auditory cortex, it remains controversial4,11-13 how the thalamocortical and intracortical excitation determine the spectral integration of cortical neurons respectively and what is their quantitative relationship. Here, using an optogenetic approach14-16 in the mouse primary auditory cortex (A1), we silenced cortical circuits in a reversible manner by activating parvalbumin-positive (PV) inhibitory neurons. We were thus able to isolate the thalamocortical and intracortical excitation onto the same neuron and quantitatively examine their relationship.
We took advantage of Cre/loxP recombination to express channelrhodopsin-2 (ChR2) in PV neurons. An adeno-associated viral vector AAV2/9-EF1α-DIO-hChR2-EYFP was injected into the A1 of PV-Cre tdTomato transgenic mice (see Methods). ChR2 was expressed specifically in PV neurons, as shown by the colocalization of EYFP and tdTomato fluorescence in cortical slices two weeks after the injection (Fig. 1a, b). With in vivo two-photon imaging guided recording from tdTomato-labeled PV neurons, we found that illuminating the exposed A1 surface with blue LED light (470nm) dramatically increased firing of these neurons (Fig. 1c) in each of consecutive trials (Supplementary Fig. 1a). In contrast, LED illumination completely blocked spiking of excitatory neurons recorded in both layer 4 and 6 (Fig. 1d), due to a large inhibitory current caused by the activation of PV neurons (Fig. 1d, middle panel).
Figure 1.
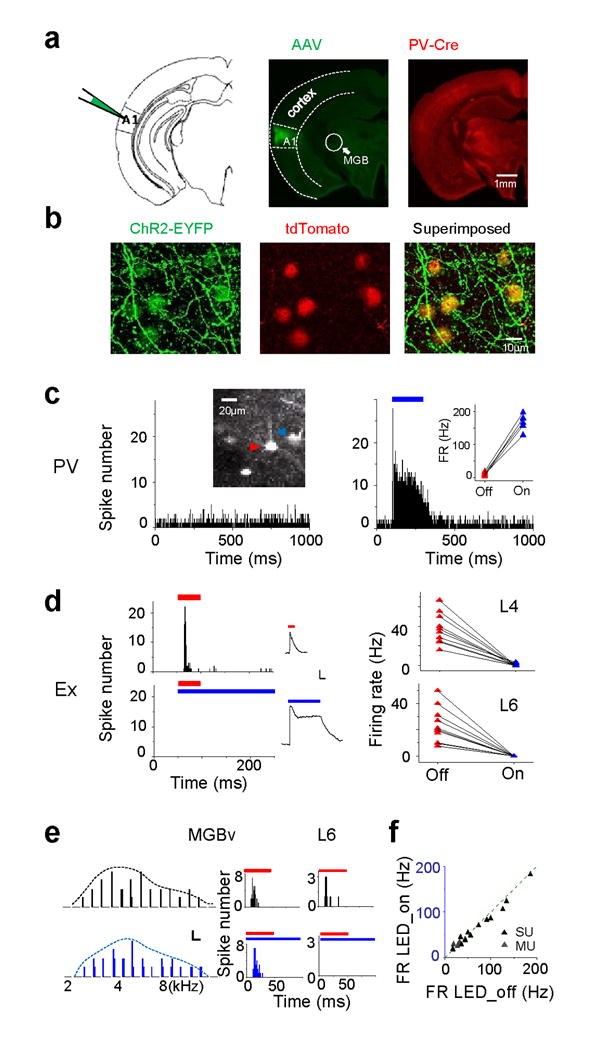
Optogenetic silencing of intracortical circuits in auditory cortex. (a) Schematic drawing and confocal images of a brain section, showing ChR2-EYFP and tdTomato expression in the A1. (b) ChR2-EYFP was expressed in tdTomato-labeled PV neurons. (c) Peri-stimulus spike time histogram (PSTH) for an example PV cell without (left) and with (right) LED illumination (blue bar, 200 ms). Left inset, two-photon image of the cell-attached recording from the PV cell. Right inset, average firing rates in LED off (red) and LED on (blue) trials for 5 PV cells. (d) Left, PSTH of a layer 4 excitatory neuron to tone stimuli (red bar), and to combined tone and LED stimulation (blue bar). Middle, tone-evoked inhibitory current of an example cell (top) and LED-evoked inhibitory current in the same cell (bottom). Scale: 80 pA, 100 ms. Right, summary of tone-evoked firing rates without (red) and with (blue) LED illumination in layer 4 (L4) and layer 6 (L6) cells. Line connects data for the same cell. (e) Left, reconstructed frequency tuning of multi-unit spikes (shown by PSTH) for a MGBv site. Top, tone stimulation only. Bottom, tone combined with LED illumination. Scale: 1 (count), 100 ms. Middle, PSTHs of spike responses to tones (red bar) without (top) and with LED illumination (bottom). Right, PSTHs for a layer 6 excitatory neuron recorded in the same animal. (f) Summary of tone-evoked firing rates (FR) in single-cell loose-patch (SU) and multi-unit (MU) recordings without and with LED illumination (P = 0.08, paired t-test, n = 19).
With LED illumination, while tone-evoked spike responses were eliminated in layer 6, those of thalamic neurons in the ventral medial geniculate body (MGBv) of the same animal were apparently unaffected (Fig. 1e). Both multi-unit and single-cell loose-patch recordings revealed that the average evoked firing rate (Fig. 1f) and the frequency tuning properties (Supplementary Fig. 2) in the MGBv remained unchanged after cortical silencing, consistent with previous observations12,17-19.
We next examined the relative contributions of thalamocortical and intracortical excitatory circuits to frequency tuning by applying brief tone stimuli. Whole-cell voltage-clamp recordings were made from layer 4 excitatory neurons, with their membrane potential clamped at the reversal potential of inhibitory currents (see Methods). In the same cell, thalamocortical response was isolated from the total excitatory response by reversibly silencing the cortex. Control trials with the tone stimulus only (LED off) and trials with the tone stimulus coupled with LED illumination (LED on) were alternated. As shown by two example cells (Fig. 2a–d), LED illumination decreased the peak amplitudes of excitatory responses at all the effective tone frequencies (Fig. 2a, c). Linear fitting shows that response amplitude was reduced by a similar fraction across different frequencies, resulting in largely unchanged frequency tuning (Fig. 2b, d, left). The onset latencies of tone-evoked responses exhibited a frequency-dependent modulation, with the shortest latency occurring at the best frequency (BF) and the longest latencies at frequencies distant from the BF. The latency was not apparently different in the presence of LED illumination (Fig. 2b, d, right), supporting the notion that across effective frequencies thalamocortical input generates the earliest excitatory response in cortical cells.
Figure 2.

Intracortical input linearly amplifies frequency-tuned thalamocortical input. (a) Average tone-evoked excitatory currents in an example cell at different frequencies without (black) and with (blue) LED illumination. The envelope curve outlines the frequency tuning of peak amplitude. Scale: 0.05 nA, 200 ms. (b) Left, peak amplitude of thalamic input versus total excitation evoked by the same tone stimulus. Linear fitting: r = 0.91, slope = 0.32, P < 1e-8, one-tail. Inset, the two envelope curves from a (normalized and superimposed). Right, onset latencies of thalamocortical (blue) and total (red) excitatory responses at different frequencies. (c, d) Another example cell. Scale: 0.035 nA, 200 ms. Linear fitting: r = 0.77, slope = 0.76, P = 3.4e-6, one-tail. (e) Total frequency range of thalamic input versus total excitation (2.74 ± 0.61 vs. 2.79 ± 0.61 octave, P = 0.38, Wilcoxon signed-rank test). Each data point represents one cell. (f) BW50% of thalamic input versus total excitation (1.79 ± 0.61 vs. 1.84 ± 0.57, P = 0.49, paired t-test). (g) Average peak amplitude of thalamic input versus total excitation (0.03 ± 0.03 vs. 0.07 ± 0.05 nA, P = 1.9e-4, paired t-test). (h) Response duration of thalamic input (measured at 10% of the maximal amplitude of BF-tone responses) versus total excitation (51.17 ± 22.06 vs. 92.99 ± 44.8 ms, P = 3.66e-4, Wilcoxon signed-rank test). Inset, average response traces without (black) and with (blue) LED illumination of an example cell. Scale: 0.04 nA, 50 ms.
For fourteen layer 4 excitatory neurons, we did not observe a significant change in frequency tuning of excitation after cortical silencing, as quantified by the total frequency range (Fig. 2e) and half-maximum bandwidth (BW50%) of tuning curve (Fig. 2f), as well as by the BF and tuning sharpness (Supplementary Fig. 3a-b). The linear relationship between thalamocortical and introcortical excitatory responses was strong in all the cells, with the correlation coefficients all higher than 0.74 (Supplementary Table 1). Similar observations were made when the total integrated charge of excitatory current was measured (Supplementary Fig. 4).
To demonstrate changes in response magnitude, we plotted the average peak amplitude of all the responses within the effective frequency range in LED on trials against that in control (LED off) trials (Fig. 2g). A scaling factor was calculated as the average peak amplitude in LED on trials divided by that in control trials. The average scaling factor was 0.41 ± 0.15 (mean ± s.d.), indicating that on average thalamocortical input was amplified by about 2.4 fold. The amplification factor for responses around the BF was not significantly different from that at frequencies distant from the BF (Supplementary Fig. 3c), further indicating that thalamocortical responses have been amplified linearly by intracortical excitatory inputs. In addition, the response duration was significantly reduced after cortical silencing (Fig. 2h). The scaling factor based on integrated charge (average 0.25 ± 0.08, corresponding to a 4-fold amplification) was smaller than that based on peak amplitude, likely due to the recruitment of late arriving intracortical excitation. Thus, intracortical circuits have both amplified and prolonged tone-evoked excitatory currents.
By reversibly silencing the cortex, we further compared direction tuning of thalamocortical input and total excitation to determine how much a direction bias already present in excitatory inputs to layer 4 neurons4,20 can be attributed to thalamocortical relay. As shown by an example cell in Fig. 3a, its excitatory response exhibited a clear preference to the upward-directed FM sweep (changing from low to high frequency). In the presence of LED illumination, response amplitudes to both the upward and downward sweeps were reduced, while the preference to the upward sweep sustained. In a total of seven cells which showed a clear direction bias in their excitatory responses, we found that direction tuning was preserved after cortical silencing, as quantified by a direction selectivity index (DSI) (Fig. 3b, top). This is due to the fact that the responses to upward and downward sweeps were reduced by a similar factor (Fig. 3b, bottom). Measurements of both peak response amplitude and integrated charge (Supplementary Fig. 5) of excitatory current demonstrate that thalamic neurons do provide direction-biased input into the cortex, and that intracortical excitation amplifies this thalamocortical signal without affecting the inherited direction tuning.
Figure 3.
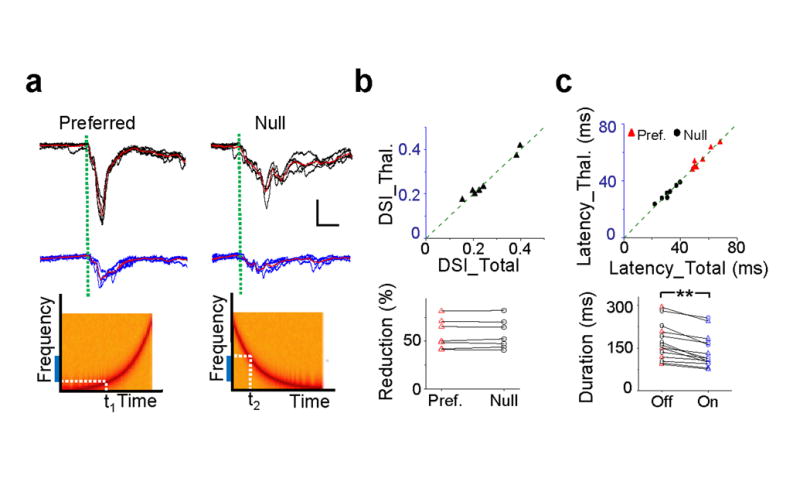
Intracortical input preserves direction tuning of thalamocortical input. (a) Top, superimposed excitatory currents and their average (red) evoked by upward and downward sweeps in an example cell without (upper) and with (lower) LED illumination. Green dotted line marks the response onset. Scale: 0.04 nA, 20 ms. Bottom, spectrograms of upward and downward FM sweeps. Blue bar labels the effective frequency range (frequency receptive field). t1 and t2 mark the timing when the FM sweeps hit its boundary. (b) Top, direction selectivity index (DSI) of thalamocortical input versus total excitation (0.26 ± 0.03 vs. 0.26 ± 0.03, P = 0.58, Wilcoxon signed-rank test, n = 7). Bottom, percentage reduction of peak response amplitude after cortical silencing for the preferred and null directional stimuli (0.57 ± 0.05 vs. 0.58 ± 0.05, P = 0.97, paired t-test). (c) Top, onset latency of thalamocortical input versus total excitatory input for the preferred and null directional stimuli. Preferred direction, 55.02 ± 2.56 vs. 55.28 ± 2.58 ms, P = 0.74, paired t-test; null direction, 31.38 ± 2.09 vs. 31.56 ± 1.87 ms, P = 0.75, paired t-test, n = 7. Bottom, response duration measured at the level of 10% of the maximal amplitude without (off) and with (on) LED illumination (170.39 ± 61.63 vs. 138.36 ± 55.14 ms, P = 1.22e-4, Wilcoxon signed-rank test, n = 14).
Finally, we found that the onset latencies of sweep responses did not change for either direction after cortical silencing (Fig. 3c, top). As illustrated by the schematic drawings in Fig. 3a, the onset latency provides information on the boundary of the frequency receptive field. The unchanged onset latencies indicate that the receptive field boundaries on both the low- and high-frequency sides are preserved. This is consistent with the finding that the spectral range has been set by thalamocortical input (Fig. 2e). Similar as the tone-evoked responses, the temporal durations of sweep responses at both the preferred and null directions were reduced after cortical silencing (Fig. 3c, bottom), indicating that the recruitment of intracortical excitatory inputs also prolonged sweep responses.
While the functional properties of neurons in the recipient layers of sensory cortices are generally considered to be determined by the convergence of thalamocortical connections5-7,9,11, the role of intracortical excitatory circuits in transforming the thalamocortical signals remains unclear2-4,12. Here, the optogenetic approach breaks the technical barriers4,11,12 in previous studies. The specificity and reversibility of optical stimulation allows the thalamocortical and intracortical components of synaptic excitation to be more faithfully revealed in individual cells. Our results indicate that intracortical excitation linearly amplifies the received thalamocortical signals, without recruitments of additional spectral information through horizontal intracortical connections. Furthermore, for excitatory responses to both FM-sweep and tone stimuli, intracortical circuits have prolonged their time course, likely due to recruitments of late arriving polysynaptic excitatory inputs. Thus, analogous to a preamplifier, intracortical excitatory circuits play an active role in increasing the gain and duration of thalamocortical input signals, leading to a great enhancement of signal/noise ratio and a robust and faithful representation of thalamically-conveyed information.
Methods
Viral injection
All experimental procedures in this study were approved by the Animal Care and Use Committee of USC. Adult, PV-Cre x Ai14 tdTomato reporter line (The Jackson Laboratory) pigmented female mice were anesthetized with 2% isoflurane. The area of skull over the left primary auditory cortex (A1) (temporal lobe, 2.2 mm to 3.64 mm caudal to Bregma) was thinned and ∼0.2 mm2 craniotomy was performed. The virus was delivered using a bevelled glass micropipette (tip diameter 40–50 μm) attached to a microsyringe pump (World Precision Instruments). Adeno-associated viruses (AAVs) to deliver ChR2 were acquired from the UPenn Viral Vector Core: AAV2/9.EF1α.DIO.hChR2(H134R)-EYFP.WPRE.hGH (Addgene 20298). Viral solution was injected at a volume of 100 nl/injection and at a rate of 20 nl/min. Injection was performed at two locations (2.7 mm and 3.2 mm caudal to Bregma) and two depths (300 μm and 600 μm). The diffusion of the virus in the cortex was about 800 μm from the injection site. We then sutured the scalp, and administered an analgesic (0.1 mg/kg Buprenex) to help the recovery from anesthesia.
Animal preparation and extracellular recording from A1
Mice were allowed to recover for two to four weeks. Experiments were carried out in a sound-attenuation booth (Acoustic Systems). Adult viral injected mice were sedated with chlorprothixene (0.05 ml of 4 mg/ml) and anaesthetized with urethane (1.2 g/kg). Local anaesthesia was applied by administrating bupivacaine subcutaneously. The left auditory cortex was exposed and the ear canal on the same side was plugged. We first carried out sequential multi-unit recordings at an array of cortical sites to identify the location and the frequency gradient of the A1. Tone pips (50 ms duration, 3 ms ramp) of various frequencies (2-32 kHz, at 0.1 octave interval) and intensities (10 dB interval, 7 intensities from 10 dB sound pressure level) were delivered through a calibrated free-field speaker facing the contralateral ear. The testing stimuli were presented in a pseudorandom sequence. Multi-unit spikes were recorded with a parylene-coated tungsten microelectrode (2 MΩ, FHC) at 400 µm below the pia. Electrode signals were amplified (Plexon Inc.) and band-pass filtered between 300 and 6,000 Hz. A custom LabVIEW (National Instruments) software was used to extract the spike times. The number of tone-evoked spikes was counted within a window of 10-50 ms from the onset of tone stimuli. The characteristic frequency (CF) of each recording site was defined as the tone frequency that evokes reliable responses at the lowest intensity level in the reconstructed spike TRF. A1 region was identified by its tonotopic representation of CFs in a caudal-to-rostral (low to high frequency) gradient, relatively sharp spike TRFs and short onset latencies. After the pre-mapping of A1, all the later experiments were performed in the low to mid-frequency (with CF ∼4-16 kHz) regions. During the mapping procedure, the cortical surface was slowly perfused with a pre-warmed artificial cerebrospinal fluid (ACSF; containing in mM: NaCl 124, NaH2PO4 1.2, KCl 2.5, NaHCO3 25, Glucose 20, CaCl2 2, MgCl2 1). The spatial expression pattern of hChR2(H134R)-EYFP in each injected mouse was examined with a fluorescence microscope before and after the experiment. Only data from animals with EYFP expressing in the correct location were included in the analysis. In more than 200 EYFP expressing neurons examined, all the cells were found to express tdTomato, i.e. they were all PV neurons.
Extracellular recording in MGBv
To map the auditory thalamus, we first carried out extracellular recordings in a three-dimensional manner by systematically varying the depth and the x-y coordinates of the tungsten electrode which penetrated the primary auditory cortical surface with an approximately right angle. We discriminated the MGBv from other auditory thalamic divisions according to its tonotopic frequency representation, relatively sharp spike TRFs and short onset latencies21. Afterwards, multi-unit or single-cell loose-patch recordings were made around the central region of the MGBv (approximately 2.4∼2.6 mm below the auditory cortical surface).
In vivo loose-patch and whole-cell voltage-clamp recordings
Loose-patch and whole-cell recordings were carried out as previously described22-24. We used agar (3.25%) to minimize cortical pulsation. Patch pipettes (Kimax) with ∼4-5 MΩ impedance were used. For whole-cell voltage-clamp recordings, the internal solution contained (in mM): 125 Cs-gluconate, 5 TEA-Cl, 4 MgATP, 0.3 GTP, 10 phosphocreatine, 10 HEPES, 1 EGTA, 2 CsCl, 1.5 QX-314, 1% biocytin or 0.1 fluorescent dextrans, pH 7.2. Recordings were made with an Axopatch 200B amplifier (Molecular Devices). The pipette capacitance and whole-cell capacitance were compensated completely, and the series resistance (15-30 MΩ) was compensated by 50%-60% (100 μS lag). Signals were filtered at 2 kHz and sampled at 10 kHz. The evoked excitatory currents were resolved by clamping the cell at the reversal potential of inhibitory currents. The reversal potential (∼ – 65 – – 75 mV) was determined for each recorded neuron by systematically changing the holding voltage until LED evoked currents disappeared. LED illumination resulted in a decrease (∼30% on average) of the original input resistance (150-200 MΩ), but without changes in series resistance. Under our experimental condition, the change of input resistance would result in a small (less than 10%) change in the amplitude of recorded synaptic currents25, which would not significantly affect our results. We specifically recorded from neurons located at 375–525 μm below the pia, corresponding to layer 4. The depth of layer 4 was determined based on the fluorescence pattern in a layer 4-specific Cre line (Scnn1a-Tg3-Cre, The Jackson laboratory) crossed with the Ai14 reporter line. By correlating the depth of recorded cell bodies, which were labelled by fluorescent dextrans in the intrapipette solution, with the travel distance of the electrode tip, we found that under our experimental condition, the travel distance relatively precisely indicated the depth of recorded cells after the correction of a systemic error of 20 ± 7 μm (n =12)26. The reconstructed morphologies of biocytin-labelled neurons confirmed the layer 4 location (Supplementary Fig. 1b). The recorded neurons exhibited sound-evoked responses after cortical silencing, indicating that they were directly innervated by thalamic axons. For loose-patch recordings, pipettes were filled with filtered ACSF. Recording was performed in a similar way as the whole-cell recording, except that a loose seal (0.1–0.5 giga Ohm) was made on the cell body, allowing spikes only from the patched cell to be recorded. Spike responses were recorded under the voltage-clamp mode, with the command potential adjusted so that a 0 pA baseline current was achieved. Signals were filtered at 10 kHz and sampled at 10 kHz. With large pipette openings (impedance ≤ 6MΩ), we did not record any fast-spiking neurons in our loose-patch recordings, suggesting that our recording parameters imposed a strong sampling bias toward pyramidal neurons with larger cell bodies and more extensive dendritic fields. This is further supported by the histological reconstruction of morphologies of some recorded neurons (Supplementary Fig. 1b), and is consistent with previous reports22-24 that blind patch recording with large pipette opening sizes has a strong sampling bias toward excitatory neurons.
In vivo two-photon imaging-guided recording
Two-photon imaging guided recordings were made from PV neurons in viral injected PV-Cre tdTomato mice. In vivo two-photon imaging was performed with a custom-built imaging system as previously described27,28. A mode-locked Ti:sapphire laser (MaiTai Broadband, Spectra-Physics) was tuned at 880 nm with the output power at 50–300 mW for fluorescently labeled PV cells in middle layers. For cell-attached recording, the glass pipette, with ∼1 μm tip opening and 8–10 MΩ impedance, was filled with filtered ACSF containing 0.15 mM calcein (Invitrogen). The pipette tip was navigated in the cortex and patched onto a fluorescent soma as previously described27, 28. After confirming a successful targeting, the positive pressure in the pipette (∼10 mbar) was then released and a negative pressure (20–150 mbar) was applied to form a loose seal (with 0.1–0.5 GΩ resistance), which was maintained throughout the course of the recording. The depth of the patched cell was directly determined under imaging with z-step control.
Auditory stimulation
To obtain the frequency tuning of excitatory synaptic currents, a pseudorandom sequence of pure tones (50 ms duration, 3 ms ramp, 2 kHz to 32 kHz, 0.2 octave steps) without and with coupling of LED illumination (500 ms duration; starting from the onset of the sound stimulus) were delivered in an alternating pattern. The inter-stimulus interval was 5-10 sec, corresponding to a 10-20 sec interval between consecutive LED stimulation, which would allow a full recovery of ChR2 function from desensitization29 (Supplementary Fig. 1a). As shown by Supplementary Fig. 1a LED illumination effectively evoked spikes of PV neurons in each of consecutive trials, leading to effective silencing of spikes of excitatory neurons in each trial (see Fig. 1d). Due to the relatively long inter-stimulus interval, we tested frequency tuning mostly at one sound intensity (40∼60 dB sound pressure level). For direction selectivity, logarithmic FM stimuli sweeping between 0.5-64 kHz with a speed of 70 octave/sec were generated and calibrated according to their output envelope20. FM sweeps without and with coupling LED illumination were delivered in an alternating pattern. Sweep intensity was set at 50 dB sound pressure level.
Photostimulation
Blue (470 nm) fiber-coupled LED was used for photostimulation30. We tested optic fiber of different diameters, and mostly used 0.8 mm fiber (NA 0.39, Thorlabs) in our experiments. The fiber controlled by micromanipulator was positioned close to the surface of the exposed cortical region (∼2mm x 1.5mm, covering the whole primary auditory region). The LED illuminated the entire exposed cortical surface. The LED was driven by a NIDAQ board (National Instruments) with a custom-made LabView software and was coupled with sound generation. For each experiment, loose-patch recordings from excitatory neurons were carried out to verify the effectiveness of cortical silencing. Both loose-patch and multi-unit recordings were carried out in the MGBv to test the effect of cortical silencing on the response properties of auditory thalamic neurons.
Data analysis
Tone-evoked response and onset latency
All the synaptic responses were averaged by trials. The peak synaptic responses were analyzed within a 10-50 ms time window after the tone onset; the integrated charge was calculated within a 0-200 ms time window. The onset latency of the average synaptic trace was identified at the time point in the rising phase of the response waveform, where the amplitude exceeded the average baseline level by 2 standard deviations of the baseline fluctuation. Only responses with onset latencies within 7-40 ms from the onset of tone stimulus were considered as evoked.
Frequency tuning and direction selectivity
For frequency tuning of excitatory responses at a given tone intensity, the total effective frequency range (i.e. tuning range) was determined by the frequency range for all the significantly evoked responses. Best frequency (BF) was defined as the frequency that evoked the maximum excitatory response. To quantify the BW50% of frequency tuning, an envelope curve (i.e. tuning curve) was generated using MATLAB software Envelope 1.1 (The MathWorks) based on the peak amplitude or total charge of synaptic responses within the effective frequency range. The direction selectivity index (DSI) was defined as (R1 – R2)/(R1 + R2), where R1 is the response magnitude at the preferred direction and R2 is that at the null direction.
Statistics
Kolmogorov-Smirnov test (here we used Lilliefors test, an adapted KS test) and Shapiro-Wilk test (when sample size was smaller than 50) were first applied to exam whether samples had a normal distribution. In the case of a normal distribution (e.g.Fig. 2e), paired t-test was applied. Otherwise (e.g.Fig. 2c), a non-parametric test (Wilcoxon signed-rank test in this study) was applied. Statistics using the non-parametric and parametric tests led to the same conclusion in this study. Data were presented as mean ± s.d. if not otherwise specified. Since the responses with and without cortical silencing were tested for multiple (5-10) times, paired t-test or Wilcoxon signed-rank test was also performed on an individual-cell basis. The results were consistent with the group comparison.
Supplementary Material
Acknowledgments
This work was supported by grants to L.I.Z. from the US National Institutes of Health (DC008983) and the David and Lucile Packard Foundation. H.W. T. was supported by a NIH grant (EY019049). L.I.Z. conceived and supervised the study. L.L., Y.L., and M.Z. performed the experiment. L.L., H.W.T, and L.I.Z. performed data analysis. H.W.T. and L.I.Z. wrote the paper.
References
- 1.Callaway EM. Annu Rev Neurosci. 1998;21:47–74. doi: 10.1146/annurev.neuro.21.1.47. [DOI] [PubMed] [Google Scholar]
- 2.Douglas RJ, Martin KA. Annu Rev Neurosci. 2004;27:419–451. doi: 10.1146/annurev.neuro.27.070203.144152. [DOI] [PubMed] [Google Scholar]
- 3.Winer JA, Miller LM, Lee CC, Schreiner CE. Trends Neurosci. 2005;28:255–263. doi: 10.1016/j.tins.2005.03.009. [DOI] [PubMed] [Google Scholar]
- 4.Wu GK, Tao HW, Zhang LI. Neurosci Biobehav Rev. 2011;35:2094–2104. doi: 10.1016/j.neubiorev.2011.05.004. [DOI] [PMC free article] [PubMed] [Google Scholar]
- 5.Douglas RJ, Koch C, Mahowald M, Martin KA, Suarez HH. Science. 1995;269:981–985. doi: 10.1126/science.7638624. [DOI] [PubMed] [Google Scholar]
- 6.Somers DC, Nelson SB, Sur M. J Neurosci. 1995;15:5448–5465. doi: 10.1523/JNEUROSCI.15-08-05448.1995. [DOI] [PMC free article] [PubMed] [Google Scholar]
- 7.Miller KD, Pinto DJ, Simons DJ. Curr Opin Neurobiol. 2001;11:488–497. doi: 10.1016/s0959-4388(00)00239-7. [DOI] [PubMed] [Google Scholar]
- 8.Ferster D, Chung S, Wheat H. Nature. 1996;380:249–252. doi: 10.1038/380249a0. [DOI] [PubMed] [Google Scholar]
- 9.Miller LM, Escabi MA, Read HL, Schreiner CE. Neuron. 2001;32:151–160. doi: 10.1016/s0896-6273(01)00445-7. [DOI] [PubMed] [Google Scholar]
- 10.Bruno RM, Sakmann B. Science. 2006;312:1622–1627. doi: 10.1126/science.1124593. [DOI] [PubMed] [Google Scholar]
- 11.Kaur S, Lazar R, Metherate R. J Neurophysiol. 2004;91:2551–2567. doi: 10.1152/jn.01121.2003. [DOI] [PubMed] [Google Scholar]
- 12.Liu BH, Wu GK, Arbuckle R, Tao HW, Zhang LI. Nat Neurosci. 2007;10:1594–1600. doi: 10.1038/nn2012. [DOI] [PMC free article] [PubMed] [Google Scholar]
- 13.Happel MF, Jeschke M, Ohl FW. J Neurosci. 2010;30:11114–11127. doi: 10.1523/JNEUROSCI.0689-10.2010. [DOI] [PMC free article] [PubMed] [Google Scholar]
- 14.Zhang F, Aravanis AM, Adamantidis A, de Lecea L, Deisseroth K. Nat Rev Neurosci. 2007;8:577–581. doi: 10.1038/nrn2192. [DOI] [PubMed] [Google Scholar]
- 15.Bernstein JG, Garrity PA, Boyden ES. Current opinion in neurobiology. 2012;22:61–71. doi: 10.1016/j.conb.2011.10.023. [DOI] [PMC free article] [PubMed] [Google Scholar]
- 16.Olsen SR, Bortone DS, Adesnik H, Scanziani M. Nature. 2012;483:47–52. doi: 10.1038/nature10835. [DOI] [PMC free article] [PubMed] [Google Scholar]
- 17.Sun YJ, Kim YJ, Ibrahim LA, Tao HW, Zhang LI. J Neurosci. 2013;33:5326–5339. doi: 10.1523/JNEUROSCI.4810-12.2013. [DOI] [PMC free article] [PubMed] [Google Scholar]
- 18.Zhou Y, et al. Neuron. 2010;65:706–717. doi: 10.1016/j.neuron.2010.02.021. [DOI] [PMC free article] [PubMed] [Google Scholar]
- 19.Zhou Y, et al. J Neurosci. 2012;32:9969–9980. doi: 10.1523/JNEUROSCI.1384-12.2012. [DOI] [PMC free article] [PubMed] [Google Scholar]
- 20.Zhang LI, Tan AY, Schreiner CE, Merzenich MM. Nature. 2003;424:201–205. doi: 10.1038/nature01796. [DOI] [PubMed] [Google Scholar]
- 21.Hackett TA, Barkat TR, O'Brien BM, Hensch TK, Polley DB. J Neurosci. 2011;31:2983–2995. doi: 10.1523/JNEUROSCI.5333-10.2011. [DOI] [PMC free article] [PubMed] [Google Scholar]
- 22.Margrie TW, Brecht M, Sakmann B. Pflugers Archiv : European journal of physiology. 2002;444:491–498. doi: 10.1007/s00424-002-0831-z. [DOI] [PubMed] [Google Scholar]
- 23.Wehr M, Zador AM. Nature. 2003;426:442–446. doi: 10.1038/nature02116. [DOI] [PubMed] [Google Scholar]
- 24.Zhou M, Tao HW, Zhang LI. J Neurosci. 2012;32:18068–18078. doi: 10.1523/JNEUROSCI.3647-12.2012. [DOI] [PMC free article] [PubMed] [Google Scholar]
- 25.Zhang M, et al. J Neurosci. 2011;31:5460–5469. doi: 10.1523/JNEUROSCI.6220-10.2011. [DOI] [PMC free article] [PubMed] [Google Scholar]
- 26.Li YT, et al. J Neurosci. 2012;32:16466–16477. doi: 10.1523/JNEUROSCI.3221-12.2012. [DOI] [PMC free article] [PubMed] [Google Scholar]
- 27.Liu BH, et al. J Neurosci. 2009;29:10520–10532. doi: 10.1523/JNEUROSCI.1915-09.2009. [DOI] [PMC free article] [PubMed] [Google Scholar]
- 28.Ma WP, et al. J Neurosci. 2010;30:14371–14379. doi: 10.1523/JNEUROSCI.3248-10.2010. [DOI] [PMC free article] [PubMed] [Google Scholar]
- 29.Lin JY, Lin MZ, Steinbach P, Tsien RY. Biophys J. 2009;96:1803–1814. doi: 10.1016/j.bpj.2008.11.034. [DOI] [PMC free article] [PubMed] [Google Scholar]
- 30.Adesnik H, Bruns W, Taniguchi H, Huang ZJ, Scanziani M. Nature. 2012;490:226–231. doi: 10.1038/nature11526. [DOI] [PMC free article] [PubMed] [Google Scholar]
Associated Data
This section collects any data citations, data availability statements, or supplementary materials included in this article.