Abstract
Background
The miRNAs, a class of short approximately 22‐nucleotide non‐coding RNAs, often act post‐transcriptionally to inhibit mRNA expression. In effect, they control gene expression by targeting mRNA. They also help in carrying out normal functioning of a cell as they play an important role in various cellular processes. However, dysregulation of miRNAs is found to be a major cause of a disease. It has been demonstrated that miRNA expression is altered in many human cancers, suggesting that they may play an important role as disease biomarkers. Multiple reports have also noted the utility of miRNAs for the diagnosis of cancer. Among the large number of miRNAs present in a microarray data, a modest number might be sufficient to classify human cancers. Hence, the identification of differentially expressed miRNAs is an important problem particularly for the data sets with large number of miRNAs and small number of samples.
Results
In this regard, a new miRNA selection algorithm, called μHEM, is presented based on rough hypercuboid approach. It selects a set of miRNAs from a microarray data by maximizing both relevance and significance of the selected miRNAs. The degree of dependency of sample categories on miRNAs is defined, based on the concept of hypercuboid equivalence partition matrix, to measure both relevance and significance of miRNAs. The effectiveness of the new approach is demonstrated on six publicly available miRNA expression data sets using support vector machine. The.632+ bootstrap error estimate is used to minimize the variability and biasedness of the derived results.
Conclusions
An important finding is that the μHEM algorithm achieves lowest B.632+ error rate of support vector machine with a reduced set of differentially expressed miRNAs on four expression data sets compare to some existing machine learning and statistical methods, while for other two data sets, the error rate of the μHEM algorithm is comparable with the existing techniques. The results on several microarray data sets demonstrate that the proposed method can bring a remarkable improvement on miRNA selection problem. The method is a potentially useful tool for exploration of miRNA expression data and identification of differentially expressed miRNAs worth further investigation.
Keywords: MicroRNA, Feature selection, Rough hypercuboid, Bootstrap error, Support vector machine
Background
The microRNAs or miRNAs are small non‐coding RNAs of length around 22 nucleotides, present in many plants and animals. They repress the expression of a gene post‐transcriptionally. In effect, they regulate expression of a gene or protein. The miRNAs are related to diverse cellular processes and regarded as important components of gene regulatory network. Studies into miRNA function have mainly focused on a variety of human diseases, particularly cancer, and mainly related to the use of miRNAs as disease biomarkers and for monitoring drug efficacy. Multiple reports have noted the utility of miRNAs for the diagnosis of cancer and other diseases [1].
Unlike with mRNAs, a modest number of miRNAs might be sufficient to classify human cancers [1]. Moreover, the bead‐based miRNA detection method has the attractive property of being not only accurate and specific, but also easy to implement in a routine clinical setting. In addition, unlike mRNAs, miRNAs remain largely intact in routinely collected, formalin‐fixed, paraffin‐embedded clinical tissues [2]. Recent studies have also shown that miRNAs can be detected in serum. These studies offer the promise of utilizing miRNA screening via less invasive blood‐based mechanisms. In addition, mature miRNAs are relatively stable. These phenomena make miRNAs superior molecular markers and targets for interrogation and as such, miRNA expression profiling can be utilized as a tool for cancer diagnosis and other diseases.
The functions of miRNAs appear to be different in various cellular functions. Just as miRNA is involved in the normal functioning of eukaryotic cells, so has dysregulation of miRNA been associated with disease [3]. It indicates that these miRNAs can prove to be potential biomarkers for developing a diagnostic tool. Hence, insilico identification of differentially expressed miRNAs that target genes involved in diseases is necessary. These differentially expressed miRNAs can be further used in developing effective diagnostic tools. Recently, few studies are carried out to identify differentially expressed miRNAs [4]‐[9]. However, absence of robust method makes it an open problem.
A miRNA expression data set can be represented by an expression table or matrix, where each row corresponds to one particular miRNA, each column to a sample, and each entry of the matrix is the measured expression level of a particular miRNA in a sample, respectively. However, for microarray data, the number of training samples is typically very small, while the number of miRNAs is in the thousands. Hence, the prediction rule formed by any classifier may not be able to be formed by using all available miRNAs. Even if all the miRNAs can be used, the use of all the miRNAs allows the noise associated with miRNAs of little or no discriminatory power, which inhibits and degrades the performance of the prediction rule in its application to unclassified or test samples. In other words, although the apparent error rate, which is the proportion of the training samples misclassified by the prediction rule, will decrease as it is formed from more and more miRNAs, its error rate in classifying samples outside of the training set eventually will increase. That is, the generalization error of the prediction rule will be increased if it is formed from a sufficiently large number of miRNAs. Hence, in practice, consideration has to be given to implement some procedure of feature selection for reducing the number of miRNAs to be used in constructing the prediction rule [10].
The method called significance analysis of microarrays is used in several works [11]‐[16] to identify differentially expressed miRNAs. Different statistical tests are also employed to identify differentially expressed miRNAs [1,4]‐[8,17]‐[20]. Xu et al. [21] used particle swarm optimization technique for selecting important miRNAs that contribute to the discrimination of different cancer types. However, one of the main problems in miRNA expression data analysis is uncertainty. Some of the sources of this uncertainty include imprecision in computations and vagueness in class definition. In this background, the rough set theory has gained popularity in modeling and propagating uncertainty. It deals with vagueness and incompleteness and is proposed for indiscernibility in classification according to some similarity [22]. It has been applied successfully to feature selection of discrete valued data [23]. Given a data set with discretized attribute values, it is possible to find a subset of the original attributes using rough set theory that are the most informative; all other attributes can be removed from the data set with minimal information loss. The theory of rough sets has also been successfully applied to microarray data analysis in [9,24]‐[35].
However, the real life high dimensional microarray data set may contain a number of irrelevant and insignificant miRNAs [9]. The presence of such miRNAs may lead to a reduction in useful information and degrade the prediction capability. The selected miRNA subset should contain the miRNAs those have high relevance with the classes and high significance in the miRNA set. Such miRNAs are expected to be able to predict the classes of the samples. Accordingly, a measure is required that can assess the effectiveness of a miRNA set [9].
In microarray data, the class labels of samples are represented by discrete symbols, while the expression values of miRNAs are continuous. Hence, to measure both relevance and significance of miRNAs using rough set theory, the continuous expression values of a miRNA have to be divided into several discrete partitions to generate equivalence classes [9]. However, the inherent error that exists in discretization process is of major concern in the computation of the dependency of real valued features. The rough hypercuboid approach of Wei et al. [36] is found to be suitable for numerical data sets.
In this regard, this paper presents a new miRNA selection method, termed as μHEM. It employs rough hypercuboid approach to provide a means by which real valued noisy data can be effectively reduced without the need for user‐specified information. The proposed method selects a subset of miRNAs from whole miRNA set by maximizing both relevance and significance of the selected miRNAs. Using the concept of hypercuboid equivalence partition matrix, the degree of dependency is calculated for miRNAs, which is used to compute both relevance and significance of the miRNAs. Hence, the only information required in the proposed method is in the form of equivalence classes for each miRNA, which can be automatically derived from the data set. The concept of so‐called B.632+ error rate [37] is used to minimize the variability and biasedness of the derived results. The support vector machine is used to compute the B.632+ error rate as well as several other types of error rates as it maximizes the margin between data samples in different classes. The effectiveness of the proposed approach, along with a comparison with other related approaches, is demonstrated on several miRNA expression data sets.
Methods
Data sets used
In the current research work, publicly available six miRNA expression data sets with accession number GSE17681, GSE17846, GSE21036, GSE24709, GSE28700, and GSE31408 are used, which are downloaded from Gene Expression Omnibus (http://www.ncbi.nlm.nih.gov/geo/).
GSE17681
This data set has been generated to detect specific patterns of miRNAs in peripheral blood samples of lung cancer patients. As controls, blood of donors without known affection have been tested. The number of miRNAs, samples, and classes in this data sets are 866, 36, and 2, respectively [38].
GSE17846
This data set represents the analysis of miRNA profiling in peripheral blood samples of multiple sclerosis and in the blood of normal donors. It contains 864 miRNAs, 41 samples, and 2 classes [39].
GSE21036
This data set contains miRNA expression profiles of 218 prostate tumors with primary or metastatic prostate cancer with a median of 5 years clinical follow‐up. The number of miRNAs and samples are 373 and 141, respectively [40].
GSE24709
It analyzes peripheral miRNA blood profiles of patients with lung diseases. The miRNA expression profiling has been done for patients with lung cancer, chronic obstructive pulmonary disease, and normal controls. It contains total 863 miRNAs, 71 samples, and 3 classes.
GSE28700
This data set contains expression profiles of miRNAs from 22 paired gastric cancer and normal tissues. It contains total 44 samples and 470 miRNAs. The samples are grouped into 2 classes [41].
GSE31408
It analyzes miRNA expression profiles of cutaneous T‐cell lymphomas and benign inflammation of skin. It consists of total 705 miRNAs, 148 samples, and 2 classes [42].
Method
Hypercuboid equivalence partition matrix
Let be the set of n objects or samples and denotes the set of m attributes or miRNAs of a given microarray data set , where wij∈ℜ is the measured expression value of the miRNA in the sample xj. Let be the set of class labels or sample categories of n samples. In rough set theory, the attribute sets and are termed as the condition and decision attribute sets in , respectively.
If denotes c equivalence classes or information granules of generated by the equivalence relation induced from the decision attribute set , then c equivalence classes of can also be generated by the equivalence relation induced from each condition attribute . If denotes c equivalence classes or information granules of induced by the condition attribute and n is the number of objects in , then c‐partitions of are the sets of (cn) values that can be conveniently arrayed as a (c×n) matrix . The matrix is denoted by
| (1) |
| (2) |
The tuple [Li,Ui] represents the interval of ith class βi according to the decision attribute set . The interval [Li,Ui] is the value range of condition attribute with respect to class βi. It is spanned by the objects with same class label βi. That is, the value of each object xj with class label βi falls within interval [Li,Ui]. This can be viewed as a supervised granulation process, which utilizes class information.
Generally, an m‐dimensional hypercuboid or hyperrectangle is defined in the m‐dimensional Euclidean space, where the space is defined by the m variables measured for each sample or object. In geometry, a hypercuboid or hyperrectangle is the generalization of a rectangle for higher dimensions, formally defined as the Cartesian product of orthogonal intervals. A d‐dimensional hypercuboid with d attributes as its dimensions is defined as the Cartesian product of d orthogonal intervals. It encloses a region in the d‐dimensional space, where each dimension corresponds to a certain attribute. The value domain of each dimension is the value range or interval that corresponds to a particular class.
The c×n matrix is termed as hypercuboid equivalence partition matrix of the condition attribute . It represents the c‐hypercuboid equivalence partitions of the universe generated by an equivalence relation. Each row of the matrix is a hypercuboid equivalence partition or class. Here represents the membership of object xj in the ith equivalence partition or class βi satisfying following two conditions:
| (3) |
| (4) |
The above axioms should hold for every equivalence partition, which correspond to the requirement that an equivalence class is non‐empty. However, in real data analysis, uncertainty arises due to overlapping class boundaries. Hence, such a granulation process does not necessarily result in a compatible granulation in the sense that every two class hypercuboids or intervals may intersect with each other. The intersection of two hypercuboids also forms a hypercuboid, which is referred to as implicit hypercuboid. The implicit hypercuboids encompass the misclassified samples or objects those belong to more than one classes. The degree of dependency of the decision attribute set or class label on the condition attribute set depends on the cardinality of the implicit hypercuboids. The degree of dependency increases with the decrease in cardinality. Hence, the degree of dependency of decision attribute on a condition attribute set is evaluated by finding the implicit hypercuboids that encompass misclassified objects. Using the concept of hypercuboid equivalence partition matrix, the misclassified objects of implicit hypercuboids can be identified based on the confusion vector defined next
| (5) |
| (6) |
According to the rough set theory, if an object xj belongs to the lower approximation of any class βi, then it does not belong to the lower or upper approximations of any other classes and . On the other hand, if the object xj belongs to the boundary region of more than one classes, then it should be encompassed by the implicit hypercuboid and . Hence, the hypercuboid equivalence partition matrix and corresponding confusion vector of the condition attribute can be used to define the lower and upper approximations of the ith class βi of the decision attribute set .
Let . βi can be approximated using only the information contained within by constructing the A‐lower and A‐upper approximations of βi:
| (7) |
| (8) |
where equivalence relation A is induced from attribute . The boundary region of βi is then defined as
| (9) |
Dependency
Combining (1), (5), and (7), the dependency between condition attribute and decision attribute can be defined as follows:
| (10) |
| (11) |
where . If , depends totally on , if , depends partially on , and if , then does not depend on . The is also termed as the relevance of attribute with respect to class .
Significance
Given two condition attributes and , the c×n hypercuboid equivalence partition matrix corresponding to the set can be calculated from two c×n hypercuboid equivalence partition matrices and as follows:
| (12) |
| (13) |
The change in dependency when an attribute is removed from the set of condition attributes, is a measure of the significance of the attribute. To what extent an attribute is contributing to calculate the dependency on decision attribute can be calculated by the significance of that attribute. The significance of the attribute with respect to the condition attribute set is given by
| (14) |
where . Hence, the higher the change in dependency, the more significant the attribute is. If significance is 0, then the attribute is dispensable.
μHEM: proposed miRNA selection method
Let be the relevance of the miRNA with respect to the class labels and is the significance of the miRNA with respect to another miRNA , where is the set of selected miRNAs. The average relevance of all selected miRNAs is, therefore, given by
| (15) |
while the average significance among the selected miRNAs is as follows
| (16) |
Therefore, the problem of selecting a set of relevant and significant miRNAs from the whole miRNA set is equivalent to maximize and , that is, to maximize the objective function , where
| (17) |
where ω is a weight parameter. To solve the above problem, the following greedy algorithm is used.
1. Initialize .
2. Generate hypercuboid equivalence partition matrix and corresponding confusion vector for each miRNA using (1) and (5), respectively.
3. Calculate the relevance of each miRNA using (11).
4. Select the miRNA as the most relevant miRNA that has highest relevance value . In effect, and .
5. Repeat the following two steps until or the desired number of miRNAs is selected.
6. Repeat the following four steps for each of the remaining miRNAs of .
(a) Generate hypercuboid equivalence partition matrix using (12) between each selected miRNA and each miRNA .
(a) Generate corresponding confusion vector for two miRNAs and using (5).
(a) Calculate the significance of each miRNA with respect to each of the already selected miRNAs of using (14).
(a) Remove from if it has zero significance value with respect to any one of the selected miRNAs. In effect, .
7. From the remaining miRNAs of , select miRNA that maximizes the following condition:
| (18) |
As a result of that, and .
8. Stop.
Computational complexity
The proposed μHEM method has low computational complexity with respect to the number of miRNAs, samples, and classes. Prior to computing the relevance or significance of a miRNA, the hypercuboid equivalence partition matrix and confusion vector for each miRNA are to be generated first, which are carried out in Step 2 of the proposed algorithm. The computational complexity to generate a (c×n) hypercuboid equivalence partition matrix is , where c and n represent the number of classes and objects in the data set, respectively, while the generation of confusion vector has also time complexity. In effect, the computation of the relevance of a miRNA has time complexity. Hence, the total complexity to compute the relevance of m miRNAs, which is carried out in Step 3 of the proposed algorithm, is . The selection of most relevant miRNA from the set of m miRNAs, which is carried out in Step 4, has a complexity .
There is only one loop in Step 5 of the proposed miRNA selection method, which is executed (d−1) times, where d represents the number of selected miRNAs. The complexity to compute the significance of a candidate miRNA with respect to another miRNA has also the complexity . If represents the cardinality of the already selected miRNA set, the total complexity to compute the significance of candidate miRNAs, which is carried out in Step 6, is . The selection of a miRNA from candidate miRNAs by maximizing relevance and significance, which is carried out in Step 7, has a complexity . Hence, the total complexity to execute the loop (d−1) times is .
In effect, the selection of a set of d relevant and significant miRNAs from the whole set of m miRNAs using the proposed hypercuboid equivalence partition matrix based first order incremental search method has an overall computational complexity of as .
B.632+ error rate
In order to minimize the variability and biasedness of derived result, the so‐called B.632+ bootstrap approach [37] is used, which is defined as follows:
| (19) |
where AE denotes the proportion of the original training samples misclassified, termed as apparent error rate, and B1 is the bootstrap error, defined as follows:
| (20) |
where n is the number of original samples and M is the number of bootstrap samples. If the sample xj is not contained in the kth bootstrap sample, then Ijk=1, otherwise 0. Similarly, if xj is misclassified, Qjk=1, otherwise 0. The weight parameter is given by
| (21) |
| (22) |
| (23) |
where c is the number of classes, pi is the proportion of the samples from the ith class, and qi is the proportion of them assigned to the ith class. Also, γ is termed as the no‐information error rate that would apply if the distribution of the class‐membership label of the sample xj did not depend on its feature vector.
Support vector machine
In the current study, the support vector machine (SVM) [43] is used to evaluate the performance of the proposed μHEM algorithm as well as several other feature selection algorithms. The SVM is a margin classifier that draws an optimal hyperplane in the feature vector space; this defines a boundary that maximizes the margin between data samples in different classes, therefore leading to good generalization properties. A key factor in the SVM is to use kernels to construct nonlinear decision boundary. In the present work, linear kernels are used. The source code of the SVM has been downloaded from Library for Support Vector Machines (http://www.csie.ntu.edu.tw/~cjlin/libsvm/).
To compute different types of error rates obtained using the SVM, bootstrap approach is performed on each miRNA expression data set. For each training set, a set of differential miRNAs is first generated, and then the SVM is trained with the selected miRNAs. After the training, the information of miRNAs those were selected for the training set is used to generate test set and then the class label of the test sample is predicted using the SVM. For each data set, fifty top‐ranked miRNAs are selected for the analysis.
In order to calculate the B.632+ error rate, apparent error (AE) is first calculated. This error is obtained when the same original data set is used to train and test a classifier. After that, the B1 error is computed from M bootstrap samples. Finally, the no‐information error (γ) is calculated by randomly perturbing the class label of a given data set. The mutated data set is used for miRNA selection and the selected miRNA set is used to build the SVM. Then, the trained SVM is used to classify the original data set. The error generated by this procedure is known as γ rate. Finally, the B.632+ error rate is computed based on the AE, B1 error, and γ error using (19).
Results and discussions
The performance of the proposed hypercuboid equivalence partition matrix based miRNA selection (μHEM) method is extensively studied and compared with that of some existing feature selection algorithms. The algorithms compared are mutual information based InfoGain [44] and minimum redundancy‐maximum relevance (mRMR) algorithm [45], method proposed by Golub et al. [46], rough set based maximum relevance‐maximum significance (RSMRMS) algorithm [9,28], boosting [47] and lasso [48]. The source code of the proposed μHEM algorithm, written in C language, is available at http://www.isical.ac.in/~bibl/results/mihem/mihem.html. All the algorithms are run in Ubuntu 12.04 LTS having machine configuration Intel Core i7‐2600 CPU @ 3.40GHz × 8, and 16 GB RAM.
Performance analysis of μHEM algorithm
This section presents the performance of the proposed μHEM algorithm on six miRNA data sets with respect to the B.632+ error rate of the SVM.
Optimum value of weight parameter ω
The weight parameter ω in (18) regulates the relative importance of the significance of the candidate miRNA with respect to the already selected miRNAs and the relevance with the output class. If ω is one, only the relevance with the output class is considered for each miRNA selection. The presence of a ω value lower than one is crucial in order to obtain good results. If the significance between miRNAs is not taken into account, selecting the miRNAs with the highest relevance with respect to the output class may tend to produce a set of redundant and insignificant miRNAs that may leave out useful complementary information. On the other hand, if ω is zero, the miRNAs are selected based on their significance values only without considering the relevance of each miRNA. In effect, the selected miRNA set may contain a number of irrelevant miRNAs. Hence, the value of weight parameter ω should be in between zero and one in order to obtain good results, that is, 0<ω<1.
To find out the optimum value of ω for each miRNA data set, the coefficient of variation (Cv) of average significance value is used. It is a measure of relative dispersion and defined as a quotient between standard deviation and mean value. Let the average significance value of the jth selected miRNA with respect to the already selected miRNA set , for a given ω value, be
| (24) |
where represents the set of class labels of the samples and . If μ(ω) and s(ω) represent the mean and standard deviation of the average significance values of d selected miRNAs for a particular value of ω, then the Cv index is defined as follows:
| (25) |
where mean and standard deviation for d selected miRNAs are computed as follows:
| (26) |
| (27) |
The lower value of the Cv index, that is, the higher value of mean μ and lower value of standard deviation s, ensures that the average significance of the set of selected miRNAs is higher. A good miRNA selection method should make the value of Cv index as low as possible.
To find out the optimum value of ω, extensive experimentation is carried out on six miRNA expression data sets. The value of ω is varied from 0.0 to 1.0. In the current study, d=30 and d=50 top‐ranked miRNAs are selected for analysis. Figure 1 presents the variation of the Cv index obtained using the proposed μHEM algorithm for different values of ω on six miRNA data sets. From the results reported in Figure 1, it is seen that as the value of weight parameter ω increases, the Cv index decreases and attains its minimum value at a particular value of ω=ω⋆. After that the Cv index value increases with the increase in the value of ω. Hence, the optimum value of ω for each data set is obtained using the following relation:
Figure 1.
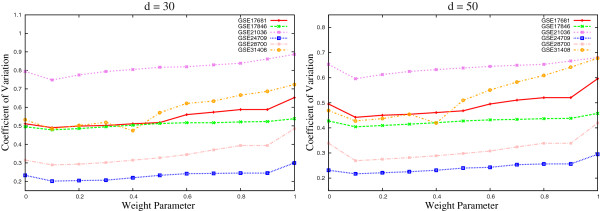
Variation of the Cv index for different values of weight parameter ω.
| (28) |
The optimum values of ω obtained using (28) are 0.1 for GSE17681, GSE17846, GSE21036, GSE24709, and GSE28700, and 0.4 for GSE31408, irrespective of the number of selected miRNAs.
Figures 2 and 3 present the variation of the B.632+ error rate obtained using the proposed μHEM algorithm for different values of ω on GSE17681, GSE17846, GSE21036, and GSE24709 data sets as examples considering d=50. From the results reported in Figures 2 and 3, it is seen that the B.632+ error rate of the SVM decreases with the increase in the number of selected miRNAs, irrespective of the value of ω. Also, the error rate is lower for 0.0<ω<0.5 than both ω=0.0 and 1.0. Similar results can also be seen for both GSE28700 and GSE31408 data sets.
Figure 2.
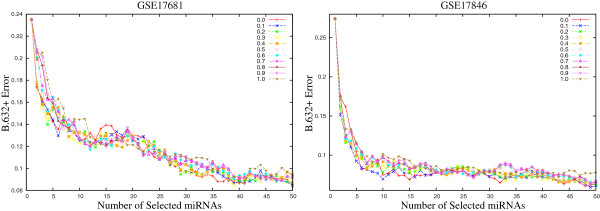
Variation of B.632+ error rate on GSE17681 and GSE17846 data sets for different values of weight parameter ω∈ [ 0.0,1.0] averaged over 50 random splits.
Figure 3.
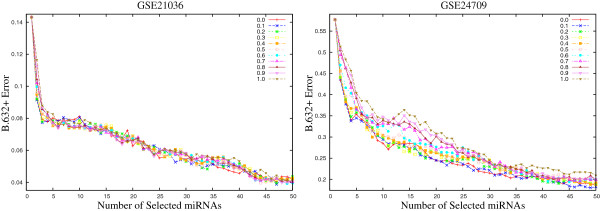
Variation of B.632+ error rate on GSE21036 and GSE24709 data sets for different values of weight parameter ω∈ [ 0.0,1.0] averaged over 50 random splits.
Finally, Table 1 presents the minimal B.632+ error rate of the SVM for different values of weight parameter ω, along with the value of Cv index. For each miRNA data set, the minimum B.632+ error rate is written in italic, while the best Cv index is marked in bold. From the results reported in Table 1, it is seen that the proposed μHEM algorithm achieves its best performance at ω=ω⋆ in five cases out of total six miRNA data sets. Only for GSE28700 data set, the B.632+ error rate at ω=ω⋆ is higher than that of both ω=0.0 and 1.0. The lowest B.632+ error rate is achieved at ω=1.0 for this data set. All the results reported in Figures 1, 2, and 3, and Table 1 establish the importance of both relevance and significance criteria in the proposed μHEM method for selecting differentially expressed miRNAs from a microarray data.
Table 1.
Performance of μHEM algorithm on six miRNA data sets for different values of ω
|
Value |
GSE17681 |
GSE17846 |
GSE21036 |
GSE24709 |
GSE28700 |
GSE31408 |
||||||
|---|---|---|---|---|---|---|---|---|---|---|---|---|
| of ω | B.632+ | Cv | B.632+ | Cv | B.632+ | Cv | B.632+ | Cv | B.632+ | Cv | B.632+ | Cv |
| 0.0 |
0.0854 |
0.4951 |
0.0605 |
0.4275 |
0.0403 |
0.6528 |
0.1863 |
0.2312 |
0.2498 |
0.3388 |
0.0757 |
0.4688 |
| 0.1 |
0.0842 |
0.4421 |
0.0590 |
0.4042 |
0.0388 |
0.5956 |
0.1803 |
0.2171 |
0.2566 |
0.2693 |
0.0753 |
0.4275 |
| 0.2 |
0.0870 |
0.4502 |
0.0623 |
0.4094 |
0.0396 |
0.6124 |
0.1898 |
0.2213 |
0.2660 |
0.2752 |
0.0742 |
0.4368 |
| 0.3 |
0.0851 |
0.4542 |
0.0644 |
0.4148 |
0.0410 |
0.6246 |
0.1878 |
0.2256 |
0.2572 |
0.2818 |
0.0732 |
0.4543 |
| 0.4 |
0.0894 |
0.4611 |
0.0627 |
0.4206 |
0.0420 |
0.6319 |
0.1881 |
0.2312 |
0.2583 |
0.2889 |
0.0672 |
0.4190 |
| 0.5 |
0.0882 |
0.4680 |
0.0640 |
0.4275 |
0.0394 |
0.6384 |
0.1970 |
0.2399 |
0.2587 |
0.2980 |
0.0690 |
0.5097 |
| 0.6 |
0.0882 |
0.4951 |
0.0651 |
0.4319 |
0.0392 |
0.6447 |
0.1940 |
0.2429 |
0.2571 |
0.3079 |
0.0693 |
0.5508 |
| 0.7 |
0.0893 |
0.5105 |
0.0637 |
0.4337 |
0.0402 |
0.6493 |
0.1951 |
0.2536 |
0.2632 |
0.3241 |
0.0683 |
0.5826 |
| 0.8 |
0.0893 |
0.5202 |
0.0636 |
0.4366 |
0.0405 |
0.6528 |
0.1992 |
0.2564 |
0.2649 |
0.3388 |
0.0690 |
0.6088 |
| 0.9 |
0.0893 |
0.5202 |
0.0636 |
0.4380 |
0.0398 |
0.6664 |
0.2002 |
0.2564 |
0.2650 |
0.3388 |
0.0697 |
0.6414 |
| 1.0 | 0.0860 | 0.5958 | 0.0724 | 0.4575 | 0.0410 | 0.6801 | 0.2095 | 0.2950 | 0.2475 | 0.4191 | 0.0693 | 0.6771 |
Optimum number of selected miRNAs
According to Lu et al. [1], unlike with mRNAs, a modest number of miRNAs might be sufficient to classify human cancers. Also, the number of training samples is typically very small compare to the number of miRNAs. Hence, the use of large number of miRNAs in constructing classifier may degrade the prediction capability on test samples [10].
In order to find out the optimum number of selected miRNAs, extensive experimentation is carried out on six microarray data sets. Figure 4 depicts the relevance and average significance values of each of the selected miRNAs for six expression data sets. The results are presented for optimum values of ω considering 100 selected miRNAs. From the results reported in Figure 4, it can be seen that as the number of selected miRNAs increases, both relevance and significance values decrease. Also, the significance value remains constant after selecting forty to forty‐five miRNAs, irrespective of the data sets used. Hence, in the current study, the selected number of miRNAs is set to d=50.
Figure 4.
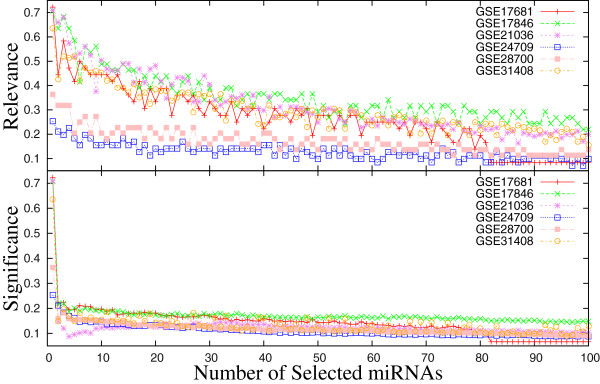
Relevance and significance values of each of the selected miRNAs for different miRNA data sets.
Error rate and execution time
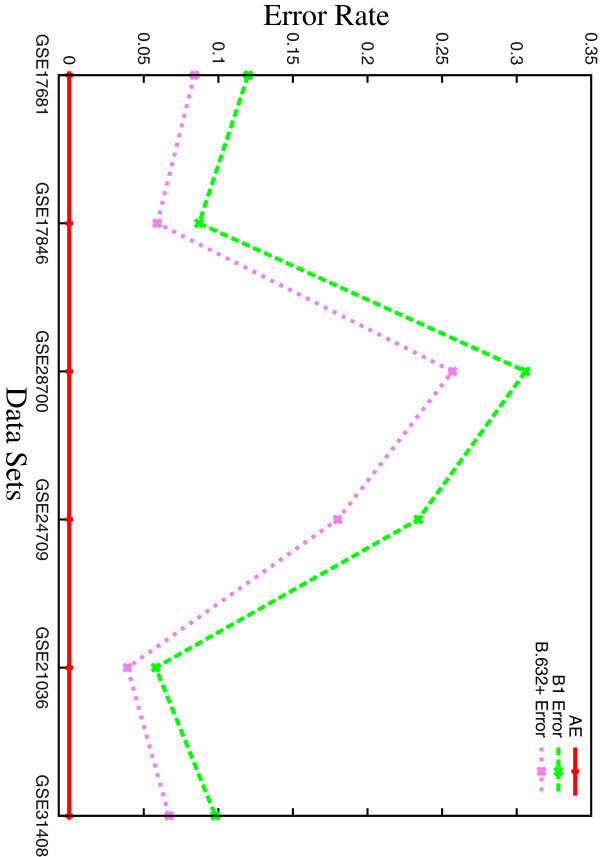
Figure 5 presents the variation of several error rates obtained using the proposed μHEM algorithm for different number of samples. The data sets in x‐axis of Figure 5 are arranged in ascending order of the number of samples present in each data set, that is, the number of samples in GSE17681, GSE17846, GSE28700, GSE24709, GSE21036, and GSE31408 data are 36, 41, 44, 71, 141, and 148, respectively.
Figure 5.
Variation of several error rates obtained using μHEM algorithm for different number of samples.
From all the results reported in Figure 5, it is seen that different error rates such as AE, B1, and B.632+ do not depend on the number of samples present in the data set, rather, they depend on the distribution of the samples in different classes or categories. For example, although the number of samples in GSE17846 and GSE28700 data sets is almost equal, that is, 41 and 44, respectively, there is a significant difference in errors for these two data sets. The B.632+ errors for GSE17846 and GSE28700 data sets are 0.059 and 0.257, respectively. On the other hand, the B.632+ errors for GSE17846 data set with 41 samples and GSE31408 data set with 148 samples are 0.059 and 0.067, respectively.
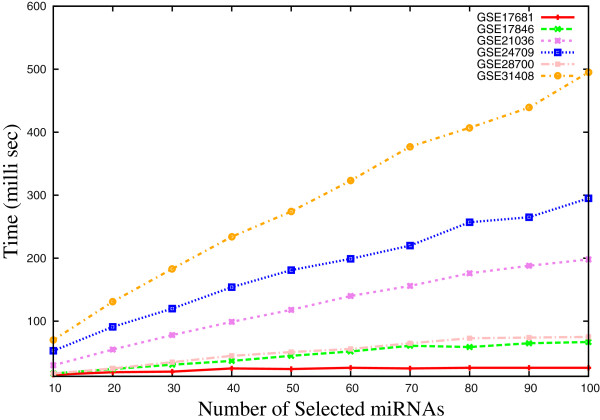
Figure 6 reports the execution time of the proposed μHEM algorithm for different number of selected miRNAs. Results are presented for all six miRNA data sets by varying the number of selected miRNAs from 10 to 100. From all the results reported in Figure 6, it can be seen that the execution time of the proposed algorithm is directly proportional to the number of selected miRNAs, total number of miRNAs and samples.
Figure 6.
Execution time of μHEM algorithm on six data sets for different number of selected miRNAs.
Importance of B.632+ error rate
This section establishes the importance of using B.632+ error rate over other types of errors such as apparent error (AE), no‐information error rate (γ), and bootstrap error (B1). Different types of errors on each miRNA expression data set are calculated using the SVM for the proposed method. All the results are presented for the optimum values of ω considering d=50. Figures 7 and 8 represent various types of errors obtained by the proposed algorithm on GSE17681, GSE17846, GSE21036, and GSE24709 data sets as examples. From Figures 7 and 8, it is seen that different types of errors decrease as the number of selected miRNAs increases. Similar results are also found for both GSE28700 and GSE31408 data sets. For all six data sets, the AE attains consistently lowest value, while γ has highest value. On the other hand, the B1 has smaller error rate than γ but it is higher than the AE. Moreover, the B.632+ estimate has smaller error rate than the B1 but higher than the AE.
Figure 7.
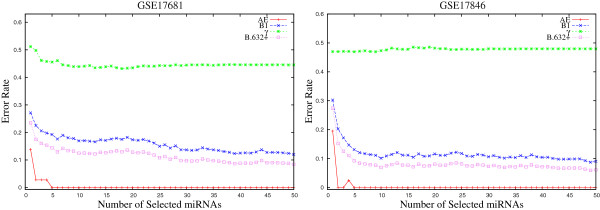
Different error rates of the proposed algorithm on GSE17681 and GSE17846 data sets obtained using the SVM averaged over 50 random splits.
Figure 8.
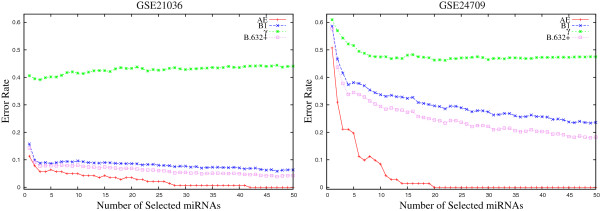
Different error rates of the proposed algorithm on GSE21036 and GSE24709 data sets obtained using the SVM averaged over 50 random splits.
Table 2 reports the minimum values of different errors, along with the number of miRNAs required to attain these values. From all the results reported in this table, it can be seen that the B.632+ estimator corrects the upward bias of B1 and downward bias of AE. Also, it puts more weight on B1 in situation where the amount of overfitting as measured by (B1−AE) is relatively large. It thus is applicable in the present context where the prediction rule generated by the SVM may be overfitted.
Table 2.
Comparative analysis of different types of errors for μHEM algorithm
|
Microarray |
AE |
B1 Error |
γ Error |
B.632+ Error |
||||
|---|---|---|---|---|---|---|---|---|
| data sets | Error | miRNAs | Error | miRNAs | Error | miRNAs | Error | miRNAs |
|
GSE17681 |
0.000 |
5 |
0.120 |
50 |
0.432 |
18 |
0.084 |
50 |
|
GSE17846 |
0.000 |
2 |
0.087 |
49 |
0.469 |
5 |
0.059 |
49 |
|
GSE21036 |
0.000 |
42 |
0.058 |
47 |
0.391 |
3 |
0.039 |
47 |
|
GSE24709 |
0.000 |
20 |
0.234 |
49 |
0.462 |
22 |
0.180 |
49 |
|
GSE28700 |
0.000 |
25 |
0.306 |
4 |
0.463 |
37 |
0.257 |
4 |
| GSE31408 | 0.000 | 44 | 0.098 | 2 | 0.383 | 10 | 0.067 | 50 |
Comparative performance analysis
This section compares the performance of the proposed μHEM algorithm with that of InfoGain [44], mRMR algorithm [45], method proposed by Golub et al. [46], RSMRMS algorithm [9], boosting [47], and lasso [48]. Table 3 and Figures 9, 10, 11, 12, 13, and 14 present different error rates obtained by various feature selection algorithms on six miRNA expression data sets.
Table 3.
Comparative performance analysis of different algorithms
|
Microarray |
Algorithms |
Apparent error |
B1 Error |
Gap estimate |
B.632+ Error |
||||
|---|---|---|---|---|---|---|---|---|---|
| data sets | /Methods | Error | miRNAs | Error | miRNAs | Error | miRNAs | Error | miRNAs |
| |
Golub et al. |
0.000 |
19 |
0.194 |
32 |
0.258 |
32 |
0.146 |
32 |
| |
Lasso |
0.056 |
2 |
0.266 |
2 |
0.125 |
2 |
0.229 |
2 |
| |
Boosting |
0.000 |
5 |
0.113 |
10 |
0.090 |
10 |
0.094 |
10 |
|
GSE17681 |
InfoGain |
0.000 |
6 |
0.154 |
21 |
0.290 |
21 |
0.111 |
21 |
| |
mRMR |
0.000 |
10 |
0.175 |
28 |
0.267 |
28 |
0.129 |
28 |
| |
RSMRMS |
0.000 |
8 |
0.142 |
24 |
0.299 |
24 |
0.102 |
24 |
| |
μHEM |
0.000 |
5 |
0.120 |
50 |
0.325 |
50 |
0.084 |
50 |
| |
Golub et al. |
0.000 |
6 |
0.116 |
48 |
0.363 |
48 |
0.081 |
48 |
| |
Lasso |
0.024 |
3 |
0.102 |
3 |
0.241 |
2 |
0.079 |
3 |
| |
Boosting |
0.000 |
4 |
0.037 |
9 |
0.170 |
9 |
0.025 |
9 |
|
GSE17846 |
InfoGain |
0.000 |
7 |
0.093 |
37 |
0.387 |
37 |
0.063 |
37 |
| |
mRMR |
0.000 |
3 |
0.101 |
48 |
0.379 |
48 |
0.069 |
48 |
| |
RSMRMS |
0.000 |
2 |
0.093 |
39 |
0.386 |
39 |
0.064 |
39 |
| |
μHEM |
0.000 |
2 |
0.087 |
49 |
0.392 |
49 |
0.059 |
49 |
| |
Golub et al. |
0.000 |
35 |
0.069 |
48 |
0.368 |
39 |
0.047 |
48 |
| |
Lasso |
0.043 |
5 |
0.061 |
6 |
0.074 |
6 |
0.057 |
6 |
| |
Boosting |
0.099 |
3 |
0.107 |
3 |
0.074 |
3 |
0.104 |
3 |
|
GSE21036 |
InfoGain |
0.000 |
39 |
0.073 |
50 |
0.372 |
44 |
0.049 |
50 |
| |
mRMR |
0.000 |
19 |
0.064 |
49 |
0.376 |
50 |
0.043 |
49 |
| |
RSMRMS |
0.050 |
5 |
0.089 |
5 |
0.328 |
5 |
0.075 |
5 |
| |
μHEM |
0.000 |
42 |
0.058 |
47 |
0.386 |
47 |
0.039 |
47 |
| |
Boosting |
0.099 |
8 |
0.211 |
8 |
0.057 |
8 |
0.192 |
8 |
| |
InfoGain |
0.000 |
26 |
0.257 |
45 |
0.218 |
46 |
0.203 |
45 |
|
GSE24709 |
mRMR |
0.000 |
24 |
0.245 |
50 |
0.229 |
50 |
0.191 |
50 |
| |
RSMRMS |
0.141 |
11 |
0.402 |
11 |
0.123 |
2 |
0.366 |
11 |
| |
μHEM |
0.000 |
20 |
0.234 |
49 |
0.241 |
49 |
0.180 |
49 |
| |
Golub et al. |
0.000 |
27 |
0.300 |
27 |
0.173 |
3 |
0.248 |
27 |
| |
Lasso |
0.045 |
4 |
0.251 |
4 |
0.118 |
4 |
0.215 |
4 |
| |
Boosting |
0.023 |
7 |
0.191 |
8 |
0.131 |
4 |
0.160 |
8 |
|
GSE28700 |
InfoGain |
0.000 |
35 |
0.309 |
8 |
0.159 |
8 |
0.271 |
21 |
| |
mRMR |
0.000 |
21 |
0.333 |
49 |
0.140 |
7 |
0.285 |
49 |
| |
RSMRMS |
0.023 |
34 |
0.331 |
19 |
0.140 |
15 |
0.285 |
19 |
| |
μHEM |
0.000 |
25 |
0.306 |
4 |
0.194 |
4 |
0.257 |
4 |
| |
Golub et al. |
0.000 |
36 |
0.073 |
1 |
0.364 |
1 |
0.069 |
1 |
| |
Lasso |
0.061 |
3 |
0.072 |
4 |
0.184 |
1 |
0.068 |
4 |
| |
Boosting |
0.081 |
2 |
0.087 |
2 |
0.085 |
1 |
0.085 |
2 |
|
GSE31408 |
InfoGain |
0.007 |
20 |
0.090 |
9 |
0.331 |
1 |
0.077 |
27 |
| |
mRMR |
0.000 |
37 |
0.094 |
6 |
0.331 |
1 |
0.074 |
6 |
| |
RSMRMS |
0.061 |
2 |
0.086 |
6 |
0.336 |
2 |
0.077 |
6 |
| μHEM | 0.000 | 44 | 0.098 | 2 | 0.354 | 50 | 0.067 | 50 | |
Figure 9.
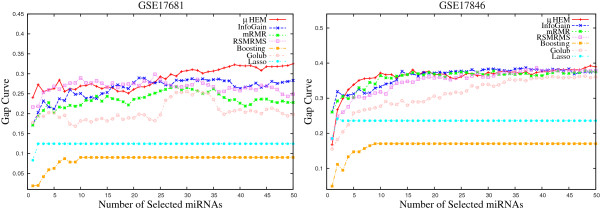
Gap curve obtained using different methods on GSE17681 and GSE17846 data sets averaged over 50 random splits.
Figure 10.
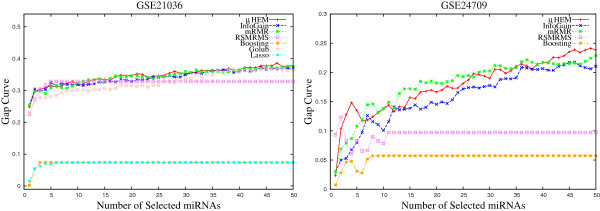
Gap curve obtained using different methods on GSE21036 and GSE24709 data sets averaged over 50 random splits.
Figure 11.
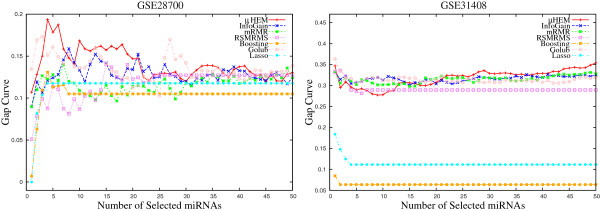
Gap curve obtained using different methods on GSE28700 and GSE31408 data sets averaged over 50 random splits.
Figure 12.
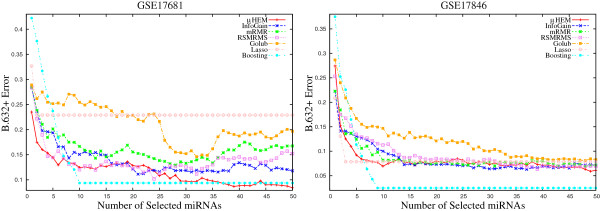
B.632+ errors of the SVM obtained using different methods on GSE17681 and GSE17846 data sets averaged over 50 random splits.
Figure 13.
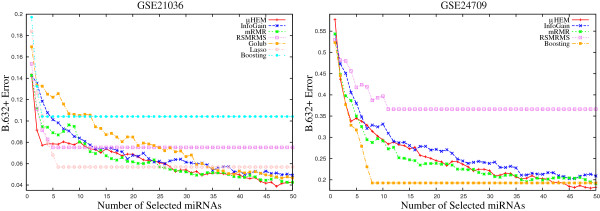
B.632+ errors of the SVM obtained using different methods on GSE21036 and GSE24709 data sets averaged over 50 random splits.
Figure 14.
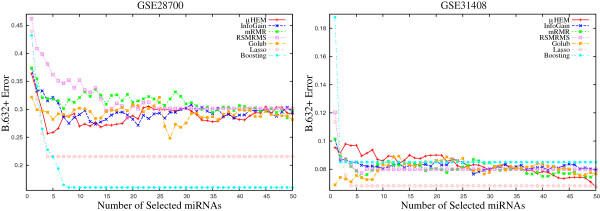
B.632+ errors of the SVM obtained using different methods on GSE28700 and GSE31408 data sets averaged over 50 random splits.
AE and B1 error
Table 3 compares the best performance of different feature selection algorithms based on the error rate of the SVM. From the results reported in Table 3, it is seen that the best AE for each miRNA data set is same for most of the algorithms. Both proposed μHEM algorithm and mRMR method attain the best AE value for all data sets, while the method proposed by Golub et al. and InfoGain achieve it for five data sets and boosting and RSMRMS method attain this value on two data sets. However, the μHEM achieves the best AE value with lower number of selected miRNAs than that obtained by other methods on GSE17681, GSE17846, and GSE24709 data sets, while mRMR method attains it for GSE21036 and GSE28700 data sets and the method proposed by Golub et al. on GSE31408 data set. On the other hand, the boosting method attains lowest B1 error rate in four cases out of total six data sets, while the μHEM method and lasso achieve it only for GSE21036 and GSE31408 data sets, respectively.
Gap estimate
However, according to Efron and Tibshirani [37], the bootstrap approach (B1) overestimates the error. In this regard, the Gap function [49] is generally used to know whether the obtained B1 error is smaller than that would be expected by chance, if the distribution of the class‐membership label of the sample did not depend on its feature vector. The Gap function represents the difference between no‐information error (γ) and bootstrap error (B1), and is defined by
| (29) |
The larger value of Gap function indicates that the obtained or observed B1 error is significantly lower than that of expected by chance. Figures 9, 10, and 11 depict the gap curves, which highlight the difference between γ and B1 errors obtained using different algorithms on six miRNA data sets. From the results reported in these figures, it can be found that the Gap estimate increases with the increase in the number of selected miRNAs, irrespective of the algorithms and data sets used. Also, the Gap function always achieves significantly higher values for the proposed μHEM algorithm, while for both boosting and lasso, the gap estimate is very low. Table 3 compares the best values of the Gap function obtained using different algorithms. All the results reported here confirm that the proposed algorithm attains highest values of Gap function in five cases, while the method proposed by Golub et al. achieves it only for GSE31408 data set.
B.632+ error
Finally, the performance of different algorithms is compared with respect to the B.632+ error. According to Efron and Tibshirani [37], the B.632+ error corrects the upward bias in bootstrap error with the downwardly biased apparent error. Figures 12, 13, and 14 report the variation of the B.632+ error for different number of selected miRNAs obtained by several feature selection algorithms on six miRNA expression data sets. From the results reported in Table 3 and Figures 12, 13, and 14, it can be seen that both boosting and lasso are useful to select a very small number of miRNAs, but not always appropriate to achieve lowest B.632+ error rate. The μHEM algorithm attains lowest B.632+ error rate of the SVM classifier for GSE17681, GSE21036, GSE24709, and GSE31408 data sets, while boosting achieves it only on GSE17846 and GSE28700 data sets. The better performance of the proposed μHEM method is achieved due to the fact that it provides an efficient way to compute degree of dependency of class labels on feature set in approximation spaces. In effect, a reduced set of relevant and significant miRNAs is being obtained using the proposed μHEM method.
Execution time
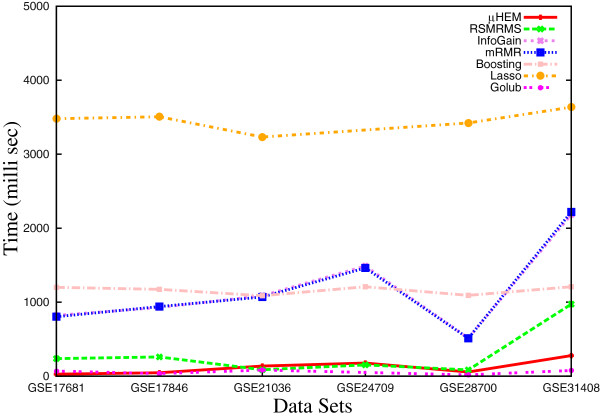
Moreover, Figure 15 compares the execution time of different algorithms for six data sets. From the results reported in Figure 15, it can also be seen that the execution time of the proposed algorithm is significantly lower than that of most of the methods, irrespective of the data sets used. However, the execution time of the method proposed by Golub et al. is slightly lower than that of the proposed method. The lower execution time of the proposed algorithm is achieved due to its low computational complexity to compute the relevance and significance with respect to the number of selected miRNAs, total number of miRNAs and samples in microarray data set.
Figure 15.
Execution time of different algorithms on six miRNA expression data sets.
Biological significance analysis
This section presents the biological significance of some miRNAs those are selected by the proposed μHEM algorithm for GSE21036 data set as an example. The manually curated database, termed as miR2Disease [50], is used here to biologically validate the results obtained by the μHEM algorithm. This database aims at providing a comprehensive resource of miRNA deregulation in various human diseases.
In GSE21036 data set, miRNA expression profiling has been done to understand the role of miRNAs that are responsible for the genesis and progression of prostate cancer [40]. The μHEM algorithm selects a set of differentially expressed miRNAs from each bootstrap sample of GSE21036 data set. A set of nine miRNAs, consisting of hsa‐miR‐145, hsa‐miR‐25, hsa‐miR‐153, hsa‐miR‐143, hsa‐miR‐19a, hsa‐miR‐96, hsa‐miR‐663, hsa‐miR‐20a, and hsa‐miR‐182, is identified from all bootstrap samples of GSE21036 data set. Among them, four miRNAs, namely, hsa‐miR‐19a, hsa‐miR‐20a, hsa‐miR‐663, and hsa‐miR‐182, are identified by the μHEM algorithm only, not by other feature selection algorithms.
One of the distinct characteristics of prostate cancer is over‐expression of the ERG proto‐oncogene. Several independent target prediction methods have indicated that the untranslated region of the ERG mRNA is a potential target of hsa‐miR‐145. The hsa‐miR‐145 is consistently down‐regulated in prostate cancer. In [51], it has been shown that the ERG untranslated region is a regulative target of hsa‐miR‐145 in vitro. From this observation it is suggested that the miRNA hsa‐miR‐145 leads to progression of prostate cancer. The down regulation of hsa‐miR‐145 is also mentioned in [52,53].
In [54], it has been shown that the hsa‐miR‐20a is over expressed in prostate cancer. Moreover, Sylvestre et al. described an over expression of hsa‐miR‐20a in the human prostate cancer cell line PC3 using PCR [55]. Volinia et al. recorded an up‐regulation of hsa‐miR‐20a in prostate cancer tissue using a microarray assay [56]. The identified function of hsa‐miR‐20a is the modulation of the translation of the E2F2 and E2F3 mRNAs via binding sites in their ‐untranslated region [55], which supports the oncogenic behavior of hsa‐miR‐20a. The over expression of hsa‐miR‐20a reduces apoptosis in the prostate cancer cell line [55]. As suggested in [56] and miR2Disease, the hsa‐miR‐25 is also up‐regulated in prostate cancer.
In [57,58], it is shown that hsa‐miR‐143 expression is clearly down‐regulated during prostate cancer progression. ERK5 is known to promote cell growth and proliferation in response to growth factors and tyrosine kinase activation. Therefore, persistent decreased levels of hsa‐miR‐143 in cancer cells may be directly involved in carcinogenesis through activation of the mitogen‐activated protein kinase (MAPK) cascade via ERK5. Taken together these findings suggest that hsa‐miR‐143 could be a tumor suppressor and a potential novel diagnostic or prognostic marker in prostate cancer.
According to Hirata et al. [59], the hsa‐miR‐182 regulates FOXF2, RECK and MTSS1 genes and is therefore over expressed in prostate cancer. They have also shown experimentally that these three genes are potential targets of the hsa‐miR‐182 and play important role in progression of prostate cancer. Another miRNA, hsa‐miR‐96, is shown to be over expressed in prostate cancer as mentioned in [60].
Conclusion
The contribution of the paper is two fold, namely,
1. the development of the μHEM algorithm for miRNA selection, integrating the merits of rough sets and hypercuboid equivalence partition matrix; and
2. demonstrating the effectiveness of the proposed algorithm, along with a comparison with other algorithms, on several real life miRNA expression data sets.
The concept of hypercuboid equivalence partition matrix is found to be successful in selecting relevant and significant miRNAs of real valued microarray data sets. This formulation is geared towards maximizing the utility of rough sets and hypercuboid approach with respect to insilico identification of differentially expressed miRNAs. The results obtained on six miRNA data sets demonstrate that the proposed method can bring a remarkable improvement on miRNA selection problem, and therefore, it can be a promising alternative to existing models for prediction of class labels of samples. All the results reported in this paper demonstrate the feasibility and effectiveness of the proposed method. The new method is capable of identifying effective miRNAs that may contribute to revealing underlying etiology of a disease, providing a useful tool for exploratory analysis of miRNA data.
Availability and requirements
Project name:μHEM (Differentially expressed microRNA selection method)Project home page: www.isical.ac.in/ ∼bibl/results/mihem/mihem.htmlOperating system: developed on Linux (Ubuntu 12.04 LTS)Programming language: C
Competing interests
The authors declare that they have no competing interests.
Authors’ contributions
SP designed the current work. PM developed the concept of rough set based miRNA selection algorithm. SP implemented it and applied on different miRNA expression data sets. Both SP and PM analyzed the results and prepared the manuscript. Both authors read and approved the final manuscript.
Contributor Information
Sushmita Paul, Email: sushmita_t@isical.ac.in.
Pradipta Maji, Email: pmaji@isical.ac.in.
Acknowledgements
This work is partially supported by the Indian National Science Academy, New Delhi (grant no. SP/YSP/68/2012). The work was done when one of the authors, S. Paul, was a Senior Research Fellow of Council of Scientific and Industrial Research, Government of India.
References
- Lu J, Getz G, Miska EA, Saavedra EA, Lamb J, Peck D, Cordero AS, Ebert BL, Mak RH, Ferrando AA, Downing JR, Jacks T, Horvitz HR, Golub TR. MicroRNA expression profiles classify human cancers. Nat Lett. 2005;435(9):834–838. doi: 10.1038/nature03702. [DOI] [PubMed] [Google Scholar]
- Budhu A, Ji J, Wang XW. The clinical potential of microRNAs. J Hematol Oncol. 2010;3(37):1–7. doi: 10.1186/1756-8722-3-37. [DOI] [PMC free article] [PubMed] [Google Scholar]
- Lehmann U, Streichert T, Otto B, Albat C, Hasemeier B, Christgen H, Schipper E, Hille U, Kreipe HH, Langer F. Identification of differentially expressed microRNAs in human male breast cancer. BMC Bioinformatics. 2010;10:1–9. doi: 10.1186/1471-2407-10-109. [DOI] [PMC free article] [PubMed] [Google Scholar]
- Blenkiron C, Goldstein LD, Thorne NP, Spiteri I, Chin SF, Dunning MJ, Barbosa‐Morais NL, Teschendorff AE, Green AR, Ellis IO, Tavaré S, Caldas C, Miska EA. MicroRNA expression profiling of human breast cancer identifies new markers of tumor subtype. Genome Biol. 2007;8:1–16. doi: 10.1186/gb-2007-8-10-r214. [DOI] [PMC free article] [PubMed] [Google Scholar]
- Chen Y, Stallings RL. Differential patterns of microRNA expression in neuroblastoma are correlated with prognosis, differentiation, and apoptosis. Cancer Res. 2007;67:976–983. doi: 10.1158/0008-5472.CAN-06-3667. [DOI] [PubMed] [Google Scholar]
- Guo J, Miao Y, Xiao B, Huan R, Jiang Z, Meng D, Wang Y. Differential expression of microRNA species in human gastric cancer versus non‐tumorous tissues. J Gastroenterol Hepatol. 2009;24:652–657. doi: 10.1111/j.1440-1746.2008.05666.x. [DOI] [PubMed] [Google Scholar]
- Schrauder MG, Strick R, Schulz‐Wendtland R, Strissel PL, Kahmann L, Loehberg CR, Lux MP, Jud SM, Hartmann A, Hein A, Bayer CM, Bani MR, Richter S, Adamietz BR, Wenkel E, Rauh C, Beckmann MW, Fasching PA. Circulating micro‐RNAs as potential blood‐based markers for early stage breast cancer detection. PLoS ONE. 2012;7:1–9. doi: 10.1371/journal.pone.0029770. [DOI] [PMC free article] [PubMed] [Google Scholar]
- Zhao H, Shen J, Medico L, Wang D, Ambrosone CB, Liu S. A pilot study of circulating miRNAs as potential Biomarkers of early stage breast cancer. PLoS ONE. 2010;5(10):1–12. doi: 10.1371/journal.pone.0013735. [DOI] [PMC free article] [PubMed] [Google Scholar]
- Paul S, Maji P. Rough sets for Insilico identification of differentially expressed miRNAs. Int J Nanomedicine. 2013;8:1–12. doi: 10.2217/nnm.12.179. [DOI] [PMC free article] [PubMed] [Google Scholar]
- Ambroise C, McLachlan GJ. Selection bias in gene extraction on the basis of microarray gene‐expression data. Proc Natl Acad Sci, USA. 2002;99(10):6562–6566. doi: 10.1073/pnas.102102699. [DOI] [PMC free article] [PubMed] [Google Scholar]
- Iorio MV, Visone R, Leva GD, Donati V, Petrocca F, Casalini P, Taccioli C, Volinia S, Liu CG, Alder H, Calin GA, Menard S, Croce CM. MicroRNA signatures in human ovarian cancer. Cancer Res. 2007;67(18):8699–8707. doi: 10.1158/0008-5472.CAN-07-1936. [DOI] [PubMed] [Google Scholar]
- Li S, Chen X, Zhang H, Liang X, Xiang Y, Yu C, Zen K, Li Y, Zhang CY. Differential expression of microRNAs in mouse liver under aberrant energy metabolic status. J Lipid Res. 2009;50:1756–1765. doi: 10.1194/jlr.M800509-JLR200. [DOI] [PMC free article] [PubMed] [Google Scholar]
- Nasser S, Ranade AR, Sridhart S, Haney L, Korn RL, Gotway MB, Weiss GJ, Kim S. Proceedings of the 3rd IEEE International Conference on Bioinformatics and Biomedicine. Washington; 2009. IdentifyingmiRNA and imaging features associated with metastasis of lung cancer to the brain; pp. 246–251. [Google Scholar]
- Ortega FJ, Moreno‐Navarrete JM, Pardo G, Sabater M, Hummel M, Ferrer A, Rodriguez‐Hermosa JI, Ruiz B, Ricart W, Peral B, Real JMF. MiRNA expression profile of human subcutaneous adipose and during adipocyte differentiation. PLoS ONE. 2010;5(2):1–9. doi: 10.1371/journal.pone.0009022. [DOI] [PMC free article] [PubMed] [Google Scholar]
- Pereira PM, Marques JP, Soares AR, Carreto L, Santos MAS. MicroRNA expression variability in human cervical tissues. PLoS ONE. 2010;5(7):1–12. doi: 10.1371/journal.pone.0011780. [DOI] [PMC free article] [PubMed] [Google Scholar]
- Raponi M, Dossey L, Jatkoe T, Wu X, Chen G, Fan H, Beer DG. MicroRNA classifiers for predicting prognosis of squamous cell lung cancer. Cancer Res. 2009;69(14):5776–5783. doi: 10.1158/0008-5472.CAN-09-0587. [DOI] [PubMed] [Google Scholar]
- Arora S, Ranade AR, Tran NL, Nasser S, Sridhar S, Korn RL, Ross JTD, Dhruv H, Foss KM, Sibenaller Z, Ryken T, Gotway MB, Kim S, Weiss GJ. MicroRNA‐328 is associated with Non‐Small Cell Lung Cancer (NSCLC) brain metastasis and mediates NSCLC migration. Int J Cancer. 2011;129(11):2621–2631. doi: 10.1002/ijc.25939. [DOI] [PMC free article] [PubMed] [Google Scholar]
- McIver AD, East P, Mein CA, Cazier JB, Molloy G, Chaplin T, Lister TA, Young BD, Debernardi S. Distinctive patterns of microRNA expression associated with karyotype in acute myeloid leukaemia. PLoS ONE. 2008;3(5):1–8. doi: 10.1371/journal.pone.0002141. [DOI] [PMC free article] [PubMed] [Google Scholar]
- Wang C, Yang S, Sun G, Tang X, Lu S, Neyrolles O, Gao Q. Comparative miRNA expression profiles in individuals with latent and active tuberculosis. PLoS ONE. 2011;6(10):1–11. doi: 10.1371/journal.pone.0025832. [DOI] [PMC free article] [PubMed] [Google Scholar]
- Zhu M, Yi M, Kim CH, Deng C, Li Y, Medina D, Stephens RM, Green JE. Integrated miRNA and mRNA expression profiling of mouse mammary tumor models identifies miRNA signatures associated with mammary tumor lineage. Gen Biol. 2011;12:1–16. doi: 10.1186/gb-2011-12-8-r77. [DOI] [PMC free article] [PubMed] [Google Scholar]
- Xu R, Xu J, Wunsch DC. MicroRNA expression profile based cancer classification using default ARTMAP. Neural Netw. 2009;22:774–780. doi: 10.1016/j.neunet.2009.06.018. [DOI] [PubMed] [Google Scholar]
- Pawlak Z. Rough Sets: Theoretical Aspects of Resoning About Data. Dordrecht: Kluwer; 1991. [Google Scholar]
- Maji P, Pal SK. Rough‐Fuzzy Pattern Recognition: Applications in Bioinformatics and Medical Imaging. New Jersey: Wiley‐IEEE Computer Society Press; 2012. [Google Scholar]
- Fang J, Busse JWG. Proceedings of the 1st International Conference on Rough Sets and Knowledge Technology. Berlin, Heidelberg: Springer; 2006. Mining of microRNA expression data: a rough set approach; pp. 758–765. [Google Scholar]
- Maji P. Fuzzy‐rough supervised attribute clustering algorithm and classification of microarray data. IEEE Tran Syst, Man, Cybern, Part B: Cybern. 2011;41:222–233. doi: 10.1109/TSMCB.2010.2050684. [DOI] [PubMed] [Google Scholar]
- Maji P, Pal SK. Fuzzy‐rough sets for information measures and selection of relevant genes from microarray data. IEEE Trans Syst, Man, and Cybern, Part B: Cybern. 2010;40(3):741–752. doi: 10.1109/TSMCB.2009.2028433. [DOI] [PubMed] [Google Scholar]
- Maji P, Paul S. Proceedings of the 5th IEEE International Conference on Bioinformatics and Biomedicine. Atlanta; 2011. Microarray time‐series data clustering using rough‐fuzzy C‐means algorithm; pp. 269–272. [Google Scholar]
- Maji P, Paul S. Rough set based maximum relevance‐maximum significance criterion and gene selection from microarray data. Int J Approximate Reasoning. 2011;52(3):408–426. doi: 10.1016/j.ijar.2010.09.006. [DOI] [Google Scholar]
- Maji P, Paul S. Rough‐fuzzy clustering for grouping functionally similar genes from microarray data. IEEE/ACM Trans Comput Biol Bioinformatics. 2013. doi:10.1109/TCBB.2012.103. [DOI] [PubMed]
- Paul S, Maji P. Proceedings of the 6th IEEE International Conference on Bioinformatics and Biomedicine. Philadelphia; 2012. Robust RFCM algorithm for identification of co‐expressed miRNAs; pp. 520–523. [Google Scholar]
- Paul S, Maji P. Proceedings of the 6th IEEE International Conference on Bioinformatics and Biomedicine Workshops: Nanoinformatics for Biomedicine. Philadelphia; 2012. Rough sets and support vector machine for selecting differentially expressed miRNAs; pp. 864–871. [Google Scholar]
- Slezak D. Proceedings of the Frontiers in the Convergence of Bioscience and Information Technologies. Cheju Island: IEEE Computer Society; 2007. Rough sets and few‐objects‐many‐attributes problem: the case study of analysis of gene expression data sets; pp. 233–240. [Google Scholar]
- Slezak D, Wroblewski J. Proceedings of the 2nd International Conference on Rough Sets and Knowledge Technology. Berlin, Heidelberg: Springer; 2007. Roughfication of numeric decision tables: the case study of gene expression data; pp. 316–323. [Google Scholar]
- Valdes JJ, Barton AJ. Proceedings of the 1st International Conference on Rough Sets and Knowledge Technology. Berlin: Springer; 2006. Relevant attribute discovery in high dimensional data: application to breast cancer gene expressions; pp. 482–489. [Google Scholar]
- Maji P, Paul S. Robust rough‐fuzzy C‐means algorithm: design and applications in coding and non‐coding RNA expression data clustering. Fundam Informaticae. 2013;124(1–2):153–174. [Google Scholar]
- Wei JM, Wang SQ, Yuan XJ. Ensemble rough hypercuboid approach for classifying cancers. IEEE Trans Knowl Data Eng. 2010;22(3):381–391. [Google Scholar]
- Efron B, Tibshirani R. Improvements on cross‐validation: the.632+ bootstrap method. J Am Stat Assoc. 1997;92(438):548–560. [Google Scholar]
- Keller A, Leidinger P, Wendschlag A, Scheffler M, Meese E, Wucherpfennig F, Huwer H, Borries A. miRNAs in lung cancer ‐ studying complex fingerprints in patient’s blood cells by microarray experiments. BMC Cancer. 2009;9:353. doi: 10.1186/1471-2407-9-353. [DOI] [PMC free article] [PubMed] [Google Scholar]
- Keller A, Leidinger P, Lange J, Borries A, Schroers H, Scheffler M, Lenhof HP, Ruprecht K, Meese E. Multiple sclerosis: MicroRNA expression profiles accurately differentiate patients with relapsing‐remitting disease from healthy controls. PLoS ONE. 2009;4(10):e7440. doi: 10.1371/journal.pone.0007440. [DOI] [PMC free article] [PubMed] [Google Scholar]
- Taylor BS, Schultz N, Hieronymus H, Gopalan A, Xiao Y, Carver BS, Arora VK, Kaushik P, Cerami E, Reva B, Antipin Y, Mitsiades N, Landers T, Dolgalev I, Major JE, Wilson M, Socci ND, Lash AE, Heguy A, Eastham JA, Scher HI, Reuter VE, Scardino PT, Sander C, Sawyers CL, Gerald WL. Integrative genomic profiling of human prostate cancer. Cancer Cell. 2010;18:11–22. doi: 10.1016/j.ccr.2010.05.026. [DOI] [PMC free article] [PubMed] [Google Scholar]
- Tseng CW, Lin CC, Chen CN, Huang HC, Juan HF. Integrative network analysis reveals active microRNAs and their functions in gastric cancer. BMC Syst Biol. 2011;5:99. doi: 10.1186/1752-0509-5-99. [DOI] [PMC free article] [PubMed] [Google Scholar]
- Ralfkiaer U, Hagedorn PH, Bangsgaard N, Lovendorf MB, Ahler CB, Svensson L, Kopp KL, Vennegaard MT, Lauenborg B, Zibert JR, Krejsgaard T, Bonefeld CM, Sokilde R, Gjerdrum LM, Labuda T, Mathiesen AM, Gronbaek K, Wasik MA, Sokolowska‐Wojdylo M, Queille‐Roussel C, Gniadecki R, Ralfkiaer E, Geisler C, Litman T, Woetmann A, Glue C, Ropke MA, Skov L, Odum N. Diagnostic microRNA profiling in cutaneous T‐cell lymphoma (CTCL) Blood. 2011;118(22):5891–5900. doi: 10.1182/blood-2011-06-358382. [DOI] [PMC free article] [PubMed] [Google Scholar]
- Vapnik V. The Nature of Statistical Learning Theory. New York: Springer‐Verlag; 1995. [Google Scholar]
- Quinlan JR. C4.5: Programs for Machine Learning. CA: Morgan Kaufmann; 1993. [Google Scholar]
- Ding C, Peng H. Minimum redundancy feature selection from Microarray gene expression data. J Bioinformatics Comput Biol. 2005;3(2):185–205. doi: 10.1142/S0219720005001004. [DOI] [PubMed] [Google Scholar]
- Golub TR, Slonim DK, Tamayo P, Huard C, Gaasenbeek M, Mesirov JP, Coller H, Loh ML, Downing JR, Caligiuri MA, Bloomfield CD, Lander ES. Molecular classification of cancer: class discovery and class prediction by gene expression monitoring. Science. 1999;286:531–537. doi: 10.1126/science.286.5439.531. [DOI] [PubMed] [Google Scholar]
- Buelmann P, Yu B. Boosting with the L2 loss: regression and classification. J Am Stat Assoc. 2003;98:324–339. doi: 10.1198/016214503000125. [DOI] [Google Scholar]
- Tibshirani R. Regression shrinkage and selection via the lasso. J R Stat Soc B. 1996;58:267–288. [Google Scholar]
- Hastie T, Tibshirani R, Eisen MB, Alizadeh A, Levy R, Staudt L, Chan WC, Botstein D, Brown P. ’Gene Shaving’ as a method for identifying distinct sets of genes with similar expression patterns. Genome Biol. 2000;1(2):1–21. doi: 10.1186/gb-2000-1-2-research0003. [DOI] [PMC free article] [PubMed] [Google Scholar]
- Jiang Q, Wang Y, Hao Y, Juan L, Teng M, Zhang X, Li M, Wang G, Liu Y. miR2Disease: a manually curated database for microRNA deregulation in human disease. Nucleic Acids Res. 2009;37:D98–D104. doi: 10.1093/nar/gkn714. [DOI] [PMC free article] [PubMed] [Google Scholar]
- Hart M, Wach S, Nolte E, Szczyrba J, Menon R, Taubert H, Hartmann A, Stoehr R, Wieland W, Grässer FA, Wullich B. The proto‐oncogene ERG is a target of microRNA miR‐145 in prostate cancer. FEBS J. 2013;280(9):2105–2116. doi: 10.1111/febs.12236. [DOI] [PubMed] [Google Scholar]
- Ozen M, Creighton CJ, Ozdemir M, Ittmann M. Widespread deregulation of microRNA expression in human prostate cancer. Oncogene. 2007;27:1788–1793. doi: 10.1038/sj.onc.1210809. [DOI] [PubMed] [Google Scholar]
- Wang L, Tang H, Thayanithy V, Subramanian S, Oberg AL, Cunningham JM, Cerhan JR, Steer CJ, Thibodeau SN. Gene networks and microRNAs implicated in aggressive prostate cancer. Cancer Res. 2009;69(24):9490–9497. doi: 10.1158/0008-5472.CAN-09-2183. [DOI] [PMC free article] [PubMed] [Google Scholar]
- Pesta M, Klecka J, Kulda V, Topolcan O, Hora M, Eret V, Ludvikova M, Babjuk M, Novak K, Stolz J, Holubec L. Importance of miR‐20a expression in prostate cancer tissue. Anticancer Res. 2010;30(9):3579–3583. [PubMed] [Google Scholar]
- Sylvestre Y, De Guire V, Querido E, Mukhopadhyay UK, Bourdeau V, Major F, Ferbeyre G, Chartrand P. An E2F/miR‐20a autoregulatory feedback loop. J Biol Chem. 2007;282(4):2135–2143. doi: 10.1074/jbc.M608939200. [DOI] [PubMed] [Google Scholar]
- Volinia S, Calin GA, Liu CG, Ambs S, Cimmino A, Petrocca F, Visone R, Iorio M, Roldo C, Ferracin M, Prueitt RL, Yanaihara N, Lanza G, Scarpa A, Vecchione A, Negrini M, Harris CC, Croce CM. A microRNA expression signature of human solid tumors defines cancer gene targets. Proc Nat Acad Sci, USA. 2006;103(7):2257–2261. doi: 10.1073/pnas.0510565103. [DOI] [PMC free article] [PubMed] [Google Scholar]
- Clape C, Fritz V, Henriquet C, Apparailly F, Fernandez PL, Iborra F, Avancès C, Villalba M, Culine S, Fajas L. miR‐143 interferes with ERK5 signaling, and abrogates prostate cancer progression in mice. PLoS ONE. 2009;4(10):e7542. doi: 10.1371/journal.pone.0007542. [DOI] [PMC free article] [PubMed] [Google Scholar]
- Porkka KP, Pfeiffer MJ, Waltering KK, Vessella RL, Tammela TL, Visakorpi T. MicroRNA expression profiling in prostate cancer. Cancer Res. 2007;67(13):6130–6135. doi: 10.1158/0008-5472.CAN-07-0533. [DOI] [PubMed] [Google Scholar]
- Hirata H, Ueno K, Shahryari V, Deng G, Tanaka Y, Tabatabai ZL, Hinoda Y, Dahiya R. MicroRNA‐182‐5p promotes cell invasion and proliferation by down regulating FOXF2, RECK and MTSS1 genes in human prostate cancer. PLoS ONE. 2013;8(1):e55502. doi: 10.1371/journal.pone.0055502. [DOI] [PMC free article] [PubMed] [Google Scholar]
- Schaefer A, Jung M, Mollenkopf HJ, Wagner I, Stephan C, Jentzmik F, Miller K, Lein M, Kristiansen G, Jung K. Diagnostic and prognostic implications of microRNA profiling in prostate carcinoma. Int J Cancer. 2010;126(5):1166–1176. doi: 10.1002/ijc.24827. [DOI] [PubMed] [Google Scholar]


