

Abstract
Small field dosimetry is challenging due to the finite size of the conventional detectors that underestimate the dose distribution. With the fast development of the dynamic proton beam delivery system, it is essential to find a dosimeter which can be used for 3D dosimetry of small proton fields. We investigated the feasibility of using a proton formula PRESAGE® for 3D dosimetry of small fields in a uniform scanning proton beam delivery system with dose layer stacking technology. The relationship between optical density and the absorbed dose was found to be linear through small volume cuvette studies for both photon and proton irradiation. Two circular fields and three patient-specific fields were used for proton treatment planning calculation and beam delivery. The measured results were compared with the calculated results in the form of lateral dose profiles, depth dose, isodose plots and gamma index analysis. For the circular field study, lateral dose profile comparison showed that the relative PRESAGE® profile falls within ± 5% from the calculated profile for most of the spatial range. For unmodulated depth dose comparison, the agreement between the measured and calculated results was within 3% in the beam entrance region before the Bragg peak. However, at the Bragg peak, there was about 20% underestimation of the absorbed dose from PRESAGE®. For patient-specific field 3D dosimetry, most of the data points within the target volume passed gamma analysis for 3% relative dose difference and 3 mm distance to agreement criteria. Our results suggest that this proton formula PRESAGE® dosimeter has the potential for 3D dosimetry of small fields in proton therapy, but further investigation is needed to improve the dose under-response of the PRESAGE® in the Bragg peak region.
1. Introduction
Proton therapy, as one of the fastest growing radiation treatment modalities, offers the prospect of improving dose coverage of the tumor and normal tissue sparing compared to conventional photon therapy. Despite the fact that small proton fields were first used for eye treatment (Goitein and Miller 1983, Gragoudas et al 1977), characterizing small proton fields remains a challenge. Thus, there is an associated risk of treatment complication and failure if the dose to small fields is not properly calculated, measured and reported. For small proton fields, loss of charged particle equilibrium results in the deterioration of the Bragg peak and non-uniformity of the spread-out Bragg peak (SOBP) (Hong et al 1996, Titt et al 2008, Fontenot et al 2007, Daartz et al 2009). The finite size of the conventional detector tends to underestimate the dose distribution and many of the problems associated with small fields in radiation treatment have been discussed (Das et al 2008). As the dynamic beam delivery system becomes more popular than the traditional passive scattering beam delivery system, quality assurance for small proton fields becomes more complex.
Zeidan et al (2010) reported good results using a new formula BANG3-Pro2 gel dosimeter for 3D dose verification in proton therapy using a passive scattering beam. They focused on open field dose distributions where the planning system was known to be accurate. Fontenot et al (2007) compared the reliability of two methods for determining the dose per monitor unit for small treatment fields with and without range compensator. Bednarz et al (2010) demonstrated that a treatment planning system using a pencil beam algorithm generally overestimates the dose delivered to the target volume for small fields compared to Monte Carlo calculations. Existing research on small proton field dosimetry is limited to calculation or simulation on passive scattering beam delivery system, and most of the investigations were focused on how to obtain accurate dose per monitor unit for small fields.
Recent studies show that PRESAGE®, a polyurethane dosimeter, in combination with an optical scanner system offers a promising alternative for 3D dosimetry with external beam photon radiotherapy (Oldham et al 2008, Sakhalkar et al 2009, Thomas et al 2011). However, the use of the PRESAGE® photon formulation for proton therapy dosimetry has not been successful, since an under-dosage of up to 10% was observed near the Bragg peak region, due to its linear energy transfer (LET) dependences (Al-Nowais et al 2009, Zhao et al 2010).
A new formula of PRESAGE® for proton therapy has recently been developed. This proton formulation differed from the previous formulations by having a lower effective atomic number. PRESAGE® formulations have been evaluated by the Monte Carlo calculation for photon beams (Gorjiara et al 2011). The proton evaluation is still a work in progress, but all indications are that lower effective atomic number makes PRESAGE® more tissue equivalent. The aim of our study is to investigate whether or not it is possible to carry out 3D relative dose verification of proton small field delivery using the proton formula PRESAGE®. One of the difficulties for evaluating small proton field dosimetry is the lack of a ‘gold standard’. In our comparison, treatments planning results were used as the ‘gold standard’. A uniform scanning beam delivery system was used for irradiation instead of the passive scattering system.
2. Methods and materials
2.1. Characteristics of the proton formula PRESAGE® dosimeter
The PRESAGE® formula studied in this work was designed for proton beams. In the rest of this paper, it will be referred to as the proton PRESAGE® formula. The PRESAGE® dosimeter is formed in two steps. In the first step, mixing one part of a polyol with two parts of a di-isocyanate forms a transparent plastic matrix. The second step consists of mixing the leuco dye, a free radical initiator and a catalyst and blending with the polyol/di-isocynate solution followed by pouring the mixture into a mold and allowing it to cure for several days. The mass density provided by the manufacturer (Heuris Pharma, NJ, USA) is 1.06 g cm−3. A breakdown of the elemental and chemical composition of the proton PRESAGE® formula is summarized in table 1. The effective atomic number of PRESAGE® has been calculated as 9.55 using mass attenuation coefficients of photon beams for the various elements, although it has been reported that the effective atomic numbers are different between photon and proton beams (Prasad et al 1997). The derived chemical formula based on elemental composition is C304H510N20O71SBr. The electron density relative to water was calculated to be 1.037 using the following formula:
| (1) |
where NA is the Avogadro’s number and wi is the fraction by weight of the ith element of atomic number Zi and atomic mass Ai. The relative proton stopping power was calculated to be 1.042 using the formula published by Schneider et al (1996):
| (2) |
Table 1.
Elemental composition of the proton PRESAGE® formulation.
| Elements | Weight percentage |
|---|---|
| H | 9% |
| C | 64% |
| N | 5% |
| O | 20% |
| S | 0.8% |
| Br | 1.2% |
2.2. Cuvette studies
To establish the relationship between the optical density change and absorbed dose, 18 small volumes of PRESAGE® in 1 × 1 × 5 cm optical cuvettes were irradiated with proton beams to dose in the range 0.5–10 Gy. The samples were placed in the middle of an SOBP of a proton beam with a range of 16 cm in water (corresponds approximately to 160 MeV kinetic energy). The method of the cuvette measurement was similar to what was used by Pierquet et al (2010). Cuvettes were placed in a solid water phantom with 1 cm bolus placed both above and underneath the cuvettes. At depth 11 cm, the cuvettes were surrounded by a bolus sheet to provide a uniform radiation dose. Cuvette dosimeters were pre-scanned before irradiation and then scanned 8 h after irradiation using a spectrophotometer. Each cuvette was marked at the top and positioned in the sample holder with the same orientation for pre- and post-scans. For each cuvette sample, two scans were acquired with the light transmission sides rotated by 180°. The average of the two absorbance spectra was used for analysis.
Additionally, six cuvettes from the same batch were irradiated by a 6 MV photon beam. The irradiation geometry was the same as what was reported by Pierquet et al (2010). The dose range was 0.5–8 Gy. After each irradiation, the radiation-induced optical density (OD) change was immediately recorded. The OD measurements of the PRESAGE® cuvettes were made pre- and post-irradiation using the Thermo Scientific Genesys 20 spectrophotometer. Prior experiments determined that the optimal scanning wavelength (i.e. where the maximum radiation induced OD change occurred) was 632 nm, which is consistent with previous studies (Guo et al 2006). All further OD measurements were therefore made at this wavelength. Besides the immediate measurement taken after irradiation, the OD measurements were also taken at different times, 1 h, 1 d and 10 d to study the post-irradiation optical density stability.
2.3. Handling, shipping and storage of PRESAGE®
Previous studies have reported that the PRESAGE® dosimeter dose response depends on the temperature (Skyt et al 2010). Small cuvettes and large cylindrical dosimeters used in our study were stored in a freezer at −20°C when not used for measurements. Insulated StyroFoam coolers were used for shipping. Refreezable ice packs were placed inside to maintain the low temperature. A digital USB temperature and humidity data logger was included in the package to monitor the temperature variation during handling, shipping and storage. PRESAGE® dosimeters are sensitive to ultraviolet lights and visible lights; therefore, they were kept in black plastic pouches for storage. They were taken out of the freezer and left in the room for 1 h before irradiation to allow the temperature to reacclimatize to room temperature.
2.4. PRESAGE® /optical-CT 3D dosimetry system
The dosimeters used in our study, except the cuvettes, were pre-scanned on the Duke Midsized Optical Scanner (DMOS) using 0.5° per step to produce 720 projection images before irradiation. This DMOS scanner is very similar to the DMOS-RPC. The DMOS-RPC scanner was developed for collaborative research between Duke and the Radiological Physics Center (RPC). It is a robust, economical scanning system which can quickly and effectively provide 3D dosimetric information on the accuracy of the delivery of complex dose distributions. Details of the DMOS-RPC scanner can be found in the literature (Newton et al 2010).
2.5. Beam delivery
The Indiana University Health Proton Therapy Center (IUHPTC) is equipped with two uniform scanning beam delivery systems and one double scattering beam delivery system. In the double scattering beam delivery system, a rotating range modulation wheel is used to generate a SOBP. In the uniform scanning beam delivery system, a layer stacking technique is used to create a SOBP. An X–Y scanning magnet spreads the beam laterally. The laterally spread-out beam then passes through the range modulator, which pulls back the pristine Bragg peak consecutively to different ranges, resulting in layer-by-layer irradiation of the target volume. Patient-specific apertures made of brass and range compensators made of Lucite are used for transverse and longitudinal shaping of the dose fields, respectively. More details of the system has been reported elsewhere (Farr et al 2008).
2.6. Large volume studies
The large volume studies consist of three sub-studies. The first sub-study was to compare the depth dose curves for an unmodulated proton beam. The second sub-study was to compare the transverse dose profiles measured at the center of the SOBP for circular fields. The third sub-study, the focus of this paper, was the feasibility study of using PRESAGE® for patient-specific small field 3D dosimetry. Cuvettes and the large volume dosimeters used for the first and second sub-studies were from the same batch, and the ones used for the third sub-study were from a different batch.
One cylindrical dosimeter (16 cm diameter) was irradiated with a 120 MeV unmodulated proton beam of field size 5 cm in diameter. The measured Bragg curves along the central axis were compared with the calculated result from the CMS XiO treatment planning system (CMS Inc., St. Louis, MO). The rest of the large volume studies were all irradiated with modulated proton beams.
Two cylindrical dosimeters (8 cm diameter and 16 cm diameter) were irradiated using circular field sizes of 1 and 7 cm diameter, respectively, without compensators with a proton beam range of 6 cm and SOBP of 3 cm and a proton range of 12 cm and SOBP of 10 cm, respectively. The dosimeters were simulated in the CMS XiO treatment planning system. The smallest dose grid size of 1 mm was used for the dose calculation. The measured transverse dose profiles in the plateau region of SOBPs were compared with those calculated from the treatment planning system.
For the patient-specific small field study, three cylindrical dosimeters (two 10 cm diameter and one 4 cm diameter, length 6 cm) were used. The proton ranges used for delivery were limited by the physical size of the sample dosimeters. Proton beams with 6 cm range, which corresponds to the minimum range in the proton therapy system, with three different SOBP widths were used. Three patient-specific small apertures were selected for this study. The details of field characteristics for the three proton fields are listed in table 2.
Table 2.
Field characteristics for patient-specific small field study.
| Field | Range (cm) | SOBP (cm) | Dose (cGy) | Included compensator or not? | Site |
|---|---|---|---|---|---|
| A | 6 | 5.7 | 500 | No | Optic nerve |
| B | 6 | 3.6 | 300 | Yes | Clivus |
| C | 6 | 4.3 | 150 | Yes | Nasopharynx |
A single field plan was generated with each beam shaping device for each of the PRESAGE® dosimeters in the treatment planning system, with the beam axis coinciding with the axis of the dosimeters. A pencil beam algorithm with 3 mm grid size was used for the dose calculation to replicate our clinical setting. The calculated 3D dose distributions were exported to compare with the results from measurements.
To compare with calculated results in terms of relative dose distributions including isodose plots, dose profiles and gamma analysis, three PRESAGE® dosimeters were set up on a robotic couch and irradiated with the setup as described in the respective individual plans. Dosimeter A was irradiated without the range compensator, and the other two dosimeters were irradiated with compensators in place. Figure 1 shows the aperture used in irradiation of dosimeter A.
Figure 1.
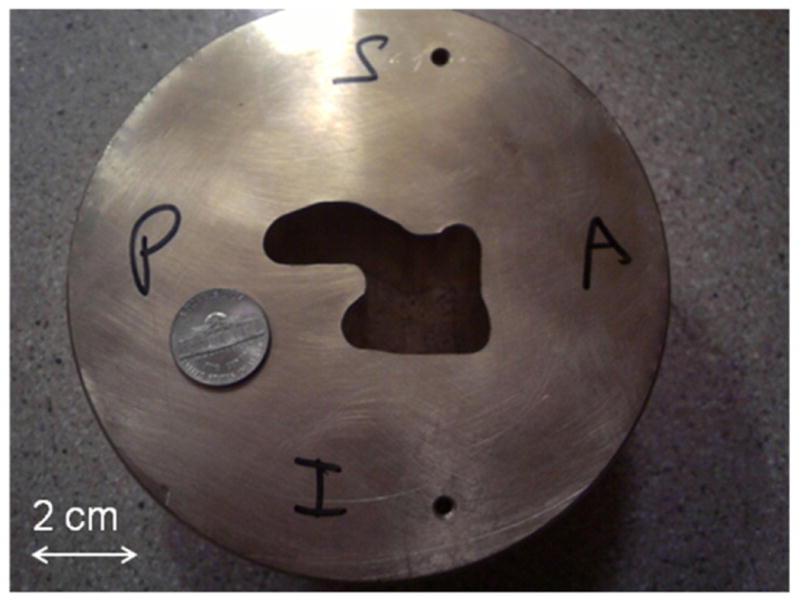
Patient brass aperture used in the irradiation of dosimeter A. A US nickel (comparable to the size of a 20 cent euro coin) is shown to reflect the dimension.
3. Results and discussions
3.1. Cuvette studies
The dose response of PRESAGE® was found to be linear in the dose range from 0 to 10 Gy, as shown in figure 2. The calibration curves between photon beams and proton beams were very similar. The slope of the straight line for samples irradiated with proton beam was 0.0428 (R2 = 0.9973), and that obtained from photon irradiation was 0.0414 (R2 = 0.9939). This results indicates that under these exposure conditions the PRESAGE® has a low dependence on radiation beam modality and energy, showing about an average of 10% difference between the 6 MV photon beam and the 160 MeV proton beam (16 cm range). The post-irradiation optical density study shows that PRESAGE® is relatively stable with the net OD change less than 0.02 up to ten days post-irradiation.
Figure 2.

Optical density response to the dose of PRESAGE® irradiated with proton and photon beams. The dose response is found to be linear up to approximately 10 Gy (R2 = 0.9973). It shows weak beam modality dependence.
3.2. Large volume studies
For the unmodulated proton beam study, the relative depth dose profiles were normalized to the depth of 4 cm in the low-dose gradient region. The agreement between the PRESAGE® measured and calculated relative depth dose curves was within 3% in the beam entrance region before the Bragg peak (1 to 8 cm depth), as shown in figure 3. However, at the Bragg peak, there was about 20% underestimation of the absorbed dose from PRESAGE®. This is similar to what was reported by Al-Nowais et al (2009) for PRESAGE™ (a previous formula). An empirical-correction-based approach has been shown to be useful for correcting LET dependence of Gafchromic EBT film dosimetry in proton depth dose measurement (Zhao and Das 2010). A similar approach could be helpful for correcting LET dependence of PRESAGE®. Further investigations are necessary to understand and quantify the effect of LET on PRESAGE® before appropriate correction approach can be found.
Figure 3.

Per cent depth dose curves comparison between the one measured from PRESAGE® (see dashed arrow) and the one calculated from treatment planning system (see solid arrow).
For the circular field study, the results of transverse dose comparison between the dose profiles measured from PRESAGE® and the calculated dose profiles from the treatment planning system are shown in figure 4. The dose normalization was at the central axis. It showed that the relative PRESAGE® profile falls within ± 5% from the calculated profile for most of the spatial range. The 50% widths of the transverse profiles matched within 1 mm. Some discrepancies were observed in the low-dose region (<20% isodose level). For the 7 cm diameter field size, there were ‘horns’ at the edges of the measured lateral dose profiles for PRESAGE® due to scattered radiation from the aperture edges since the cylindrical dosimeters were very close to the aperture (Gottschalk et al 1993). This scattering effect is not accurately modeled in the XiO treatment planning system.
Figure 4.
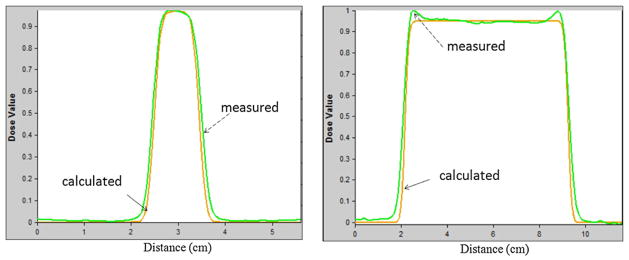
Dose profiles comparison of circular field with diameter 1 cm (left) and 7 cm (right). The dashed arrow pointed profiles were the results from PRESAGE® measurement and the solid arrow pointed profiles were the results calculated from the treatment planning system.
For the patient-specific small field study, isodose distribution comparisons between the calculated and the measured results for the three proton fields are shown in figures 5–7. Transverse dose profile comparisons between calculation and measurement are included in figure 8. Overall, it shows good agreement with notable small discrepancy at the field edges. The zigzag shape of the calculated dose distribution could be improved if a smaller dose calculation grid is used rather that the default, 3 mm calculation grid size used in our clinical scenario.
Figure 5.
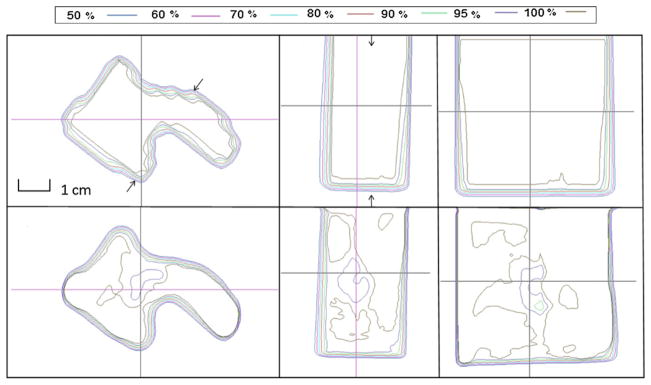
Isodose distribution comparison between calculated (top) and measured (bottom) results from field A. Left, middle and right rows represent dose distributions in transverse, sagittal and coronal planes, respectively.
Figure 7.
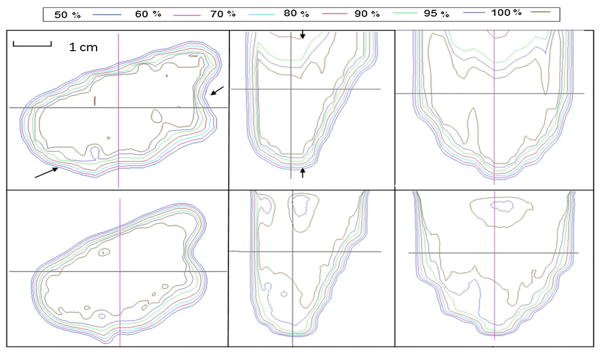
Isodose distribution comparison between calculated (top) and measured (bottom) results from field C. Left, middle and right rows represent dose distributions in transverse, sagittal and coronal planes, respectively.
Figure 8.

Dose profile comparison between calculated (see solid arrows) and measured (see dashed arrows) results along the arrows in the top left panel of figures 5–7.
Figure 9 presents depth dose profile comparison between calculated and measured results of two fields. Due to image artifact, depth dose profile data within the first 1 cm along the beam path were not used. The data presented here started from the depth of 1 cm. It is promising to see that there is no significant difference of the range between calculated and measured results. However, the measured depth dose profile showed a sharper distal dose fall off compared to calculated results. A maximum relative dose difference of 5% was observed between the beam entrance and the 90% distal end. The magnitude of the under dose response was smaller than what was seen for the unmodulated beam. This might be due to the batch-to-batch variation of the PRESAGE® formula.
Figure 9.

Depth dose profile comparison between calculated (see solid arrows) and measured (see dashed arrows) results along arrows in middle subfigures of figures 5 and 7.
Furthermore, gamma-map analysis was used to assess the extent of agreement between calculated and measured dose distributions. A sample result of using 3% dose difference and 3 mm distance to agreement (DTA) for gamma map analysis is shown in figure 10. Again, because the data points within the first 1 cm of the depth were not available due to image artifacts, we cannot provide a quantitative percentage of the total data point passing the gamma test. However, by visual examination, it can be seen that a majority of the data points in the treated volume resulted in γ < 1 and met the criteria. The largest dose differences were observed in the high-dose gradient region, such as the field edges and the distal dose fall off region given the challenging nature of the distribution.
Figure 10.
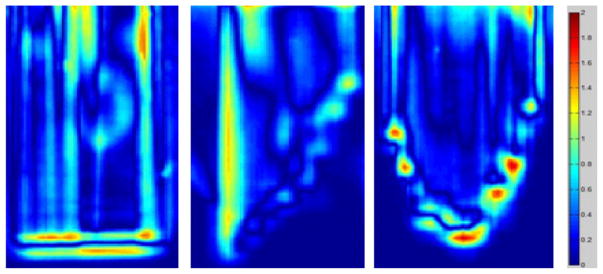
Results of gamma map analysis of one sagittal plane of field A, and coronal planes of fields B and C.
4. Conclusions
Evaluating the dose distribution of small proton fields is a clinical challenge. Any discrepancy between calculated dose from the treatment planning system and delivered dose for small proton fields should be carefully verified through three-dimensional (3D) quantifications. In this paper, we demonstrated the feasibility of using the PRESAGE® dosimeter for 3D dosimetry of small proton fields with remote scanning and reading. The relationship between optical density and the absorbed dose was found to be linear through small volume cuvette studies for both photon irradiation and proton irradiation. Two circular fields and three patient-specific fields were used for treatment planning calculation and beam delivery. For the circular field study, a lateral dose profile comparison of the circular fields showed that the relative PRESAGE® profile falls within ± 5% from the calculated profile for most of the spatial range. For patient-specific field 3D dosimetry, a majority of the data points within the treated volume passed the 3% and 3 mm gamma index analysis, although there is a notable discrepancy at high-dose gradient region, such as at the distal dose fall-off and at the field edge. The unmodulated Bragg curve comparison shows that there was about 20% under dose response at the Bragg peak, which may be corrected with a correction factor as in the case of Gafchromic EBT film measurements. Monte Carlo simulation on the formulation studies of PRESAGE® are currently underway to evaluate whether the under dose response in the high linear energy transfer region can be minimized.
Figure 6.

Isodose distribution comparison between calculated (top) and measured (bottom) results from field B. Left, middle and right rows represent dose distributions in transverse, sagittal and coronal planes, respectively.
Acknowledgments
The authors appreciate the generous help of Dr Irina Tsvetkova for assisting in the cuvette data collection using the spectrophotometer. The authors want to thank Dr Bogdan Dragnea of the Department of Chemistry at Indiana University and Dr Susan Klein of Department of Physics at Indiana University for their support.
References
- Al-Nowais S, Doran S, Kacperek A, Krstajic N, Adamovics J, Bradley D. A preliminary analysis of LET effects in the dosimetry of proton beams using PRESAGE and optical CT. Appl Radiat Isot. 2009;67:415–8. doi: 10.1016/j.apradiso.2008.06.032. [DOI] [PubMed] [Google Scholar]
- Bednarz B, Daartz J, Paganetti H. Dosimetric accuracy of planning and delivering small proton therapy fields. Phys Med Biol. 2010;55:7425–38. doi: 10.1088/0031-9155/55/24/003. [DOI] [PMC free article] [PubMed] [Google Scholar]
- Daartz J, Engelsman M, Paganetti H, Bussiere MR. Field size dependence of the output factor in passively scattered proton therapy: influence of range, modulation, air gap, and machine settings. Med Phys. 2009;36:3205–10. doi: 10.1118/1.3152111. [DOI] [PubMed] [Google Scholar]
- Das IJ, Ding GX, Ahnesjo A. Small fields: nonequilibrium radiation dosimetry. Med Phys. 2008;35:206–15. doi: 10.1118/1.2815356. [DOI] [PubMed] [Google Scholar]
- Farr JB, Mascia AE, Hsi WC, Allgower CE, Jesseph F, Schreuder AN, Wolanski M, Nichiporov DF, Anferov V. Clinical characterization of a proton beam continuous uniform scanning system with dose layer stacking. Med Phys. 2008;35:4945–54. doi: 10.1118/1.2982248. [DOI] [PMC free article] [PubMed] [Google Scholar]
- Fontenot JD, Newhauser WD, Bloch C, White RA, Titt U, Starkschall G. Determination of output factors for small proton therapy fields. Med Phys. 2007;34:489–98. doi: 10.1118/1.2428406. [DOI] [PubMed] [Google Scholar]
- Goitein M, Miller T. Planning proton therapy of the eye. Med Phys. 1983;10:275–83. doi: 10.1118/1.595258. [DOI] [PubMed] [Google Scholar]
- Gorjiara T, Hill R, Kuncic Z, Adamovics J, Bosi S, Kim JH, Baldock C. Investigation of radiological properties and water equivalency of PRESAGE dosimeters. Med Phys. 2011;38:2265–74. doi: 10.1118/1.3561509. [DOI] [PubMed] [Google Scholar]
- Gottschalk B, Koehler AM, Schneider RJ, Sisterson JM, Wagner MS. Multiple Coulomb scattering of 160 MeV protons. Nucl Instrum Methods Phys Res B. 1993;74:467–90. [Google Scholar]
- Gragoudas ES, Goitein M, Koehler AM, Verhey L, Tepper J, Suit HD, Brockhurst R, Constable IJ. Proton irradiation of small choroidal malignant melanomas. Am J Ophthalmol. 1977;83:665–73. doi: 10.1016/0002-9394(77)90133-7. [DOI] [PubMed] [Google Scholar]
- Guo PY, Adamovics JA, Oldham M. Characterization of a new radiochromic three-dimensional dosimeter. Med Phys. 2006;33:1338–45. doi: 10.1118/1.2192888. [DOI] [PMC free article] [PubMed] [Google Scholar]
- Hong L, Goitein M, Bucciolini M, Comiskey R, Gottschalk B, Rosenthal S, Serago C, Urie M. A pencil beam algorithm for proton dose calculations. Phys Med Biol. 1996;41:1305–30. doi: 10.1088/0031-9155/41/8/005. [DOI] [PubMed] [Google Scholar]
- Newton J, Thomas A, Ibbott G, Oldham M. Preliminary commissioning investigations with the DMOS-RPC optical-CT scanner. J Phys: Conf Ser. 2010;250:012078. doi: 10.1088/1742-6596/250/1/012078. [DOI] [PMC free article] [PubMed] [Google Scholar]
- Oldham M, Sakhalkar H, Guo P, Adamovics J. An investigation of the accuracy of an IMRT dose distribution using two- and three-dimensional dosimetry techniques. Med Phys. 2008;35:2072–80. doi: 10.1118/1.2899995. [DOI] [PMC free article] [PubMed] [Google Scholar]
- Pierquet M, Thomas A, Adamovics J, Oldham M. An investigation into a new re-useable 3D radiochromic dosimetry material, PresageREU. J Phys: Conf Ser. 2010;250:012047. doi: 10.1088/1742-6596/250/1/012047. [DOI] [PMC free article] [PubMed] [Google Scholar]
- Prasad SG, Parthasaradhi K, Bloomer WD. Effective atomic numbers of composite materials for total and partial interaction processes for photons, electrons, and protons. Med Phys. 1997;24:883–5. doi: 10.1118/1.598001. [DOI] [PubMed] [Google Scholar]
- Sakhalkar H, Sterling D, Adamovics J, Ibbott G, Oldham M. Investigation of the feasibility of relative 3D dosimetry in the Radiologic Physics Center Head and Neck IMRT phantom using presage/optical-CT. Med Phys. 2009;36:3371–7. doi: 10.1118/1.3148534. [DOI] [PMC free article] [PubMed] [Google Scholar]
- Schneider U, Pedroni E, Lomax A. The calibration of CT Hounsfield units for radiotherapy treatment planning. Phys Med Biol. 1996;41:111–24. doi: 10.1088/0031-9155/41/1/009. [DOI] [PubMed] [Google Scholar]
- Skyt PS, Balling P, Petersen JB, Yates ES, Muren LP. Effect of irradiation and storage temperature on PRESAGE™ dose response. J Phys : Conf Ser. 2010;250:1–2. [Google Scholar]
- Thomas A, Newton J, Adamovics J, Oldham M. Commissioning and benchmarking a 3D dosimetry system for clinical use. Med Phys. 2011;38:4846–57. doi: 10.1118/1.3611042. [DOI] [PMC free article] [PubMed] [Google Scholar]
- Titt U, Zheng Y, Vassiliev ON, Newhauser WD. Monte Carlo investigation of collimator scatter of proton-therapy beams produced using the passive scattering method. Phys Med Biol. 2008;53:487–504. doi: 10.1088/0031-9155/53/2/014. [DOI] [PubMed] [Google Scholar]
- Zeidan OA, Sriprisan SI, Lopatiuk-Tirpak O, Kupelian PA, Meeks SL, Hsi WC, Li Z, Palta JR, Maryanski MJ. Dosimetric evaluation of a novel polymer gel dosimeter for proton therapy. Med Phys. 2010;37:2145–52. doi: 10.1118/1.3388869. [DOI] [PubMed] [Google Scholar]
- Zhao L, Das IJ. Gafchromic EBT film dosimetry in proton beams. Phys Med Biol. 2010;55:N291–301. doi: 10.1088/0031-9155/55/10/N04. [DOI] [PubMed] [Google Scholar]
- Zhao L, Das IJ, Zhao Q, Thomas A, Adamovics J, Oldman M. Determination of the depth dose distribution of proton beam using PRESAGE™ dosimeter. J Phys : Conf Ser. 2010;250:012035. doi: 10.1088/1742-6596/250/1/012035. [DOI] [PMC free article] [PubMed] [Google Scholar]