Abstract
In this work, it was hypothesized that co-cultures of articular chondrocytes (ACs) and mesenchymal stem cells (MSCs) would exhibit enhanced sensitivity to chondrogenic stimuli, such as TGF-β3, and would require a reduced concentration of TGF-β3 to achieve an equivalent level of chondrogenesis compared to monocultures of each cell type. Furthermore, it was hypothesized that compared to monocultures, the chondrogenic phenotype of AC/MSC co-cultures would be more stable upon the removal of TGF-β3 from the culture medium. These hypotheses were investigated by culturing ACs and MSCs alone and in a 1:3 ratio on electrospun poly(ε-caprolactone) scaffolds. All cell populations were cultured for two weeks with 0, 1, 3, or 10 ng/ml of TGF-β3. After two weeks growth factor supplementation was removed, and the constructs were cultured for two additional weeks. Cell proliferation, extracellular matrix production, and chondrogenic gene expression were evaluated after two and four weeks. The results demonstrated that co-cultures of ACs and MSCs require a reduced concentration and duration of TGF-β3 exposure to achieve an equivalent level of chondrogenesis compared to AC or MSC monocultures. Thus, the present work implicates that the promise of co-cultures for cartilage engineering is enhanced by their robust phenotype and heightened sensitivity to TGF-β3.
Keywords: Cartilage tissue engineering, Co-culture, Chondrocyte, Growth factors, Mesenchymal stem cell, Polycaprolactone
Introduction
Articular chondrocytes (ACs) and mesenchymal stem cells (MSCs) are common cell sources for articular cartilage engineering; however there are complications associated with the use of each cell type. While ACs are isolated, expanded, and clinically implanted in autologous chondrocyte transplantation [1, 2], obtaining sufficient numbers of ACs presents a challenge, as their isolation can cause significant donor site morbidity [2]. Furthermore, in vitro expansion of ACs can lead to rapid dedifferentiation and a fibroblastic phenotype [2], resulting in an inferior tissue-engineered construct. Conversely, bone marrow-derived MSCs are readily available, easily expandable, and capable of chondrogenic differentiation [3]. While achieving MSC chondrogenesis has been demonstrated, it is not without challenges. After chondrogenic induction, MSCs often exhibit a hypertrophic phenotype [4, 5] followed by calcification of the extracellular matrix (ECM) [5, 6]. Additionally, compared to ACs the amount of cartilage-like ECM produced by differentiating MSCs is minimal [7-9] and leads to constructs with inferior mechanical properties [10]. More recently, co-cultures of ACs and MSCs are being investigated as a potential cell population for articular cartilage engineering [11, 12]. Such a cell population has several advantages, including the ability to reduce the required number of ACs, while achieving equal or greater levels of chondrogenesis compared to ACs alone [13]. Furthermore, the co-culture scheme has been shown to reduce the mineralization and hypertrophy that is often seen in chondrogenic MSCs [4, 14].
Studies investigating the mechanism of enhanced chondrogenesis in AC/MSC cultures have primarily concluded that the trophic effects of MSCs enhance AC chondrogenesis [8, 13, 15]. Most commonly, co-cultures have been investigated using standard serum-free culture medium with 10 ng/ml of TGF-β3 [4, 13-16] or TGF-β1 [8, 11, 17] as a chondrogenic inducer in vitro; however, reduced concentrations of TGF-β3 in AC/MSC co-cultures have not been investigated. Due to the ability of TGF-β3 to enhance chondrogenesis of both ACs and MSCs and thus possibly enhancing the co-culture effects, the present study hypothesized that co-cultures may have enhanced sensitivity to chondrogenic stimuli, and thus may be capable of chondrogenic induction with a reduced concentration of TGF-β3, compared to ACs or MSC cultures alone. Furthermore, due to the continued presence of MSCs and thus continued chondrogenic stimulation, it was hypothesized that the co-cultured cell populations would have a more stable phenotype upon the removal of TGF-β3.
Materials and Methods
Experimental design
Bovine ACs and rabbit bone marrow-derived MSCs were seeded in monoculture or in co-culture (1:3 ratio of ACs:MSCs) on electrospun poly(ε-caprolactone) (PCL) scaffolds and cultured for two weeks in a chemically defined, serum-free culture medium, supplemented with one of four concentrations of TGF-β3: 0 ng/ml, 1 ng/ml, 3 ng/ml or 10 ng/ml. After the initial chondrogenic stimulation period, all groups were cultured for an additional two weeks to evaluate the stability of the construct phenotypes upon the removal of the TGF-β3. Cultures were sampled at two and four weeks of total culture time for DNA, glycosaminoglycan (GAG), and hydroxyproline (HYP) quantification, chondrogenic gene expression, and histological analysis.
Cell isolation
Bovine ACs were isolated from the femoral condyles of 7-10 day old calves (Research 87, Boylston, MA) within 36 hours of slaughter [18]. Articular cartilage was isolated, rinsed in PBS, minced to 1 mm x 1 mm x 1 mm pieces, and digested at 37°C in chondrocyte growth medium (DMEM, 10% fetal bovine serum (FBS) (BenchMark; Gemini Bio-Products, West Sacramento, CA), 1% non-essential amino acids, 50 mg/ml ascorbic acid, 46 mg/ml L-proline, 20 mM HEPES, penicillin/streptomycin/fungizone (PSF)) supplemented with 2 mg/ml collagenase type II (Worthington Biochemical Corporation, Lakewood, NJ). Isolated ACs were rinsed with PBS, pooled, and frozen for storage.
Bone marrow-derived MSCs were harvested and isolated from 5-week-old New Zealand White rabbits (Charles River Laboratories, Wilmington, MA) as previously described [14]. Under general anesthesia, bone marrow from the tibiae was aspirated into 10 ml syringes containing 1000 U of heparin to prevent coagulation. Bone marrow was plated on tissue culture flasks and rinsed after 48 h to remove non-adherent cells. Adherent cells were maintained in general medium (DMEM, 10% FBS, PSF) until confluent, pooled, and frozen.
Scaffold preparation
Non-woven PCL fiber mats were fabricated using a horizontal electrospinning apparatus, as previously described [19]. An 18 wt% solution of PCL (Inherent viscosity range 1.0-1.3 dl/g; Durect corporation, Cupertino, CA) was created by dissolving the polymer in a 5:1 v/v ratio of chloroform to methanol. The polymer solution was extruded at a flow rate of 40 ml/h through a 16 G needle, charged with a voltage of 30 kV, and directed towards a grounded collecting plate, 33 cm from the needle tip. Fiber morphology was inspected using scanning electron microscopy.
Scaffolds with an average fiber diameter of 9.8±2.5 μm were punched from electrospun mats using an 8 mm dermal biopsy punch. Scaffolds, 1.0±0.1 mm in thickness, were sterilized by exposure to ethylene oxide, prewetted in a graded ethanol series, rinsed with PBS, and incubated in general medium for 3 days. Scaffolds were then press-fitted into cylindrical, custom-made, loading cassettes designed to confine the cell seeding suspension above the scaffolds.
D
Cell seeding and culture
ACs and MSCs were thawed and expanded for one and two passages, respectively, lifted from culture using 0.05% trypsin-EDTA, and suspended in chondrocyte growth medium. All scaffolds were seeded with a total of 220,000 cells in 180 μl of culture medium. Scaffolds were seeded with ACs, MSCs, or a 1:3 ratio of ACs to MSCs. After 4 h, additional chondrocyte medium was added to completely cover the scaffolds and loading cassettes, and the cultures were incubated overnight to allow for cell attachment. The seeded constructs were then removed from cassettes and placed in individual wells of 12-well culture plates with 4 ml of serum-free chondrogenic medium (high-glucose DMEM, 1% ITS+ premix (BD Biosciences, San Jose, CA), 50 mg/mL ascorbic acid, 100 nM dexamethasone, PSF), supplemented with 0, 1, 3, or 10 ng/ml TGF-β3 (PeproTech, Rocky Hill, NJ). Half of the medium was replenished three times a week. After two weeks, medium in all experimental groups was replaced with serum-free culture medium without TGF-β3 supplementation. Five replicate samples were harvested after 0, two, and four weeks of culture and washed with PBS. A 3 mm biopsy punch was then used to obtain individual samples for each method of analysis.
Biochemical assays
From each construct, two 3 mm biopsy samples were pooled together and stored at −20°C. Samples were thawed and digested in proteinase K solution (1 mg/ml proteinase K, 0.01 mg/ml pepstatin A and 0.185 mg/ml iodoacetamide in a 50 mM tris(hydroxymethyl aminomethane), 1 mM ethylenediaminetetraacetic acid buffer, pH 7.6) at 56°C for 16 h [7]. Samples then underwent three freeze/thaw cycles followed by 20 min sonication. Double-stranded DNA content of the constructs was quantified using Quant-iT PicoGreen dsDNA Assay Kit (Invitrogen, Eugene, OR) [13]. Cell lysate, assay buffer and dye solution were combined in an opaque 96-well plate in duplicates, incubated for 10 min at room temperature, and fluorescence was measured using excitation and emission wavelengths of 485 nm and 528 nm, respectively (FL x800 Fluorescence Microplate Reader; BioTek Instruments, Winooski, VT). DNA concentrations were determined relative to a lambda DNA standard curve.
Sulfated GAG content was determined using the colorimetric dimethylmethylene blue assay [7]. Cell lysate and color reagent were combined in a transparent 96-well plate in duplicates, incubated for 7 min at room temperature, and absorbance at 520 nm was measured (PowerWave x340 Microplate Reader; BioTek Instruments). GAG concentrations were determined relative to a chondroitin sulfate standard curve.
HYP content, an indicator of total collagen content, was measured using a colorimetric assay [14]. For hydrolysis, cell lysate was combined with an equal volume of 4 N NaOH and heated at 121°C for 15 min. The samples were then neutralized with HCl to pH 6.5–7.0. Samples were divided into duplicate reactions, with chloramine-T and p-dimethylaminobenzaldehyde solutions. Absorbance was read at 570 nm. HYP concentrations were determined relative to a trans-4-hydroxy-L-proline standard curve.
Real time reverse transcription polymerase chain reaction
Pelleted cell seeding stocks and minced constructs (n=5 samples) were rinsed in PBS, placed in 600 μl lysis buffer (Qiagen, Valencia, CA), and vortexed before storing at −80 °C until further processing. Cell lysate was centrifuged through a QIAshredder homogenization column and combined with an equal volume of 70% ethanol. Total RNA was isolated using an RNeasy mini kit (Qiagen, Valencia, CA), following the manufacturer's instructions for the isolation of RNA from animal cells [7, 13]. Reverse transcription was performed using Oligo(dT) primers (Promega, San Luis Obispo, CA) and SuperScript III reverse transcriptase (Invitrogen, Carlsbad, CA). Real-time PCR (Applied Biosystems 7300 Real-Time PCR System, Foster City, CA) was performed on cDNA samples using SYBR Green detection (PerfeCTa SYBR Green FastMix, ROX; Quanta Biosciences, Gaithersburg, MD) with previously established primer sequences, designed to amplify both rabbit and bovine targets with equal efficiencies (Integrated DNA Technologies, Coralville, IA).
Target gene expression was first normalized to the expression of the housekeeping gene glyceraldehyde-3-phosphate dehydrogenase (GAPDH) in the same sample (ΔCt), then to the average baseline expression of that target gene measured in the AC cell stock used to seed the scaffolds (ΔΔCt). The 2−ΔΔCt method was used to convert normalized gene expression levels to fold differences [20], and statistical analysis was performed on these values. Similarly, 2−ΔCt was used to calculate the ratios of collagen II / collagen I. The primer sequences used in this analysis were [13]: Collagen type I: 5’-CCCAGAATGGAGCAGTGGTTACT-3’, 5’-AGCAGACGCATGAAGGCAAG-3’; Collagen type II: 5’-GGCTTCCACTTCAGCTATGGAG-3, 5’-GTGTGTTTCGTGCAGCCATC-3’; Aggrecan: 5’-GAGCAGGAGTTTGTCAACAACAA-3’, 5’-CCTCCCCAGTGGCAAAGAAG-3’; GAPDH: 5’-CCATCTTCCAGGAGCGAGAT-3’, 5’-GGTTCACGCCCATCACAAAC-3’.
Histological Analysis
Samples were fixed using 10% neutral buffered formalin (Fisher Scientific, Pittsburgh, PA), dehydrated in 70% ethanol, and embedded in HistoPrep freezing medium (Fisher Scientific). Frozen constructs were cut into 5 μm thick sections using a cryostat (Leica CM 1850 UV; Leica Biosystems Nussloch GmbH, Germany) and mounted onto glass slides. Sections were then stained using Alcian Blue and Picrosirius Red counter stained with Fast Green to visualize the presence and distribution of GAGs and collagen and cells, respectively. Images were obtained using a light microscope with a digital camera attachment (Axio Imager.Z2 equipped with AxioCam MRc5; Carl Zeiss MicroImaging GmbH, Germany).
Statistical Analysis
Results are reported as means + standard deviation. Statistical analysis was performed using JMP 10 software package (SAS Institute, Cary, NC). One-way ANOVA and Tukey-Kramer multiple comparison tests were used to determine significant differences (p<0.05).
Results
Two week biochemical assays
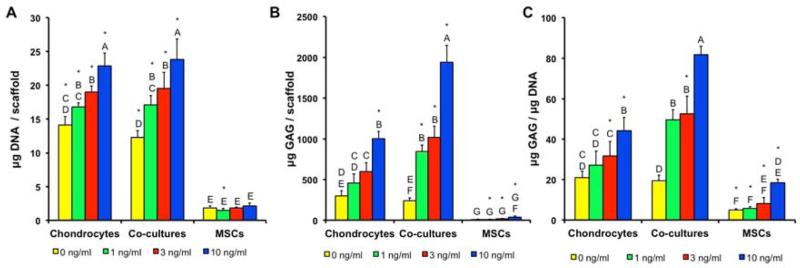
The quantity of DNA was measured in all cell populations at the start of the culture to determine the baseline value and measured again after two weeks of culture (Fig. 1A.). At that time, ACs and co-cultures had proliferated, resulting in an increase in DNA content from the initial levels; however, the MSCs did not exhibit any change in DNA content from day 0. In general, the levels of DNA were independent of TGF-β3 concentration with the exception of non-induced co-cultures having lower DNA content than induced co-cultures. Furthermore, the baseline DNA contents of all cell populations were equal.
Figure 1.
(A) DNA, (B) GAG, and (C) GAG/DNA in constructs after two weeks of culture. Dashed line represents the initial quantity of DNA detected after cell seeding. * indicates a statistically significant difference from the day 0 levels (p<0.05). Groups not connected by same letter are statistically different (p<0.05).
Even when cultured without TGF-β3, AC constructs produced more total GAG and had higher GAG/DNA ratios, than the corresponding MSC cultures, whereas there was no significant difference between co-cultures and MSCs without TGF-β3 (Fig. 1B. and Fig. 1C.). Comparing the effect of TGF-β3 concentration on each cell population at two weeks, MSC constructs did not show an increase in total GAG contents or GAG/DNA ratios, even when cultured with the highest concentration of TGF-β3. AC constructs cultured with 3 ng/ml or higher of TGF-β3 resulted in increased GAG contents and GAG/DNA ratios in comparison to the 0 ng/ml AC group. In contrast, increased GAG contents and GAG/DNA ratios were observed with as little as 1 ng/ml TGF-β3 in the co-cultures. Comparing AC to co-culture constructs directly, co-cultures with 1 ng/ml TGF-β3 resulted in an equivalent GAG/DNA as AC constructs with 10 ng/ml TGF-β3. Compared to cultures containing ACs, MSC constructs produced low levels of GAGs at two weeks.
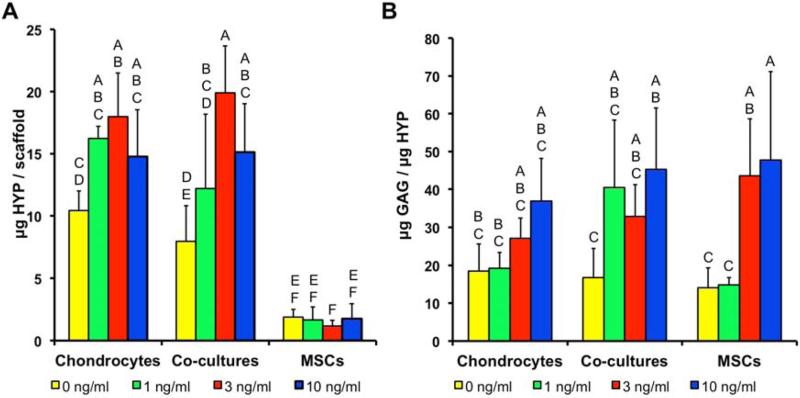
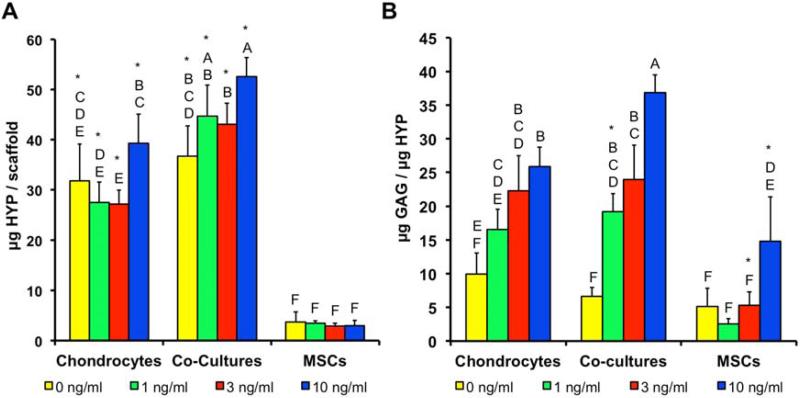
No clear effect of TGF-β3 was observed on the HYP content or GAG/HYP ratios in the AC monocultures (Fig. 2). In contrast, co-cultures showed higher HYP contents in the 3 and 10 ng/ml cultures and higher GAG/HYP in the 10 ng/ml constructs compared to the 0 ng/ml control. MSC cultures generally contained less HYP than the AC and co-culture constructs, with no effect of the TGF-β3; however GAG/HYP ratios were higher in the 3 and 10 ng/ml MSC cultures than the 0 and 1 ng/ml cultures and were similar to the AC and co-culture constructs.
Figure 2.
(A) Hydroxyproline (HYP) and (B) GAG/HYP ratio in constructs after two weeks of culture. Groups not connected by same letter are statistically different (p<0.05).
Two week real time reverse transcription polymerase chain reaction
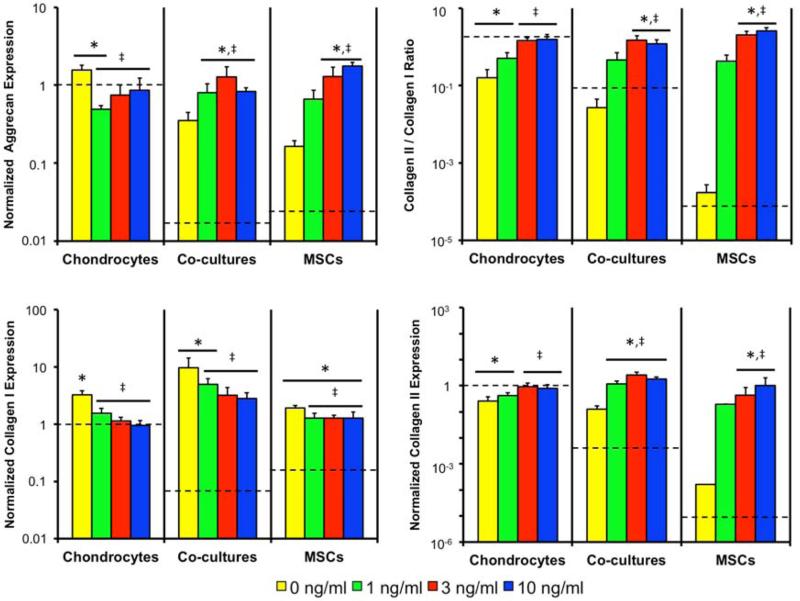
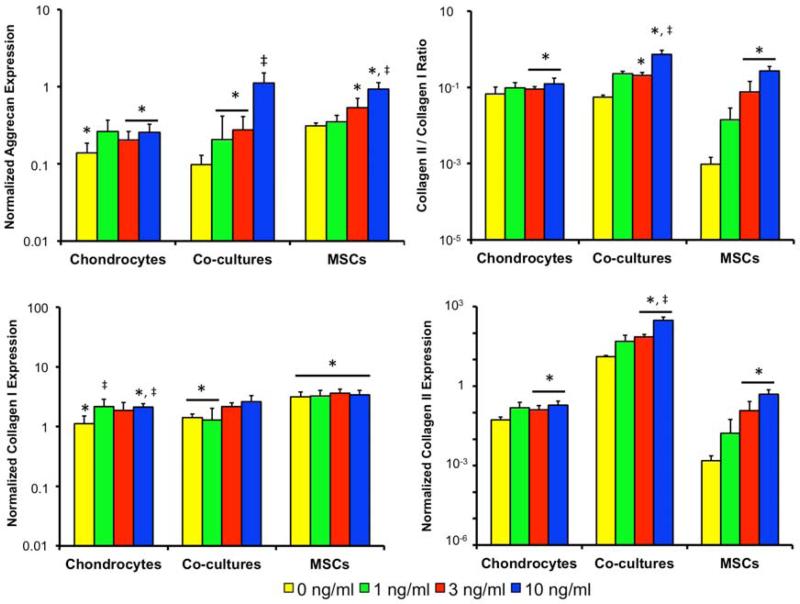
Gene expression levels of select chondrogenic markers after two weeks of culture can be seen in Figure 3, where the values were first normalized internally to GAPDH, then normalized to the day 0 AC samples, and reported as fold change relative to the day 0 AC group. The dashed line represents the day 0 gene expression of each cell population. AC aggrecan expression increased from the day 0 level not exposed to TGF-β3, decreased in the 1 ng/ml culture, and remained unchanged in the other constructs. Thus, AC cultures with TGF-β3 showed lower aggrecan expression than the 0 ng/ml AC control. Collagen I expression followed a similar pattern, as only the 0 ng/ml AC control increased from the day 0 level. Collagen II expression decreased in the 0 and 1 ng/ml AC cultures but remained unchanged in the 3 and 10 ng/ml cultures. Similarly, highest collagen II/I ratio was seen in the 3 and 10 ng/ml AC cultures, with no change from the day 0 level.
Figure 3.
Aggrecan, collagen I and collagen II expression all normalized to chondrocyte monoculture expression upon cell seeding and the collagen II/I expression ratio. Dashed line indicates the starting level of gene expression in each cell type. * indicates a statistically significant difference from the day 0 gene expression levels (p<0.05). ‡ indicates a statistically significant difference from the 0 ng/ml cultures of the same cell population levels (p<0.05).
In the co-cultures aggrecan and collagen II expression increased from the initial levels in all groups exposed to TGF-β3, resulting in higher expression than the 0 ng/ml control. Collagen I expression in the 0 and 1 ng/ml co-culture groups increased from the day 0 expression, but all cultures exposed to TGF-β3 had lower collagen I expression than the 0 ng/ml control. This change in gene expression resulted in a collagen II/I ratio that increased from day 0 in all co-cultures and was highest in the 3 and 10 ng/ml co-cultures.
In the MSC cultures, aggrecan and collagen II expression increased from the initial levels in the 3 and 10 ng/ml cultures, which were both higher than the 0 ng/ml control. Collagen I expression increased from the initial levels in all MSC cultures but was lowest in TGF-β3 cultures. This led to a collagen II/I ratio that was highest in the 3 and 10 ng/ml cultures.
Two week histology
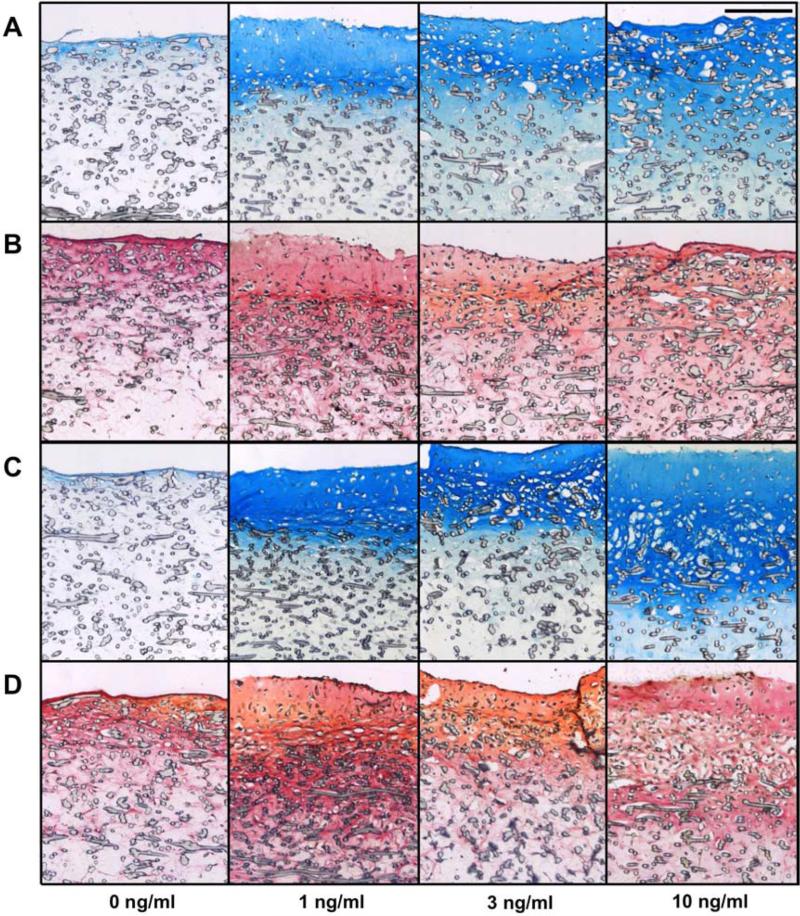
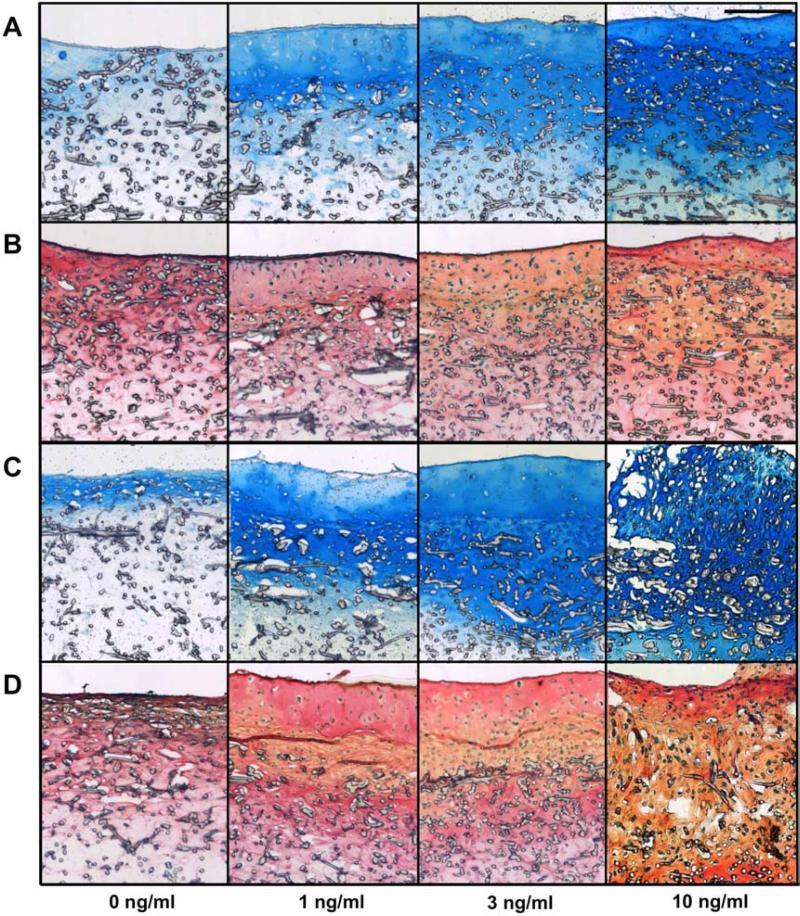
Histological evaluation, presented in Figure 4, corroborated the results of the biochemical assays. More intense GAG staining was observed in AC and co-culture constructs exposed to TGF-β3 compared to the 0 ng/ml control, whereas, no clear effect of TGF-β3 was observed with collagen and cell staining. Additionally, only very low quantities of ECM and cells were observed in MSC sections (data not shown).
Figure 4.
Histological evaluation of AC (A and B) and co-cultured (C and D) constructs after two weeks of culture. Staining with Alcian Blue for GAGs (A and C) and Picrosirius Red for collagen with Fast Green for cells (B and D). Scale bar represents 200 μm in all images.
Four week biochemical assays
After four weeks, ACs and co-cultures had continued to proliferate, but the MSC cultures still exhibited no increase in DNA content from the two week levels (Fig. 5A.). ACs and co-cultures exhibited dose-dependent increases in DNA content with the 10 ng/ml constructs containing the highest quantity of DNA. Additionally, no difference in DNA was found between the AC and co-culture populations at each concentration of growth factor.
Figure 5.
(A) DNA, (B) GAG, and (C) GAG/DNA in constructs after four weeks of culture. * indicates a statistically significant difference from the two week levels (p<0.05). Groups not connected by same letter are statistically different (p<0.05).
Similarly, GAG contents and GAG/DNA ratios of the AC and co-culture constructs followed a dose-dependent trend (Fig. 5B.). ACs with 10 ng/ml of TGF-β3 and co-cultures with all concentrations of TGF-β3 showed an increase in GAG content from two weeks. However when normalized to DNA, this effect translated to an decrease in the GAG/DNA ratios in the 3 and 10 ng/ml AC cultures and the 3 ng/ml co-culture constructs, but no change in the 10 ng/ml co-culture group. All MSC constructs had increased GAG/DNA ratios, and MSC constructs exposed to TGF-β3 had increased GAG content from two weeks. In the AC constructs, the total GAG content in the 3 and 10 ng/ml samples was higher than in the cultures without TGF-β3, but the GAG/DNA ratio was higher only in the 10 ng/ml constructs. However, in the co-culture constructs, all groups exposed to TGF-β3 had higher GAG content and GAG/DNA ratios than the 0 ng/ml controls. In the MSC cultures, there was no difference in GAG content among any of the groups, but the GAG/DNA ratios in the 10 ng/ml cultures were higher than those cultured with 1 ng/ml or less.
HYP content in the constructs increased in all AC and co-cultured groups from two weeks, but was unchanged in the MSC cultures (Fig. 6A.). GAG/HYP ratios also remained steady in all AC and co-culture groups, with the exception of the 1 ng/ml co-cultures, which decreased from the two week level (Fig. 6B.). MSC 3 and 10 ng/ml cultures had increased GAG/HYP ratios from the two week levels. HYP content was higher in all co-culture constructs than in the AC groups exposed to the corresponding TGF-β3 concentration. Compared to the AC and co-culture constructs all MSC groups produced minimal HYP. The GAG/HYP ratios in the constructs followed a dose-dependent pattern with the co-cultures exposed to TGF-β3 having a higher GAG/HYP than the 0 ng/ml control. In the AC groups, the 3 ng/ml and 10 ng/ml cultures had higher GAG/HYP ratios than the 0 ng/ml AC cultures. MSC cultures only resulted in an increased GAG/HYP ratio in the 10 ng/ml culture. Comparing between cell populations, the co-cultures displayed the highest GAG/HYP ratios with the 1 ng/ml co-cultures being equal to the 10 ng/ml AC cultures.
Figure 6.
(A) Hydroxyproline (HYP) and (B) GAG/HYP in constructs after four weeks of culture. * indicates a statistically significant difference from the two week levels (p<0.05). Groups not connected by same letter are statistically different (p<0.05).
Four week real time reverse transcription polymerase chain reaction
Gene expression in all samples at four weeks was first normalized internally, to GAPDH and then normalized to the day 0 AC samples and is shown in Figure 7. All groups were compared to the corresponding gene expression at two weeks and to the 0 ng/ml cultures of the same cell population. AC cultures generally had decreased aggrecan expression from two weeks, such that no effect of previous TGF-β3 exposure was observed. Collagen I expression in AC cultures increased from two weeks in the 10 ng/ml cultures, but decreased in the 0 ng/ml cultures. Both the 1 and 10 ng/ml AC cultures had higher collagen I expression than the 0 ng/ml cultures. Collagen II expression and the collagen II/I ratio decreased from the two week levels in the 3 and 10 ng/ml AC cultures and was no different among any of the growth factor concentrations at four weeks.
Figure 7.
Aggrecan, collagen I and collagen II expression all normalized to chondrocyte monoculture expression upon cell seeding and the collagen II/I expression ratio. * indicates a statistically significant difference from the two week gene expression (p<0.05). ‡ indicates a statistically significant difference from the 0 ng/ml cultures of the same cell population levels (p<0.05).
In the co-cultures, aggrecan expression decreased from two weeks in all TGF-β3 cultures, with the exception of the 10 ng/ml group, where the aggrecan expression remained greater than all other co-culture groups. Collagen I expression decreased in the 0 and 1 ng/ml co-cultures. Interestingly, collagen II expression increased from two weeks in the 3 and 10 ng/ml co-cultures, and both were significantly higher than the 0 ng/ml control. However, the collagen II/I ratio decreased in the 3 and 10 ng/ml co-cultures, but the 10 ng/ml culture still remained higher than the 0 ng/ml control.
MSC cultures had decreased aggrecan expression from two weeks in the 3 and 10 ng/ml cultures, and only in the 10 ng/ml culture group was there any difference in aggrecan expression compared to the 0 ng/ml control. Collagen I expression increased from two weeks in all MSC cultures, and the collagen II expression and the collagen II/I ratio decreased in the 3 and 10 ng/ml cultures. No effect of TGF-β3 was seen in the collagen I, collagen II, or collagen II/I expression of the MSCs at four weeks.
Four week histology
Histological staining at four weeks again corroborated the results of the biochemical assays. More intense GAG staining was observed at four weeks compared to two weeks, and a dose dependent increase in intensity was also observed in the AC and co-cultured constructs. Similarly, a dose dependent increase in cell staining was also observed among the sections, and more intense collagen staining was seen in the four week, compared to the two week sections. Similar to the two week histology, very low levels of ECM and cells were observed in the MSC constructs (data not shown).
Discussion
Co-cultures of ACs and MSCs are a promising cell source for cartilage engineering with the potential to overcome several challenges associated with the individual use of corresponding monocultures. The enhanced proliferation, matrix production, and chondrogenic gene expression of co-cultures has generally been attributed to the ACs, whose chondrogenic activity is upregulated by the presence of MSCs [8, 13, 15]. In the present study, we hypothesized that co-cultures of ACs and MSCs would exhibit enhanced sensitivity to chondrogenic stimuli and thus would require a reduced dosage of TGF-β3 in order to observe enhanced chondrogenesis. Furthermore, it was hypothesized that the presence of the MSCs in long-term co-cultures would continue to enhance AC phenotype even after the removal of TGF-β3, and would therefore lead to robust chondrogenesis with minimized need for exogenously added growth factor.
The sensitivity of the co-cultures was evaluated through investigation of the ECM production and gene expression at each level of TGF-β3 exposure. At two weeks AC cultures had proliferated independent of the TGF-β3 dose. While GAG production was TGF-β3 dose-dependent, a significant enhancement in total GAG and GAG/DNA from the 0 ng/ml cultures was only observed with the higher concentrations (3 or 10 ng/ml) of TGF-β3. At the same time, co-cultured constructs proliferated to the same extent as AC cultures, with a greater increase seen in all cultures exposed to TGF-β3 compared to the 0 ng/ml cultures. As hypothesized in this work, it was seen that co-cultures of ACs and MSCs exhibit a greater sensitivity to TGF-β3 in that enhanced matrix production compared to no TGF-β3 cultures can be observed even with the addition of as little as 1 ng/ml of TGF-β3. Furthermore, while the enhanced sensitivity was seen to improve matrix production, the same effect was also observed when evaluating gene expression. While collagen I expression was reduced in all AC cultures exposed to TGF-β3, aggrecan expression was inhibited in these same constructs. Similar to the matrix production, AC collagen II expression and the collagen II/I ratio was enhanced only in the 3 and 10 ng/ml cultures. Co-cultures on the other hand, demonstrated increased aggrecan and collagen II expression and reduced collagen I expression in all cultures exposed to TGF-β3. These results indicate that TGF-β3 could potentially be effective in co-cultures with a lower dose than in AC cultures alone.
It is known that the in vivo microenvironment can alter cellular response to growth factors compared to in vitro conditions [21], and the results of this study may be further demonstrating the impact of cell microenvironment, as the addition of MSCs to cultures of ACs altered the growth factor sensitivity. Studies evaluating the effect of TGF-β on AC proliferation with ACs of various expansion stages, and thus differentiation states, indicate that the magnitude of the growth factor's effect decreases with AC dedifferentiation [22, 23]. Thus, at least proliferation of ACs as a result of TGF-β exposure is dependent on AC phenotype, and it is plausible that the regulatory effect is extended to matrix production and gene expression, which at two weeks were the primary responses to TGF-β3 in the present study. Potentially, the enhanced sensitivity of co-cultures to TGF-β3 may be a result of MSCs in co-culture enhancing the AC phenotype, and in turn the AC response to TGF-β3. Indeed, the chondrocyte differentiation state and TGF-β sensitivity has been further investigated with rabbit auricular chondrocytes, and results suggested that the correlation between phenotype and TGF-β sensitivity was due to the state of the chondrocyte pericellular matrix [24]. Theoretically, more chondrogenic ACs have more mature pericellular matrices, which are known to sequester growth factors [25] and to affect the presentation of biochemical signals to the cells [26]. Thus, the alterations in the pericellular matrix of ACs either as a result of TGF-β3 exposure or MSC trophic effects could enhance the presentation of biochemical signals to ACs. Additionally, the presence of TGF-β3 may be altering the magnitude or nature of the trophic effects directly, as exogenous growth factors have been shown to regulate the endogenous expression of growth factors [27].
Directly comparing the co-cultured constructs to the AC constructs clearly demonstrates advantages of the AC/MSC co-cultures for cartilage engineering. At two weeks, co-cultures with 3 ng/ml TGF-β3 achieved equivalent chondrogenesis as 10 ng/ml of TGF-β3 in AC constructs. Thus, co-cultures allow for a reduction in both the total number of ACs and amount of growth factor necessary to reach the same level of chondrogenesis as ACs alone. These results were obtained through in vitro culture of the constructs and demonstrate the advantages of this culture model for the generation of tissue-engineered constructs in vitro. While such effects do not necessarily translate to in vivo conditions, the results may suggest the potential of delivering MSCs and TGF-β3 in order to enhance the sensitivity of endogenous or exogenous ACs to the growth factor. Delivering effective concentrations of growth factors in vivo can be challenging as the in vivo environment can lead to rapid removal of the proteins from the wound site, loss of bioactivity, or low availability as a result of the slow tissue diffusion of large proteins [21]. Thus, the use of co-cultures could potentially allow for better success with the delivery of TGF-β3. While such an idea cannot be proven from the current in vitro data, the results of the present study indicate the need to further investigate this concept.
By way of addressing the second hypothesis, cultures were exposed to TGF-β3 for two weeks, after which the growth factor was removed, and the constructs were cultured in serum-free culture medium with dexamethasone. This culture regime is well established, as several studies have demonstrated the advantages of transient exposure to TGF-β3 in AC cultures and have shown that a two week exposure leads to enhanced matrix production and improved construct mechanical properties compared to continuous exposure to TGF-β3 [28-30]. Similar to the results here, a two week initial exposure of ACs to various concentrations of TGF-β3 led to more drastic dose-dependent effects later at four weeks, compared to continuous exposure [30]. However, as demonstrated in the present study, while a significant amount of matrix is produced after four weeks with transient exposure, the chondrogenic gene expression of ACs sharply declines after removal of growth factor. By four weeks, the gene expression of ACs did not demonstrate any positive effect from previous exposure to any of the TGF-β3 concentrations evaluated. Conversely, in co-culture constructs the chondrogenic gene expression generally still decreased from the two week levels, but a significant enhancement in aggrecan, collagen II, and the ratio of collagen II/ collagen I expression was seen in the 10 ng/ml cultures compared to the 0 ng/ml controls. Thus, transient exposure of co-cultures to TGF-β3 resulted in increased proliferation and matrix production while maintaining enhanced gene expression, compared to constructs not exposed to TGF-β3.
Consistent with previous studies, the MSC cultures in the present work exhibited very low levels of proliferation and produced inferior levels of ECM compared to the cultures containing ACs [8, 13]. While no difference in early GAG production was observed among any of the TGF-β3 concentrations in the MSC cultures, the two week culture period may not have been an adequate length of time to observe sufficient MSC differentiation. However, at the same time the 3 and 10 ng/ml MSC constructs, demonstrated improved chondrogenic gene expression and GAG/HYP ratios similar to the AC and co-culture constructs at the same TGF-β3 concentrations, indicating chondrogenesis in these cultures. At four weeks, even in the 10 ng/ml MSC constructs, a decrease in chondrogenic gene expression, and GAG/DNA and GAG/HYP ratios occurred, indicating that the chondrogenic phenotype was not strong enough to remain after the removal of the chondrogenic stimuli. Previously, brief exposure (1 week) of MSC cultures to high levels (100 ng/ml) of TGF-β3 was shown to be capable of inducing and maintaining MSC chondrogenesis [31]. Interestingly, a transient, 3 week exposure of MSCs to 10 ng/ml TGF-β3 led to improved equilibrium modulus and GAG accumulation, similar to the phenomenon seen in transient AC exposure; however the effect was only seen with MSCs encapsulated at a high cell density [32]. Thus, the MSC cultures in the present study may have demonstrated greater stability if cultured at a higher cell density or higher TGF-β3 concentration.
The mechanism of the enhanced stability of co-cultures was not examined in the present study. As such, further investigation is needed to elucidate the mechanism and develop potential ways to further leverage its effects. Previously, using the same co-cultures as the present study with continuous exposure to 10 ng/ml TGF-β3, an increase in the proportion of AC gene expression was observed by four weeks, indicating a decrease in the proportion of MSCs relative to ACs. This result was corroborated in the present study by the disparate proliferation of ACs and MSCs in monocultures. By four weeks, the gene expression appeared to be almost completely from ACs [13]. However, at two weeks, a significant portion of MSCs was still detected. If the enhanced stability of the co-cultures is directly due to the presence of active MSCs, rather than a sustained effect of their presence at a previous point in culture, the magnitude of this effect may diminish over the duration of the culture, as the proportion of MSCs decreases. Furthermore, the co-culture ratio may be a significant factor in this effect and possibly should be investigated in future studies.
Conclusions
The current work evaluated the sensitivity of co-cultures of ACs and MSCs to TGF-β3 by quantifying the synthetic capacity and chondrogenic gene expression of the cultures after exposure to a range of TGF-β3 concentrations over two weeks of culture. The results demonstrated that while TGF-β3 was able to enhance the chondrogenic phenotype of ACs and MSCs, AC/MSC co-cultures required a reduced concentration of TGF-β3 in order to achieve enhanced chondrogenesis compared to either cell type alone. Furthermore, the present study evaluated the stability of the cell phenotypes after the removal of TGF-β3 from the culture medium. Here, it was demonstrated that the phenotype of the co-cultures was more stable upon the removal of chondrogenic stimuli compared to either cell type alone. Thus, these results demonstrate that co-cultures can be used to effectively reduce the magnitude or duration of TGF-β3 exposure while achieving an equal level of chondrogenesis compared to AC or MSC monocultures.
Figure 8.
Histological evaluation of AC (A and B) and co-cultured (C and D) constructs after four weeks of culture. Staining with Alcian Blue for GAGs (A and C) and Picrosirius Red for collagen with Fast Green for cells (B and D). Scale bar represents 200 μm in all images.
Acknowledgements
This work was supported by the National Institutes of Health grant R01 AR057083.
Footnotes
Publisher's Disclaimer: This is a PDF file of an unedited manuscript that has been accepted for publication. As a service to our customers we are providing this early version of the manuscript. The manuscript will undergo copyediting, typesetting, and review of the resulting proof before it is published in its final citable form. Please note that during the production process errors may be discovered which could affect the content, and all legal disclaimers that apply to the journal pertain.
References
- 1.Brittberg M, Peterson L, Sjogren-Jansson E, Tallheden T, Lindahl A. Articular cartilage engineering with autologous chondrocyte transplantation. A review of recent developments. J Bone Joint Surg Am. 2003;85-A(Suppl 3):109–15. doi: 10.2106/00004623-200300003-00017. [DOI] [PubMed] [Google Scholar]
- 2.Keeney M, Lai JH, Yang F. Recent progress in cartilage tissue engineering. Curr Opin Biotech. 2011;22:734–40. doi: 10.1016/j.copbio.2011.04.003. [DOI] [PubMed] [Google Scholar]
- 3.Johnstone B, Hering TM, Caplan AI, Goldberg VM, Yoo JU. In vitro chondrogenesis of bone marrow-derived mesenchymal progenitor cells. Exp Cell Res. 1998;238:265–72. doi: 10.1006/excr.1997.3858. [DOI] [PubMed] [Google Scholar]
- 4.Bian L, Zhai DY, Mauck RL, Burdick JA. Coculture of human mesenchymal stem cells and articular chondrocytes reduces hypertrophy and enhances functional properties of engineered cartilage. Tissue Eng Pt A. 2011;17:1137–45. doi: 10.1089/ten.tea.2010.0531. [DOI] [PMC free article] [PubMed] [Google Scholar]
- 5.Abrahamsson CK, Yang F, Park H, Brunger JM, Valonen PK, Langer R, et al. Chondrogenesis and mineralization during in vitro culture of human mesenchymal stem cells on three-dimensional woven scaffolds. Tissue Eng Pt A. 2010;16:3709–18. doi: 10.1089/ten.tea.2010.0190. [DOI] [PMC free article] [PubMed] [Google Scholar]
- 6.Pelttari K, Winter A, Steck E, Goetzke K, Hennig T, Ochs BG, et al. Premature induction of hypertrophy during in vitro chondrogenesis of human mesenchymal stem cells correlates with calcification and vascular invasion after ectopic transplantation in SCID mice. Arthritis Rheum. 2006;54:3254–66. doi: 10.1002/art.22136. [DOI] [PubMed] [Google Scholar]
- 7.Liao JH, Guo XA, Grande-Allen KJ, Kasper FK, Mikos AG. Bioactive polymer/extracellular matrix scaffolds fabricated with a flow perfusion bioreactor for cartilage tissue engineering. Biomaterials. 2010;31:8911–20. doi: 10.1016/j.biomaterials.2010.07.110. [DOI] [PMC free article] [PubMed] [Google Scholar]
- 8.Giovannini S, Diaz-Romero J, Aigner T, Heini P, Mainil-Varlet P, Nesic D. Micromass co-culture of human articular chondrocytes and human bone marrow mesenchymal stem cells to investigate stable neocartilage tissue formation in vitro. Eur Cells Mater. 2010;20:245–59. doi: 10.22203/ecm.v020a20. [DOI] [PubMed] [Google Scholar]
- 9.Sabatino MA, Santoro R, Gueven S, Jaquiery C, Wendt DJ, Martin I, et al. Cartilage graft engineering by co-culturing primary human articular chondrocytes with human bone marrow stromal cells. J Tissue Eng Regen Med. 2012 doi: 10.1002/term.1661. Ahead of print (doi: 10.1002/term.1661) [DOI] [PubMed] [Google Scholar]
- 10.Huang AH, Stein A, Mauck RL. Evaluation of the complex transcriptional topography of mesenchymal stem cell chondrogenesis for cartilage tissue engineering. Tissue Eng Pt A. 2010;16:2699–708. doi: 10.1089/ten.tea.2010.0042. [DOI] [PMC free article] [PubMed] [Google Scholar]
- 11.Mo XT, Guo SC, Xie HQ, Deng L, Zhi W, Xiang Z, et al. Variations in the ratios of co-cultured mesenchymal stem cells and chondrocytes regulate the expression of cartilaginous and osseous phenotype in alginate constructs. Bone. 2009;45:42–51. doi: 10.1016/j.bone.2008.07.240. [DOI] [PubMed] [Google Scholar]
- 12.Rothenberg AR, Ouyang L, Elisseeff JH. Mesenchymal stem cell stimulation of tissue growth depends on differentiation state. Stem Cells Dev. 2011;20:405–14. doi: 10.1089/scd.2010.0097. [DOI] [PMC free article] [PubMed] [Google Scholar]
- 13.Meretoja VV, Dahlin RL, Kasper FK, Mikos AG. Enhanced chondrogenesis in co-cultures with articular chondrocytes and mesenchymal stem cells. Biomaterials. 2012;33:6362–9. doi: 10.1016/j.biomaterials.2012.05.042. [DOI] [PMC free article] [PubMed] [Google Scholar]
- 14.Meretoja VV, Dahlin RL, Wright S, Kasper FK, Mikos AG. The effect of hypoxia on the chondrogenic differentiation of co-cultured articular chondrocytes and mesenchymal stem cells in scaffolds. Biomaterials. 2013;34:4266–73. doi: 10.1016/j.biomaterials.2013.02.064. [DOI] [PMC free article] [PubMed] [Google Scholar]
- 15.Wu L, Prins HJ, Helder MN, van Blitterswijk CA, Karperien M. Trophic effects of mesenchymal stem cells in chondrocyte co-cultures are independent of culture conditions and cell sources. Tissue Eng Pt A. 2012;18:1542–51. doi: 10.1089/ten.TEA.2011.0715. [DOI] [PubMed] [Google Scholar]
- 16.Tsuchiya K, Chen GP, Ushida T, Matsuno T, Tateishi T. The effect of coculture of chondrocytes with mesenchymal stem cells on their cartilaginous phenotype in vitro. Mat Sci Eng C-Bio S. 2004;24:391–6. [Google Scholar]
- 17.Fischer J, Dickhut A, Rickert M, Richter W. Human articular chondrocytes secrete parathyroid hormone-related protein and inhibit hypertrophy of mesenchymal stem cells in coculture during chondrogenesis. Arthritis Rheum. 2010;62:2696–706. doi: 10.1002/art.27565. [DOI] [PubMed] [Google Scholar]
- 18.Dahlin RL, Meretoja VV, Ni M, Kasper FK, Mikos AG. Hypoxia and flow perfusion modulate proliferation and gene expression of articular chondrocytes on porous scaffolds. AIChE Journal. 2013;59:3158–66. [Google Scholar]
- 19.Pham QP, Sharma U, Mikos AG. Electrospun poly(epsilon-caprolactone) microfiber and multilayer nanofiber/microfiber scaffolds: characterization of scaffolds and measurement of cellular infiltration. Biomacromolecules. 2006;7:2796–805. doi: 10.1021/bm060680j. [DOI] [PubMed] [Google Scholar]
- 20.Schmittgen TD, Livak KJ. Analyzing real-time PCR data by the comparative C(t) method. Nat Protoc. 2008;3:1101–8. doi: 10.1038/nprot.2008.73. [DOI] [PubMed] [Google Scholar]
- 21.Chen FM, Zhang M, Wu ZF. Toward delivery of multiple growth factors in tissue engineering. Biomaterials. 2010;31:6279–308. doi: 10.1016/j.biomaterials.2010.04.053. [DOI] [PubMed] [Google Scholar]
- 22.Adolphe M. Biological Regulation of the Chondrocytes. CRC Press, Inc.; Boca Raton, FL: 1992. [Google Scholar]
- 23.Van der kraan P, Vitters E, Van den berg W. Differential effect of transforming growth-factor-beta on freshly isolated and cultured articular chondrocytes. J Rheumatol. 1992;19:140–5. [PubMed] [Google Scholar]
- 24.Van Osch GJVM, Van der Veen SW, Buma P, Verwoerd-Verhoef HL. Effect of transforming growth factor-beta on proteoglycan synthesis by chondrocytes in relation to differentiation stage and the presence of pericellular matrix. Matrix Biol. 1998;17:413–24. doi: 10.1016/s0945-053x(98)90101-9. [DOI] [PubMed] [Google Scholar]
- 25.Melrose J, Hayes AJ, Whitelock JM, Little CB. Perlecan, the “jack of all trades” proteoglycan of cartilaginous weight-bearing connective tissues. Bioessays. 2008;30:457–69. doi: 10.1002/bies.20748. [DOI] [PubMed] [Google Scholar]
- 26.Guilak F, Alexopoulos LG, Upton ML, Youn I, Choi JB, Cao L, et al. The pericellular matrix as a transducer of biomechanical and biochemical signals in articular cartilage. Ann Ny Acad Sci. 2006;1068:498–512. doi: 10.1196/annals.1346.011. [DOI] [PubMed] [Google Scholar]
- 27.Shi S, Mercer S, Eckert GJ, Trippel SB. Growth factor regulation of growth factors in articular chondrocytes. J Biol Chem. 2009;284:6697–704. doi: 10.1074/jbc.M807859200. [DOI] [PMC free article] [PubMed] [Google Scholar]
- 28.Ng KW, O'Conor CJ, Kugler LE, Cook JL, Ateshian GA, Hung CT. Transient supplementation of anabolic growth factors rapidly stimulates matrix synthesis in engineered cartilage. Ann Biomed Eng. 2011;39:2491–500. doi: 10.1007/s10439-011-0356-8. [DOI] [PMC free article] [PubMed] [Google Scholar]
- 29.Lima EG, Bian L, Ng KW, Mauck RL, Byers BA, Tuan RS, et al. The beneficial effect of delayed compressive loading on tissue-engineered cartilage constructs cultured with TGF-beta 3. Osteoarthr Cartilage. 2007;15:1025–33. doi: 10.1016/j.joca.2007.03.008. [DOI] [PMC free article] [PubMed] [Google Scholar]
- 30.Byers BA, Mauck RL, Chiang IE, Tuan RS. Transient exposure to transforming growth factor beta 3 under serum-free conditions enhances the biomechanical and biochemical maturation of tissue-engineered cartilage. Tissue Eng Pt A. 2008;14:1821–34. doi: 10.1089/ten.tea.2007.0222. [DOI] [PMC free article] [PubMed] [Google Scholar]
- 31.Kim M, Erickson IE, Choudhury M, Pleshko N, Mauck RL. Transient exposure to TGF-beta 3 improves the functional chondrogenesis of MSC-laden hyaluronic acid hydrogels. J Mech Behav Biomed. 2012;11:92–101. doi: 10.1016/j.jmbbm.2012.03.006. [DOI] [PMC free article] [PubMed] [Google Scholar]
- 32.Huang AH, Stein A, Tuan RS, Mauck RL. Transient exposure to transforming growth factor Beta 3 improves the mechanical properties of mesenchymal stem cell-laden cartilage constructs in a density-dependent manner. Tissue Eng Pt A. 2009;15:3461–72. doi: 10.1089/ten.tea.2009.0198. [DOI] [PMC free article] [PubMed] [Google Scholar]


