

Abstract
Animals use vision to perform such diverse behaviors as finding food, interacting socially with other animals, choosing a mate, and avoiding predators. These behaviors are complex and the visual system must process color, motion, and pattern cues efficiently so that animals can respond to relevant stimuli. The visual system achieves this by dividing visual information into separate pathways, but to what extent are these parallel streams separated in the brain? To answer this question, we recorded intracellularly in vivo from 105 morphologically identified neurons in the lobula, a major visual processing structure of bumblebees (Bombus impatiens). We found that these cells have anatomically segregated dendritic inputs confined to one or two of six lobula layers. Lobula neurons exhibit physiological characteristics common to their respective input layer. Cells with arborizations in layers 1–4 are generally indifferent to color but sensitive to motion, whereas layer 5–6 neurons often respond to both color and motion cues. Furthermore, the temporal characteristics of these responses differ systematically with dendritic branching pattern. Some layers are more temporally precise, whereas others are less precise but more reliable across trials. Because different layers send projections to different regions of the central brain, we hypothesize that the anatomical layers of the lobula are the structural basis for the segregation of visual information into color, motion, and stimulus timing.
Keywords: insect, color, motion, precision, reliability, lobula
Introduction
The visual world presents an abundance of information that animals break down into features, such as color and motion, and then process along separate but interacting pathways. In vertebrates, pathways diverge early on into different anatomical routes (Hubel and Livingstone, 1987; Callaway, 2005), prompting the question of how these streams are finally integrated to inform behavior. Unfortunately, the complexity of cortical circuits and the difficulty of recording and labeling neurons in awake vertebrates in vivo make it challenging to match the anatomy of an individual neuron with its function.
The visual system of the bee provides a valuable tool for investigating the significance of the segregation of visual information. The nervous system of the bee is simpler than that of vertebrates, but its visual system is functionally rich and in many ways similar to mammalian visual pathways. Like primates, bees possess trichromatic color vision (Menzel and Blakers, 1976; Backhaus et al., 1987; Backhaus, 1992; Vorobyev et al., 2001), motion vision (Lehrer et al., 1988), and extensive visual learning capabilities (Srinivasan, 1993; Srinivasan and Zhang, 1998; Menzel and Giurfa, 2006; Giurfa, 2007). Bees have also been shown, behaviorally, to use parallel pathways for processing motion and color cues. Detection of orientation, optic flow, and motion by bees is dependent on achromatic cues (Kaiser and Liske, 1972; Giger and Srinivasan, 1996; Chittka and Tautz, 2003), whereas they can learn patterns using color information (Srinivasan and Lehrer, 1988). Furthermore, bees can learn shapes using color, motion, or pattern cues (Zhang et al., 1995), indicating that color and motion pathways converge in the bee brain. How is the bee brain organized to implement this parallel processing of visual information?
We begin to answer this question by examining neurons belonging to the lobula, a third-order visual processing structure in the bee brain. The flow of visual information in the bee eye begins in the retina, which sends its inputs to visual processing centers, the lamina, and the medulla, which input to the lobula. Neurons in the lobula exhibit a variety of functional responses similar to those seen in the mammalian visual system: achromatic directional and nondirectional motion sensitivity, spatially antagonistic receptive fields, orientation selectivity, and color opponency (Menzel, 1973; Kien and Menzel, 1977a,b; Hertel, 1980; DeVoe et al., 1982; Hertel and Maronde, 1987; Hertel et al., 1987; Maddess and Yang, 1997; Yang et al., 2004).
We sought to determine whether the six anatomical layers within the lobula represent the physical segregation of visual processing that enables parallel processing (Cajal and Sanchez, 1915; Ribi and Scheel, 1981). We presented color and motion stimuli to bumblebees (Bombus impatiens) while recording intracellularly from lobula neurons. We morphologically characterized 105 lobula neurons and found that these neurons could be classified by their branching patterns in the layers. Color sensitivity was differentially distributed across the layers, but motion sensitivity was not. In addition, there were different temporal response properties between layers, indicating that the layers represent parallel streams of visual processing that use different coding strategies to convey information.
Materials and Methods
Animals and preparation.
Bumblebees (Bombus impatiens) were acquired from commercially available colonies (Biobest Biological Services; International Technology Services). Although visual learning and memory have been studied more thoroughly in honeybees, both groups have demonstrated visual learning and memory capabilities [honeybees (Srinivasan and Zhang, 1998); bumblebees, (Ney-Nifle et al., 2001)], are closely related (Roig-Alsina and Michener, 1993; Schultz et al., 2001), and have similar anatomical brain structures (Mares et al., 2005). Bumblebees, however, are more robust and allow for longer recordings. We selected relatively large bumblebees of unknown age for osmium staining (n = 2), for mass fills of neurons (n = 3), for Bodian staining (n = 6), for immunohistochemistry labeling (n = 12), and for recording (n = 70). The animals were cold anesthetized and immobilized in plastic tubes and the brain was exposed for recording, with insect saline applied at intervals (Baumann and Hadjilazaro, 1972).
Intracellular recording procedure.
Borosilicate thin-walled glass electrodes (tip resistances, 70–120 MΩ with 1 m KCl) were pulled from capillary tubes (A-M Systems) on a laser based micropipette puller (model P-2000; Sutter Instrument). Micropipettes were backfilled with either: Lucifer yellow (200 μm in 0.5 m LiCl) or one of three Alexa Fluor hydrazide dyes (excitation spectra at 568, 633, or 647 nm, 200 μm in 1 m KCl, Invitrogen). The dendrites or axons spiking neurons in the bee lobula were penetrated with the dye-filled electrodes. Intracellular signals were amplified (NeuroProbe 1600; A-M Systems), viewed on an oscilloscope, and recorded on a computer using a Power Lab data acquisition board (ADInstruments). Data were captured at 20 kHz and saved for off-line analysis. Animals were presented with an array of visual stimuli (n = 70) (see below), and at the end of each experiment the penetrated neuron was labeled with the dye by injecting a current of −2 to −5 nA at 1 Hz for 1–3 min. Brain tissue was then processed as described below.
Anatomy: brain structures and interconnections.
To delineate the brain structures in reference brains, we used osmium staining on an additional two bees as described by Mares et al. (2005). After formaldehyde fixation, brains were impregnated with 1% aqueous osmium tetroxide for 2–3 h, rinsed, and plastic embedded and sectioned as described below. We then reconstructed the components of the brain, including the lobula, in three dimensions using a custom program in Matlab (Mathworks).
To examine the connections between the lobula and the medulla, we performed mass fills of bee brain neurons using the procedure described by Ehmer and Gronenberg (2002) on an additional three bees. Briefly, the brain was exposed and fine-tipped capillary tubes coated with crystals of Texas Red or fluorescein conjugated to 3000 MW dextran (Invitrogen) were used to penetrate the medulla. The area was sealed with wax and the bee was kept at 4°C overnight. The next day, the brain tissue was processed as described below.
Histology of brains with fluorescent neural fills and osmium staining.
We processed the brains that were filled with dye intracellularly, brains with mass fluorescent fills, and brains with osmium staining using the same sectioning and embedding procedure. A fixative solution (4% paraformaldehyde solution in buffered insect saline, pH 6.9) was applied to the brain before dissection. The brains were dissected, rinsed, and dehydrated using increasing concentrations of ethanol and embedded in Spurr's low-viscosity medium (Electron Microscopy Sciences). The resulting plastic blocks were sectioned at 10–20 μm using a sliding microtome and mounted on slides with Cytoseal (Apogent). Images of the brain sections were recorded using a Nikon PCM 2000 confocal laser microscope with argon and HeNe lasers (Nikon). Entire neurons across all plastic sections where the neural processes were present were reconstructed in two-dimensional projections from the image stacks or in three dimensions using a custom Matlab program. The two-dimensional projection images were adjusted for brightness and contrast using Photoshop (Adobe Systems).
Bodian protocol.
To examine the layout and anatomy of large numbers of individual neurons within the lobula, we used the Bodian reduced silver staining protocol similar to the procedure described by Gregory (1980) on an additional six bees. Brains were removed from the head capsule and fixed overnight at 4°C in 64% ethyl alcohol, 5% acetic acid, and 3.75% Formalin). After fixation, the tissue was dehydrated and embedded in paraffin (Paraplast+; Oxford Labware). Paraffin blocks were cut into 15 μm sections and mounted on slides coated with albumin. The tissue was then deparaffinized and rehydrated before incubation in protargol solution: 2.5 g of silver protein (Alfa Aeser) and 2 g of metallic copper in 250 ml of distilled water. After 23 h at 60°C, slides were removed from the protargol solution and processed through 1% hydroquinone and 5% sodium sulfite for 5 min, 1% gold chloride under bright light for 7 min, 1% oxalic acid for 5 min, and 2.5% sodium thiosulfate for 5 min. Sections were again dehydrated and then coverslipped using Entellan (Merck).
Immunohistochemistry.
Tissue from an additional 12 bumblebees was labeled for serotonin (5-HT)-like (n = 6) and GABA-like (n = 6) immunoreactivity using the protocol described by Dacks et al. (2006). Briefly, brains were dissected and then fixed overnight in 4% paraformaldehyde at 4°C. Brains were embedded in 5% low-melting point agarose (Sigma) and sectioned the following day at 100 μm using a vibrating microtome (Technical Products International). Sections were washed in PBS with 0.5% Triton X-100 (PBST), and then blocked for 1 h (2% normal goat serum) and incubated overnight at room temperature with primary antibody (1:4000 rabbit anti-5-HT; Immunostar; or 1:500 rabbit anti-GABA; Sigma) in PBST. The following day, sections were washed, blocked, and then incubated overnight at room temperature with Cy3-labeled secondary antibody (1:500 goat anti-rabbit; Jackson ImmunoResearch) in PBST. The following day, sections were washed in PBS, cleared in an ascending glycerol series (40, 60, and 80%), and mounted on glass slides in 80% glycerol.
Visual stimuli during the intracellular recording procedure.
Color and motion stimuli were presented to the right eye of the bee, ipsilateral to the side of the recording (see Fig. 1A,B). The stimuli are discussed separately below.
Figure 1.

Visual stimulus setup and analysis methods. A, Motion stimuli were presented to the bee using a computer monitor (black rectangle), whereas color stimuli were presented using an LED array with 20 blue, green, and violet LEDs each arranged in a semirandom pattern. Both stimuli were presented to the bee's right eye, but are presented on either side here for visualization purposes. B, The motion stimuli used are represented in i–v, which included black or white large oriented bars (i, ii), small moving targets (iii), a large moving edge (iv), and a high-contrast grating (v). Each stimulus was moved in eight different directions, which are indicated in vi. C, We measured the precision and reliability of the spike times across five trials of repeated light flashes. i, ii, We calculated a PSTH (bin width, 0.1) from the raster plot (i) and convolved the PSTH with a Gaussian curve (half-width, 8 ms). iii, iv, We detected events three SDs above the mean (black peak, iii) and measured the spike-time precision and response reliability of the spikes across trials during the event (black spikes under the asterisk; iv).
Color stimuli during the intracellular recording procedure.
Colored light flashes were produced by an array of 60 light-emitting diodes (LEDs; J and E Electronic): 20 each of violet, blue, and green (see Fig. 1A) (peak wavelengths: violet, 404 nm; blue, 476 nm; green, 561 nm, with an average half-peak width of 22.13 ± 8.86 nm). The violet, blue, and green LEDs did not match the short (UV), medium (blue), and long (green) wavelength photoreceptor types in bumblebees (Peitsch et al., 1992). The violet LEDs could produce the strongest response in the medium (blue) photoreceptor type (eliciting 80% of the peak response) (Peitsch et al., 1992). In addition, the blue LEDs could produce equal relative responses in the medium (blue) and long (green) photoreceptor types (Peitsch et al., 1992). However, the violet LEDs were the only LEDs that could stimulate the short-wavelength-sensitive photoreceptors because there was no overlap of the blue or green LED wavelengths with the short-wavelength-sensitive photoreceptor sensitivity curves in bumblebees (Peitsch et al., 1992). Although additional studies are necessary to determine the exact sensitivity of the bumblebee photoreceptors to these wavelengths and how bumblebees would respond behaviorally to these colors at different intensity levels, we found the relative distribution of the LED colors made it possible to discriminate the color sensitivities of individually recorded neurons.
All three LEDs were adjusted with resistors to have the same relative intensity level at 450 photons/count per LED, measured using a fixed grating spectrometer (Ocean Optics model S2000). The approximate illuminance at the level of the ommatidia originating from the entire LED array (blue, green, and violet LEDs) was estimated using a luminance meter (Mastech LX1330) to be ∼1400 lux. Although this illuminance level is what a human observer might encounter under overcast skies, the illuminance level experienced by bumblebees is likely different because the illuminance values we measured were weighted to the human perception of brightness. Nevertheless, we found that bumblebees would easily fly at this illuminance level in a flight cage.
The LED array was arranged in a half circle such that the long axis of the array aligned with the long axis of the bee eye, spanning 2.9° by 123.3° of the visual field (see Fig. 1A). The array could be moved out and away from the bee to test motion stimuli. To test chromatic sensitivity, we lit the individual arrays of violet (v), blue (b), or green (g) LEDs or in four different combinations (bg, bv, gv, and bgv). Each stimulus was presented as five 500 ms LED light flashes at 1 Hz. The receptive fields of individual neurons were tested by lighting groups of LEDs at a time along the longitudinal axis (on the stationary LED array).
Motion stimuli during the intracellular recording procedure.
The motion stimuli were presented on a cathode ray tube (CRT) monitor (vertical refresh rate of 160 Hz; Gateway 2000, EV900) controlled by a computer with a Radeon 9800 Pro video card (ATI Technologies), which subtended 114.0° by 103.1° of the visual field of one eye (see Fig. 1A). To determine whether the bumblebee visual system would phase lock to 160 Hz, we recorded extracellularly from photoreceptors in bumblebees while presenting light at the same luminance levels as the CRT monitor at various frequencies, including 160 Hz. We found that the photoreceptors did not produce membrane potential fluctuations at 160 Hz, which indicated that the photoreceptors integrated the flicker at this frequency and at the illuminance levels we used (see below).
The illuminance at the level of the ommatidia facing the monitor was estimated to be 330 lux (white bars) using a Mastech LX1330 light meter measuring output directly at the monitor. This does not represent the overall illumination at eye level (as expressed by standard lux values, which would integrate the entire “dark” hemisphere surrounding the monitor), but gives an indication of what the individual photoreceptors may have received. This light level is lower than daylight conditions but is, in our experience, sufficient for bumblebees to fly in a flight cage.
Four types of motion stimuli were computer-generated using Vision Egg software (see Fig. 1B) (Straw et al., 2006) that included the following: a wide field high-contrast square-wave moving grating (filling the entire computer screen, at a spatial frequency of 12.89°, moving at a rate of 57.2°/s), a small moving bar (subtending 3.85° by 16.2°, moving at a rate of 73.57°/s), a large moving bar (either a black bar on white background or a white bar on black background; subtending 9.04° by 103.1°, moving at a rate of 54.25°/s), and a moving black edge on a white background (filling the entire computer screen, moving at a rate of 87.69°/s). Each stimulus was moved in eight different directions (up, down, left, right and 45° to these respective directions) and four different orientations (see Fig. 1B). Luminance changes of the CRT monitor resulting from the visual stimuli were measured by a photodiode and recorded with the neuronal signals.
Analysis of responses to visual stimuli.
Membrane potential traces were imported into Matlab, down-sampled to a resolution of 0.1 ms, and filtered to remove high-frequency (>2000 Hz) and low-frequency (<50 Hz) noise. Electrical noise from the LED relay switches was also removed by averaging out the membrane potential 0.75 ms around each noise spike. The time and mean frequency of action potentials was measured by detecting spikes above a set threshold. These spike times were then used to calculate the coefficient of variation (CV; SD of the interspike intervals/mean value of the interspike intervals) during background activity. A significant response to a visual cue was defined as a change in spike rate >2 times above or below the SD of the mean background spiking activity. Definitions of how we categorized the neural responses to the visual cues are described in the Results and laid out in supplemental Table 1 (available at www.jneurosci.org as supplemental material).
Responses to individual presentations of a stimulus were used to determine the chromatic and motion preferences of each neuron, and responses to trains of light flashes were used to analyze the habituation, precision, and reliability of each response. Habituation was identified when a neuron responded significantly to the first light flash but not to the subsequent light flashes. Other measures are defined below.
Spike-time precision and response reliability.
To determine whether different regions of the lobula encode visual information using different strategies, we calculated spike-timing precision and response reliability across repeated trials using procedures similar to those described by Mainen and Sejnowski (1995), Schreiber et al. (2003), and Tiesinga et al. (2008) (see Fig. 1D). The terms precision and reliability address two temporal properties of neurons and have been used extensively in studies involving vertebrate visual cortex to measure the temporal properties of spiking neurons (for review, see Tiesinga et al., 2008). First, spike-time precision measures the jitter of the spike times across trials (see below), which directly relates to the timing of the neural responses. Response reliability, however, was used to measure the consistency of the responses of the neurons across trials.
To measure spike-time precision and response reliability, we first calculated a peristimulus time histogram (PSTH; bin size, 0.1 ms) for each set of trials was convolved with a Gaussian curve (half-width, 8 ms). Events were defined as periods when the firing rate was at least three times the SD above the mean binned activity across trials within the PSTHs (see Fig. 1D). To calculate spike-time precision, a measure of the temporal jitter of the spikes within events, we used the following equation: spike-time precision = E/Σ σe, where E is the number of events, and σe is the SD of the individual spike times in event e. Response reliability, the fraction of spikes across trials which occurred during the events relative to those outside of the events, was calculated with the following equation: response reliability = 1/T × Σ (Σ Ne/Nt), where Σ Ne is the sum of number of spikes within each event, Nt is the number of spikes across trials outside of events, and T is the number of trials. Statistical comparisons of measurements between cell groups or stimuli were made using the Mann–Whitney U test.
Results
We recorded from and morphologically identified 105 neurons in the bumblebee lobula, a neuropil within the optic lobes. Here, we describe the layered structure of the bumblebee lobula and show that it is almost identical to its counterpart in the honey bee (Ribi and Scheel, 1981). Then, we describe how the branches of characterized neurons segregate anatomically into lobula layers. Finally, we address how these groups of neurons differ in their responses to color, motion, and in their temporal response properties.
Because the lobula processes various types of visual information, we used a wide array of stimuli to characterize the response properties of each neuron from which we recorded. The differences between lobula layers are most clear when comparing responses to each class of stimuli so we have structured the results below into descriptions of (1) the segregation of color processing, (2) the segregation of motion processing, (3) layers that process both color and motion, (4) which layers demonstrate habituation, and (5) the differences between layers in spike-time precision and response reliability. Although the data set is extensive and includes information on several aspects of each neuron, our argument focuses on how the physiological differences between lobula layers map to the lobula as a whole.
The lobula exhibits a columnar and noncolumnar layered organization
The honeybee lobula is composed of six anatomical layers (Ribi and Scheel, 1981), which can also be clearly seen in horizontally sectioned Bodian preparations of the bumblebee brain (Fig. 2B). The posterior layers (labeled 1 through 3, from the most posterior forward) show a columnar, regular arrangement of projections. This columnar arrangement is also present in the next layer, 4, but this stratum was dominated by large, longitudinal projections. In layers 5 and 6, large neurites dominated, which were not arranged into an ordered array (Fig. 2B), but rather looped around each other while predominantly remaining within layers 5 and 6.
Figure 2.
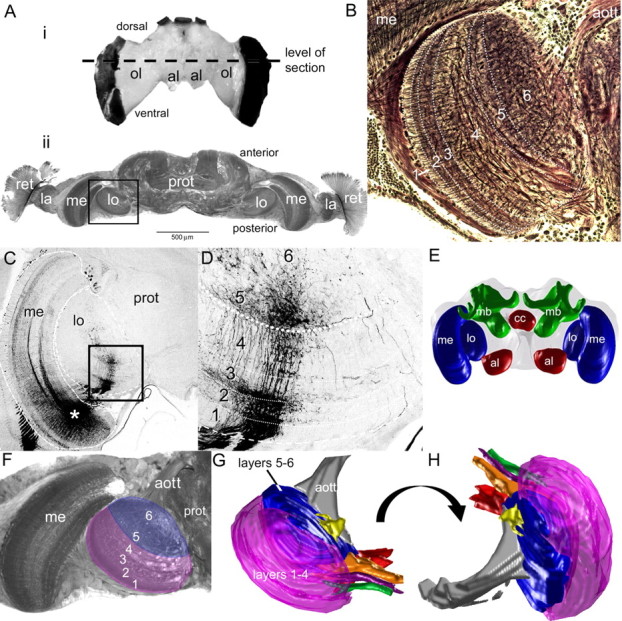
Bee brain structure. Ai, The bumblebee brain. Aii, A horizontal section of the bee brain stained with osmium taken from the level of the dashed lines in Ai. Specific areas of the optic lobe subdivisions are indicated: the retina (ret), the lamina (la), the medulla (me), and the lobula (lo), as well as the central protocerebrum (prot). B, Bombus impatiens lobula structure. Reduced silver Bodian staining, six layers can be seen within the lobula, which progress from the outer portion of the lobula (i.e., layers 1–3) to the inner, or proximal, regions of the lobula (i.e., layers 4–6). The distal layers (1–4) contain a spatially ordered arrangement interspersed with horizontal branching. In addition, larger processes dominate layer 4. The arrangement breaks down in layers 5 and 6, where the large processes form a complex network. C, Input to the lobula, which follow the internal structure of the layers (site of dye injection at the asterisk). D, In this mass fill of medullar neurons, the input to the lobula is clearly columnar in the outer, or distal, regions of the lobula, which disappears in the inner layers 5 and 6. E, Multiple sections of the brain can be used to reconstruct a three-dimensional representation of the brain, with the optic lobes (lo and me), the antennal lobes (al), the central complex (cc), and the mushroom bodies (mb). F–H, The lobula and the component layers were three-dimensionally reconstructed from individual sections (F) using a custom Matlab program. G is the same view as in A–D, whereas H is a rotated view. Note how the outer layers (1 and 4) form rinds around the inner layers (5 and 6). We also reconstructed the tracts leaving different regions of the lobula (gray, orange, green, yellow, red, and purple tracts). aott, Anterior optic tubercle tract.
Bodian preparations illustrated most of the neurites composing the general structure of the lobula, but the layered organization was also apparent in the neurites of the input neurons from the medulla, a second-order visual neuropil. Mass fills demonstrate that medullar inputs to the lobula were retinotopically ordered in layers 1–4 (Fig. 2C,D) and that the inputs to layers 5 and 6 were not organized in the same way (Fig. 2C,D). While separate layers were visible in individual two-dimensional sections, three dimensional reconstruction from osmium staining revealed that layers 1–4 form the outer shell of the lobula, covering the dorsal, ventral, posterior, and lateral edges (Fig. 2G,H). Layers 5 and 6 formed an inner core, covered by layers 1–4 except at the anterior and medial portions of the lobula (Fig. 2G,H).
Lobula layers contain different distributions of GABA and serotonin
To determine how putative inhibitory processes related to the layers and if potential neuromodulators were differentially distributed among the layers, we immunocytochemically labeled the bumblebee lobula for GABA-like and serotonin-like immunoreactivity (for simplicity, hereafter referred to simply as “GABA” and “serotonin”). As observed in the honeybee (Schäfer and Bicker, 1986), GABA was distributed differently among the lobula layers in bumblebees in a large number of neurites (Fig. 3C,D). Notably, high levels of GABA were concentrated in segments of layers 1, 2, 3, and 5. Indeed, GABA staining allowed us to identify further subdivisions of individual layers, such as layer 3 (Fig. 3C,D). In contrast to the segregated distribution of GABA among lobula layers, immunolabeling for serotonin revealed that serotonin is localized to a subset of wide-field lobula neurons, which branched in layers 2 and 4, with diffuse arborizations in layers 5 and 6 (Fig. 3E,F).
Figure 3.
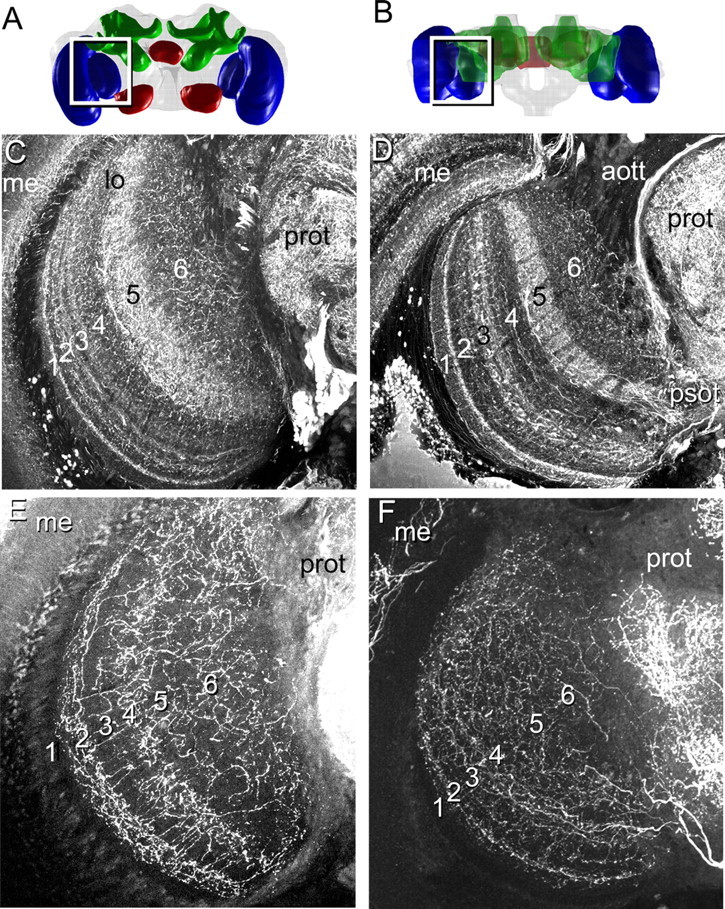
A–F, Localization of GABA-like and serotonin-like immunoreactivity within the lobula in frontal (A, C, E) and horizontal (B, D, F) views of the lobula layers. A, B, Frontal (A) and horizontal (B) three-dimensional views of the bee brain. C, D, GABA is distributed differentially among the layers in the lobula, with higher concentrations in layer 5 and in subregions of layers 1–3. E, F, Serotonergic neurons are also distributed differentially among the layers, with a high concentration of processes in layers 2 and 4, with diffuse processes in layers 5 and 6. Abbreviations are as defined in Figure 2 and Results.
Lobula neuron dendrites are segregated among the layers
Neurons in layers 1 through 4 were distinguished from those in 5 and 6 based on the morphology of their processes within the lobula. All recorded neurons fell into three separate groups based on their branching patterns within the layers of the lobula: layer 1–4 neurons (n = 60), layer 5–6 neurons (n = 33), and layer 1–6 neurons (n = 12). All the neurons belonging to the layer 1–4 and layer 5–6 groups were wide-field tangential neurons that spanned much of the lobula within their layers (Fig. 4A–D). Some of the layer 1–6 neurons were wide-field neurons (n = 6) with many branches in layers 5 and 6 and some branches in layers 2 and 3 (data not shown). However, the other recorded layer 1–6 cells (n = 6) were columnar (Fig. 4E). These columnar neurons had branches in layers 1, 2, or 3 and sent branches into layers 5 and 6. The columnar neural class represents the majority of the neurons in the lobula, but, because of our small recorded data set, we classified them as layer 1–6 neurons and merged them with the wide-field neurons also projecting into layers 2, 3, 5, and 6.
Figure 4.
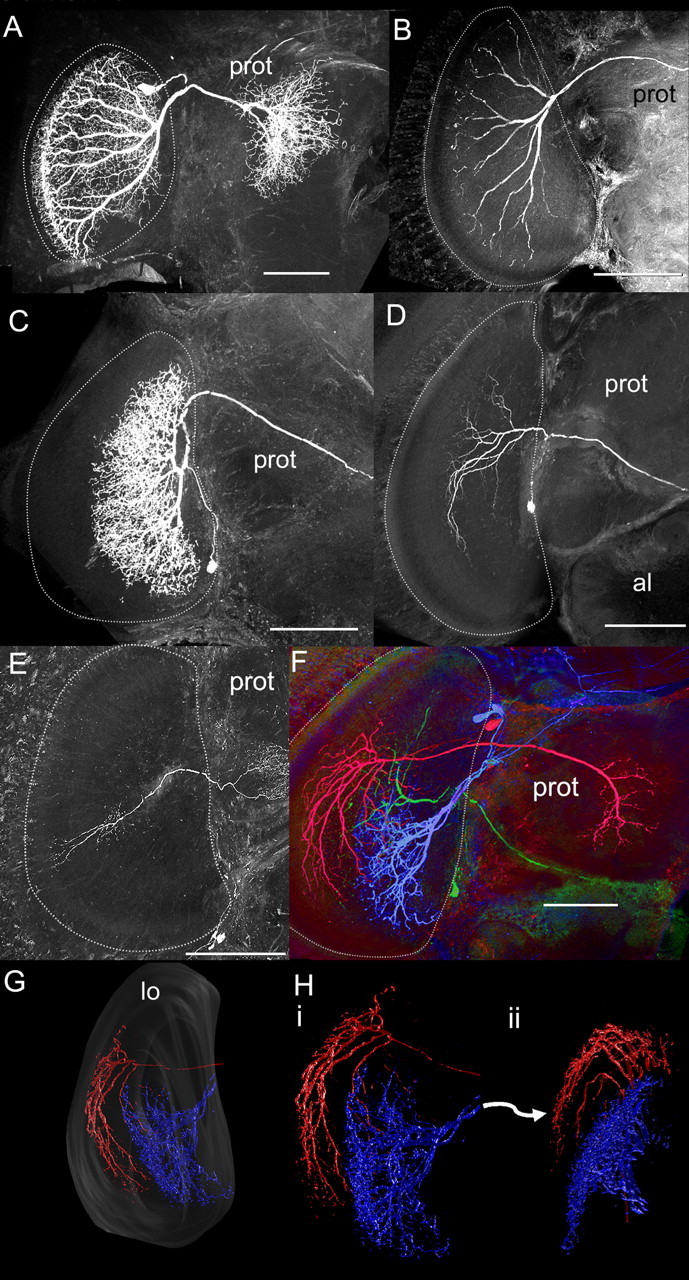
Lobula neuron morphology. A, B, Reconstructed layer 1–4 neurons filled with fluorescent dye. Note that the neurons project to the rim of the lobula and have highly regular projections. C, D, Reconstructed layer 5–6 neurons. These neurons do not project to the rim of the lobula and have less regular branching patterns. E, An example of the six recorded and filled columnar neurons. F, Multiple neurons filled in the same brain. The blue- and green-labeled neurons project to layers 5 and 6, whereas the red-labeled neuron projects to layers 3 and 4. G, H, Some of these neurons were reconstructed in three dimensions to examine their branching pattern relationships to the layers. Note how the layer 1–4 neuron (red) forms a rim around the layer 5–6 neuron (blue). A–F, The lobula is outlined with white dotted line. Scale bars, 100 μm. Abbreviations are as defined in Figure 2 and Results.
In some preparations with two or more neurons filled with different fluorescent dyes, cells branching in layers 1–4 were found juxtaposed with neurons arborizing in layers 5–6 (Fig. 4F). Reconstructions of these neurons in three dimensions confirmed that layer 1–4 neurons form an outer shell to the inner branching patterns of the layer 5–6 neurons (Fig. 4F–H). Furthermore, most layer 1–4 neurons had branching patterns that were ordered in an array (Fig. 4A,B,F–H) matching the columnar inputs from the medulla to layers 1–4 (Fig. 2D). The branching patterns of layer 5–6 neurons were complex with branches often looping back on each other (Fig. 4C,D,F–H). In the following analyses, we examined the responses of these three major groups of neurons based on anatomical classifications: layer 1–4, layer 5–6, and layer 1–6 neurons.
Altogether, we found we generally penetrated and recorded from relatively large lobula neurons (with neurite diameters >5 μm), meaning that we mostly sampled from the population of wide-field cells. Therefore, the percentages stated below may not represent the actual percentages of visual response properties within the entire lobula. Still, this data set allows us to begin to examine how lobula neurons differ across the lobula layers both morphologically and physiologically.
No differences in spontaneous activity among the lobula layers
Once neurons had been grouped into morphological categories among the lobula layers, physiological properties across groups were compared. Baseline firing frequencies ranged from 0.01 Hz to 120 Hz, with no significant differences between the layer groups (Mann–Whitney U test, p > 0.05 for all comparisons). We also sought to determine whether the variation in spike times was different between the layer categories. There was no significant difference in the CV of the interspike intervals during resting background activity between three groups (Mann–Whitney U test, p > 0.05 for all comparisons). However, the differences between the layers became evident when comparing their visual responses.
Neurons in all six layers respond to visual cues
All but four of the 105 recorded neurons responded to visual cues. They responded to either chromatic cues, motion cues, or to both types of stimuli. Our sampling procedure is likely responsible for the small number of neurons that did not respond to the visual cues. Generally, during the experiments, we would only continue to record from and fill neurons that demonstrated a clear response to at least one type of basic visual stimulus. Using this basic search method, we found the visually responsive neurons across the morphological groups that exhibited inhibitory and/or excitatory responses to visual cues. Consequently, the main differences between the groups were their selectivity for specific visual cues, such as color, and their temporal response properties.
Chromatic sensitivity is concentrated in layers 5 and 6
To examine color sensitivity in the neurons among the individual layers, we classified the neurons as broad band, narrow band, or color opponent based on their responses to each individual color (b, g, or v) and to the four combinations of the colors (bg, bv, vg, and bgv) (Fig. 4) (Kien and Menzel, 1977a,b). Broad-band neurons produced similar responses to all colors and all color combinations, essentially responding to levels in luminance (Fig. 5A). Narrow-band neurons responded to only one or two of the colors (Fig. 5B). Color opponent neurons produced different responses to individual colors and had responses indicative of an interaction between the colors during simultaneous color presentations (Fig. 5C). For example, one color opponent neuron responded to all the colors, but produced a phasic–tonic response to violet and a phasic-only response to blue or green light flashes (Fig. 5C). When violet and blue were presented together, the tonic response decreased (Fig. 5C, gray arrows), as blue inhibited the violet response. Yet, simultaneous presentation of violet and green elicited only the tonic portion of the response (Fig. 5C, black arrows).
Figure 5.

Responses to chromatic cues. We found three chromatic response types. A, Broad-band chromatic selectivity, where the neuron responded similarly to all colors and color combinations regardless of color. B, Narrow-band chromatic selectivity, where the neuron responded to one or two of the colors, but not all three. C, Chromatic opponency, where the responses to one color alter the response to another color. In this case, the neuron responds with a phasic burst to all colors, but with tonic activity to violet and somewhat to green. When blue and violet are presented together, the tonic activity is inhibited (gray arrows), but not when green and violet are presented together (black arrows). In all cases, black bars signify duration of the light flash. D, The percentage of chromatic response types among the responsive neurons in the layers. The layer 5–6 neurons have the highest percentage of color-sensitive neurons (narrow-band and color opponent), whereas most of the layer 1–4 and layer 1–6 neurons are mostly broad-band chromatically selective.
The distribution of these chromatic response types varied considerably across the bee lobula (Fig. 5D). In total, the majority of the tested layer 1–4 and layer 1–6 neurons (67% and 56%, respectively) had broad-band responses to the colors presented (i.e., color insensitive) whereas the majority of the sampled layer 5–6 neurons were narrow-band or color opponent (i.e., color sensitive; 87%) (Fig. 5D). Beyond the classifications of narrow- and broad-band response types, color opponent responses were segregated across the layers. Only 9% of layer 1–4 neurons demonstrated color opponency, whereas 48% of layer 5–6 cells demonstrated color opponency. Layer 5–6 neurons preferentially signal chromatic cues, whereas the majority of tested layer 1–4 and layer 1–6 neurons were not chromatically sensitive.
Because the colors used to test chromatic sensitivity in these neurons triggered different levels of responses in the different photoreceptor types (see Materials and Methods), we could also deduce what photoreceptor types input to each neuron recorded (listed in supplemental Table 2, available at www.jneurosci.org as supplemental material), based on previous studies of bumblebee photoreceptor wavelength sensitivities (Peitsch et al., 1992). We put forward that 82% of the tested lobula neurons may receive inputs from two or three photoreceptor types, whereas only a small percentage may receive exclusive input from single photoreceptor types (16%; the remaining 2% did not respond) (supplemental Table 2, available at www.jneurosci.org as supplemental material).
Although receptive fields were not examined in many neurons in these experiments (n = 35), we did find some of the color sensitive neurons had spatially antagonistic receptive fields (n = 4) (supplemental Table 2, available at www.jneurosci.org as supplemental material). However, we found most of the tested neurons either had wide or small receptive fields, matching the branching patterns of the neurons themselves (supplemental Table 2, available at www.jneurosci.org as supplemental material).
Motion sensitivity is encoded across layers
Because color sensitivity differed across the layers, we asked whether motion sensitivity was also segregated. We found a wide range of motion sensitivities, which we classified into three motion categories: no motion response, nondirectional motion response (Fig. 6A,C), and directional motion response (Fig. 6B,D). About two thirds of layer 1–4 and layer 5–6 neurons were motion sensitive. The majority of the tested layer 1–4 neurons were directionally motion sensitive (58%), whereas 17% were nondirectionally motion sensitive. No motion response was observed in 25% of layer 1–4 neurons. These percentages are not very different from the distribution of motion sensitivity among the layer 5–6 neurons, where 42% exhibited directional motion sensitivity, 19% exhibited nondirectional motion sensitivity, and 39% had no motion response. Thus, motion sensitivity was not anatomically segregated among the two major lobula layer groups. In contrast to the layer 1–4 and layer 5–6 neurons, only three of the nine tested layer 1–6 neurons responded to motion cues: two had directional motion responses and the third had a nondirectional motion response.
Figure 6.

Motion response types. A–D, In these examples, the neurons were presented a large moving bar (A, B) or a wide-field moving grating (C, D). The spike rates significantly changed in response to the motion cues presented. To examine the directionality, we plotted the spike rates for each direction on a polar plot for each stimulus. B, D, We found clear directionality sensitivities for some neurons. A, C, Other neurons did not exhibit clear directionality preferences. In all cases, black bars signify the duration of the motion cue. Numbers signify the direction of movement in degress relative to the eye. E, When we compared the response properties of neurons where color and motion cues were tested among the layers, we found different percentages of neurons which were sensitive to color, to motion, or to both. Notably, the layer 5–6 neurons were color and motion sensitive, whereas most of the layer 1–4 neurons were motion sensitive but color insensitive. The remaining tested neurons had no motion responses and were broadly sensitive to the different colors.
Layers 5 and 6 contain more color and motion sensitive neurons
Because we tested color and motion cues in most of the preparations (n = 84), we examined the convergence of color and motion sensitivity across the neural population. We found that motion and color sensitivity were both present in some neurons but not in others depending on their morphological characteristics. Layer 1–4 neurons tested with both color and motion cues were mostly motion sensitive but color insensitive (60%) (Fig. 6E). In contrast, the tested layer 5–6 neurons were either color sensitive but motion insensitive (31%) or they were both color and motion sensitive (58%), whereas another portion of them were color and motion insensitive (11%). Indeed, we found that 74% of all the color and motion sensitive neurons were in layers 5 and 6 (Fig. 6E). Thus, layer 1–4 neurons mainly produced achromatic motion responses whereas layer 5–6 neurons predominantly demonstrated chromatic motion responses.
Response dynamics to light flashes are segregated among the layer groups
In addition to differences in sensitivities to visual stimuli, we examined the temporal dynamics of the neurons' responses to flashes of light. Neurons in the lobula layers demonstrated a range of response dynamics to the combination blue–green–violet light flashes that could be classified into four main response types: phasic–tonic, phasic, tonic, and on–off (Fig. 7A–D). The response types did not correlate overall with differences in the spontaneous, background spiking activity. Neurons with phasic–tonic responses produced a burst of excitation followed by tonic activity for the duration of the light flash (Fig. 7A), whereas phasic responses only involved a short response during the light flash (Fig. 7B). Tonic responses involved a tonic increase or decrease in the membrane potential during the light flash that did not correlate with a significant change in spike rate (Fig. 7C). Finally, the on–off response type was characterized by a burst of excitation at the onset of the light flash and when the light was turned off (Fig. 7D).
Figure 7.

The four main response types. A, Phasic–tonic responses included a burst of excitation followed by tonic activity for the duration of the light flash. B, Phasic responses only involved a short response during the light flash. C, Tonic responses involved a tonic increase or decrease in the membrane potential during the light flash, which did not correlate with a significant change in spike rate. D, The on–off response type was characterized by a burst of excitation at the onset of the light flash and when the light was turned off. Calibration: 10 mV, 0.5 s (duration of the stimulus). E, The percentages of each lobula layer group exhibiting each of the response types. The majority of the tested layer 1–4 neurons (72%) exhibited a clear on–off response, whereas the majority of layer 5–6 neurons had tonic or phasic responses (72%).
This on–off response was found in the majority of the tested layer 1–4 neurons (72%) (Fig. 7E). In contrast, 72% of the tested layer 5–6 and 73% of the layer 1–6 neurons had phasic or tonic response types, indicating a fundamental difference in the inputs to these layers (Fig. 7E). To quantify this difference, we performed a cross-correlation analysis with a signal that represented the onset and offset of the light flashes. We found significant differences in the cross-correlation coefficients between the spike times and the on–off signal for the layer 1–4 neurons versus the layer 5–6 and layer 1–6 neurons (supplemental Fig. 1, available at www.jneurosci.org as supplemental material).
Interestingly, phasic–tonic, phasic, tonic, and on–off responses were correlated with specific classes of color and motion sensitivity (supplemental Fig. 2, available at www.jneurosci.org as supplemental material). For example, 73% of the neurons that responded to light flashes with an on–off response had broad-band responses (i.e., were not color sensitive), whereas 78% of the neurons that had phasic responses to light flashes were color sensitive (either narrow-band or color opponent). In terms of motion sensitivity, 78% of the on–off response-type neurons were directionally motion sensitive, whereas only 14% of the neurons with phasic responses to light flashes were directionally motion sensitive (supplemental Fig. 2, available at www.jneurosci.org as supplemental material). These results indicated that the response types to light flashes could be tightly correlated with the selectivity of the neurons to visual stimuli.
Layer 5–6 neurons exhibit habituation for repeated stimuli
For repeated 500-ms-long light flashes (five flashes at 1 Hz), many of the layer 5–6 (69%) and layer 1–6 (36%) neurons only responded to the first of the five light flashes, a feature we labeled habituation (Fig. 5B). In contrast, the layer 1–4 neurons generally responded similarly for each light flash (Figs. 5A, 7C,D). In fact, habituation was found in only 14% of the layer 1–4 neurons. Interestingly, the initial light flash response before habituation in layer 5–6 and layer 1–6 neurons returned if we waited 4–5 s or changed the color of the stimulus.
Layer 1–4 neurons respond more reliably, whereas layer 5–6 neurons are more precise
Response reliability refers to the ability of a cell to respond across many trials, whereas spike-time precision refers to the temporal jitter of the response, if a response occurs. Additional explanations of spike-time precision and response reliability are included in supplemental Figure 3 (available at www.jneurosci.org as supplemental material), but the main difference between these two measures is that response reliability addresses how consistently the neuron responds to stimuli across trials, whereas spike-time precision measures the spike timing during a response. For instance, response reliability decreases if the neuron habituates to the stimuli across trials, but spike-time precision measures the timing of spikes during events, which may or may not be affected by habituation. Indeed, to a large extent, reliability and precision can vary independently (Tiesinga et al., 2008).
In the bumblebee lobula, in addition to the differences in habituation and response types between the layers, there were marked differences in the spike alignment across trials (Fig. 8). In some cases, neurons did not change their firing rate in response to visual stimuli, but produced, across trials, extremely precise spike times relative to stimulus onset and in particular to the stimulus offset (Fig. 8A) (stimulus onset precision, 0.4972 ms−1; stimulus offset precision, 7.383 ms−1; note that the unit of precision is the reciprocal of time). To further examine these differences in response reliability and spike-time precision, we quantified spike-time precision and response reliability of the neurons across trials to examine whether (1) spikes occurred at precise times across repeated stimulus trials and (2) if the spikes consistently, or reliably, were generated across repeated stimulus trials (see Materials and Methods).
Figure 8.

Precision and reliability. A, B, Rasters of spike times across multiple trials of light flashes (indicated by the black bars) for five light flashes of each color (indicated by the b, g, v, and color combinations). A, The cell fires sparsely, but has highly precise spikes occurring at the onset and in particular the offset of the light flash. B, Another neuron only spikes in response to the onset and offset of the light flash, but with a barrage of activity, not necessarily with precise spikes. C, D, The spike-time precision and response reliability are calculated and compared across the layers for each color and color combination. C, Spike-time precision. The layer 5–6 neurons (white bars) have significantly higher spike-time precision values compared with layer 1–4 (black bars) neurons for all colors (b, g, v, b-v, and v-g) except the blue–green (b-g) color combination (for the significantly different values, p < 0.05). D, Response reliability. The layer 1–4 neurons (black bars) have significantly higher response reliability values for all colors (b, g, and v) and color combinations (b-v, b-g, and v-g) than the layer 5–6 neurons (white bars) (p < 0.05). Error bars represent SE. Asterisks indicate whether the layer 5–6 neurons are significantly different from the layer 1–4 neurons for each comparison.
Layer 5–6 neurons had significantly higher spike-time precision values compared with the layer 1–4 neurons for all the colors and color combinations (Fig. 8C) (Mann–Whitney U test; all comparisons except blue-green combination, p < 0.05) with the exception of the blue–green color combination (Mann–Whitney U test statistic, 829; z statistic, 1.7882; p = 0.0737). These results indicated that the neurons in layer 5–6 produce more precise spike times correlated with the stimulus onset across trials than the layer 1–4 neurons. This difference related directly to the different response dynamics to light flashes: layer 1–4 neurons produced highly irregular bursts of activity during on–off responses in sharp contrast to the regular spiking seen in the phasic and tonic responses of layer 5–6 neurons (Fig. 7B,C).
Conversely, layer 1–4 neurons had more response reliability across trials than the layer 5–6 neurons for all colors and color combinations (Fig. 8D) (Mann–Whitney U test; all comparisons, p < 0.05). This result is related directly to the fact that layer 1–4 neurons nearly always responded to each light flashes in a series, whereas many layer 5–6 neurons habituated to the stimuli or changed their responses over time. The differences in response reliability and spike-time precision suggested that the two layer groups, namely layers 1–4 and 5–6, use two different strategies for encoding stimuli: changing spike rate versus changing spike timing to encode different visual cues. This idea was supported by the fact that we found different spike-time precision and response reliability values for individual colors on the level of the entire population as well as on the level of individual neurons (data not shown).
To further confirm these results, we used two other measures of spiking variability and precision. We repeated the precision and reliability analysis at multiple temporal resolutions and obtained the same differences among the layer groups (see Materials and Methods) (supplemental Fig. 4, available at www.jneurosci.org as supplemental material). Again, layer 5–6 neurons were more precise but less reliable across multiple time scales than layer 1–4 neurons (supplemental Fig. 4, available at www.jneurosci.org as supplemental material). In another measure of the temporal aspects of the spike timing, we measured the spike-time variability across multiple time scales using the Fano factor (Fano, 1947; Teich et al., 1996) (supplemental Methods and Fig. 5, available at www.jneurosci.org as supplemental material) and found that the layer 5–6 and layer 1–6 neurons had significantly lower spike-time variability during light flashes compared with the layer 1–4 neurons (supplemental Fig. 5, available at www.jneurosci.org as supplemental material).
As to the third category of neurons, there were no significant differences in the response reliability or the spike-timing precision between the layer 1–4 and layer 1–6 neurons (Fig. 8C) (Mann–Whitney U test; all comparisons, p > 0.05). However, the layer 1–6 neurons had significantly lower spike-time precision values than the layer 5–6 neurons for the green and blue–green color combination (Fig. 8C) (Mann–Whitney U test; both comparisons, p < 0.05) and significantly higher response reliability values for the blue–green–violet color combination (Fig. 8D) (Mann–Whitney U test statistic, 260; z statistic, 2.4481; p = 0.0144). The spike-time precision and response reliability values were not significantly different between layer 5–6 and layer 1–6 neurons for all other colors and color combinations (Fig. 8C,D) (Mann–Whitney U test; all other comparisons, p > 0.05).
Layer 1–4 and layer 5–6 neurons exit the lobula along different tracts
Because the lobula layers demonstrated significant differences in response properties, we wanted to examine whether the information was further segregated as the information is sent from the lobula to the central brain. We examined the lobula neurons to determine whether the layers also projected differently via specific tracts into the brain (Fig. 2G,H, 9C,D). We classified each neuron as projecting into one of four main tracts from the lobula to the central brain (Fig. 9C,D): the anterior optic tubercle tract (aott); the posterior superior optic tract (psot); the posterior inferior optic tract (piot; or inferior optic commissure) (Hertel et al., 1987); and the lobula optic tract (lot) (Kenyon, 1896; Mobbs, 1982, 1984) (supplemental Table 2, available at www.jneurosci.org as supplemental material). As an aside, cell soma location did not correlate with dendritic arborization patterns within the lobula layers.
Figure 9.
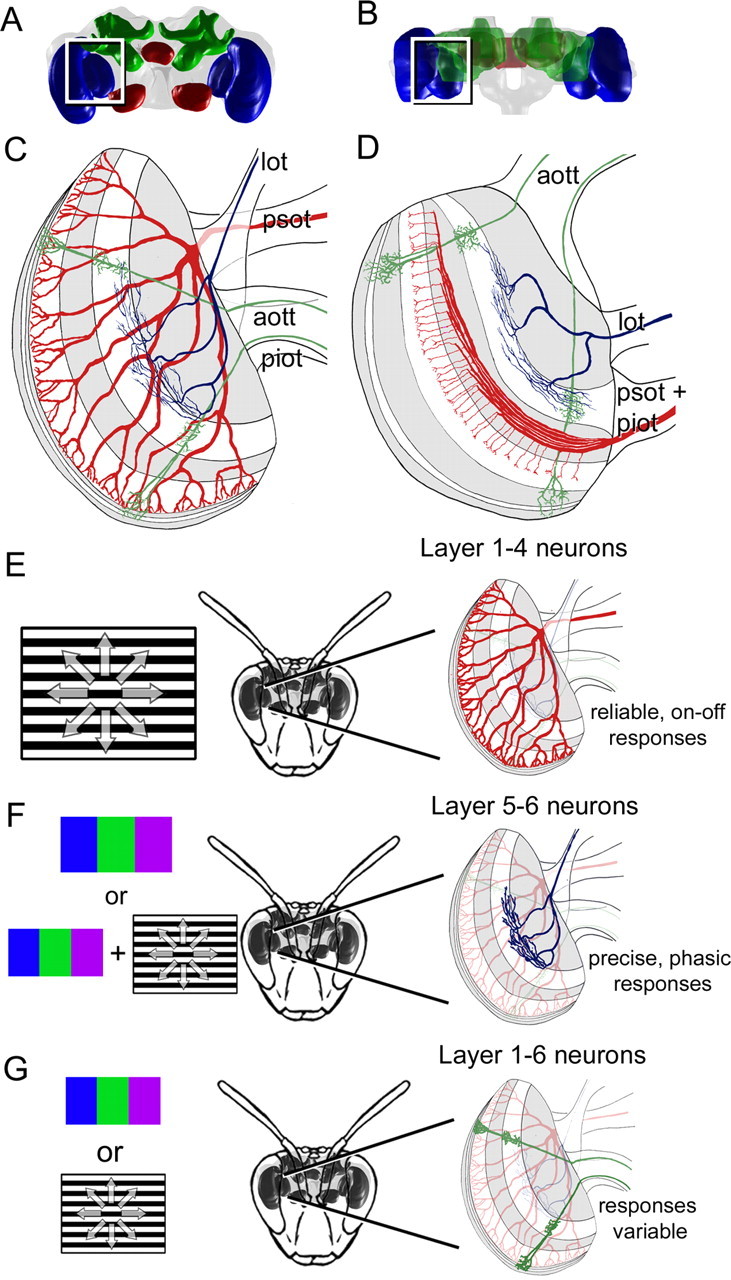
Summary of the anatomical segregation of function in the bee lobula. A–D, In these schematics in a frontal (A, C) and horizontal (B, D) view, the different layout of GABA (white bands) are combined with the layout of the wide-field layer 1–4 (red), layer 5–6 neurons (blue), and columnar layer 1–6 neurons (green). These neurons predominantly exit the lobula via different tracts, which include the aott, psot, piot, and lot. E–G, The results are summarized in these diagrams. E, The layer 1–4 neuron pathway would likely be activated during the presentation of achromatic motion cues (black and white moving grating). Their responses would be reliable, less precise, and would have an on–off response to flicker. F, The layer 5–6 neuron pathway would probably be stimulated during color (blue, green, or violet light) and chromatic motion cues, and would produce highly precise responses and have phasic responses to flicker. G, The layer 1–6 neurons had variable responses, but were sensitive to color and/or motion stimuli and could have precise and/or reliable responses overall. Abbreviations are as defined in Figure 2 and Results.
The majority of the layer 1–4 neurons exited the lobula via the posterior tracts (85%) (Fig. 9E) (supplemental Table 2, available at www.jneurosci.org as supplemental material), whereas the layer 5–6 neurons mostly projected through the lobula optic tract or the aott (85%) (Fig. 9F,G) (supplemental Table 2, available at www.jneurosci.org as supplemental material). Therefore, the major morphological layer classes projected to different regions of the brain (Kenyon, 1896; Mobbs, 1982, 1984), suggesting that some of the functional segregation we observed in the lobula is conserved at later visual processing stages.
Discussion
The ability to detect behaviorally relevant cues, including motion, pattern, and color is necessary for bees to forage, find mates, perform social interactions, and navigate back and forth from food sources several kilometers away from the nest. The processing performed in the bee lobula, a major component of the visual processing pathway, is essential for many of these functions. We found color and motion sensitive lobula neurons with varying temporal properties and branching patterns within lobula layers which could be matched to specific functions involved in behavior (Fig. 9) (for all data, see also supplemental Table 2, available at www.jneurosci.org as supplemental material). Thus, we hypothesize that there is a direct relationship between the lobula layers and the different visual capabilities found behaviorally in bees.
Lobula structure and function: color and motion pathways
In many visual systems, it is not clear whether there are completely separate pathways for color and motion (Hubel and Livingstone, 1987), or if the dimensions of color and motion are jointly encoded, with individual neurons signaling multiple dimensions of the visual scene (Lennie, 1998; Lennie and Movshon, 2005). In the primate visual system, evidence suggests that both strategies are used to varying degrees (Hubel and Livingstone, 1987; Lennie, 1998; Callaway, 2005; Sincich and Horton, 2005). The first strategy of segregating visual processing pathways originates in the retina in the parvocellular (P) and magnocellular (M) pathways (Callaway, 2005; Lennie and Movshon, 2005). The M and P pathways remain relatively separate through the lateral geniculate nucleus and input to separate layers in the primary visual cortex (V1), and are thought to represent segregated pathways of chromatic (P) and achromatic (M) information (Callaway, 2005; Lennie and Movshon, 2005).
However, the question is how neurons in V1 integrate chromatic and achromatic information; they either process information pathways separately or encode visual stimuli jointly. Hubel and Livingstone (1987) proposed that the M and P pathways remain relatively segregated as visual information is sent from V1 to extrastriate regions such as MT (for motion processing) or V2 (for form or color processing). Conversely, Lennie (1998) proposed that V1 neurons encode multiple dimensions of visual information, which include combinations of color, form, orientation, and motion.
The bee lobula may actually use both strategies for visual processing. We observed the segregation of color and motion pathways along anatomical lines. Many layer 1–4 neurons respond to motion independent of color, whereas some layer 5–6 neurons are color sensitive but motion insensitive (Fig. 6E). The bee visual system also jointly encodes the dimensions of color and motion of the visual scene, a number of layer 5–6 neurons that were both color and motion sensitive. The bee visual system then is a useful model for understanding how individual neurons can jointly encode multiple dimensions of visual cues.
In addition, although we divided the lobula neurons into three main groups based on the layers, the bee lobula clearly can be further subdivided into six or more layers. The division of neural branching patterns among the layers may have to do with the segregation of additional levels of color and motion processing at each layer. However, determining the segregation of function among the six layers will require recordings and reconstructions of more neurons and the use of additional color and motion stimuli.
Lobula evolution and structure
Unlike bees, many insects possess both a lobula and a second structure called the lobula plate, a higher-order visual processing neuropil in the optic lobes that has been studied extensively in flies (Hausen, 1981) (for review, see Borst, 2000; Borst and Haag, 2002). In flies, the wide-field tangential neurons in the lobula plate are thought to be involved in detecting directional wide-field motion independent of color (Hausen and Wehrhahn, 1989; Douglass and Strausfeld, 1998). Flies also have a lobula, which has neurons which are orientation and small-field motion sensitive (Douglass and Strausfeld, 1998; Barnett et al., 2007). The basal condition in insects is to have both a lobula and lobula plate and, thus, in bees, the lobula plate was either lost or merged with the lobula. On the basis of anatomical observations, Cajal and Sanchez (1915) originally suggested that the lobula plate was not lost, but absorbed into the posterior (or the dorsal along the neural axis) edge of the bee lobula. At first pass, our data support this view because the layer 1–4 neurons, which are posterior (dorsal) in the lobula, were often motion sensitive but color insensitive, as are lobula plate neurons in flies. Further work should be done to determine what evolutionary pressures are likely to have driven this reorganization.
Distribution of neurotransmitters and neuromodulators in the lobula
The lobula layers are also functionally segregated in terms of the distribution of GABA and serotonergic processes (Fig. 3). In past studies, researchers found that lobula layers are evident in honeybee brain tissue immunolabeled for serotonin, octopamine, GABA, and acetylcholinesterase (Schäfer and Bicker, 1986; Kreissl and Bicker, 1989; Bicker, 1999; Sinakevitch et al., 2005). The increased amount of serotonergic branching in layers 1–4 implies that their activity is modulated by localized serotonergic inputs. The behavioral significance of this serotonergic input is hinted at by the observation that the injection of serotonin into the honeybee lobula decreases the background activity, response intensity, and directional selectivity of motion selective neurons (Kloppenburg and Erber, 1995), which results in a decrease in the ability of bees to respond with antennal movements to moving striped patterns (Erber and Kloppenburg, 1995). Additional studies on the location of the GABA and serotonin receptors are required to determine how neurotransmitter distribution could be segregated among the layers.
Lobula output regions indicate behavioral relevance
Underscoring differences in response properties and arborization patterns between neurons in different layers of the lobula, the neurons from these layers project to different regions of the brain (Fig. 9) (Kenyon, 1896; Mobbs, 1982, 1984; Ehmer and Gronenberg, 2002). Most layer 1–4 neurons send their axons through the posterior optic tracts either to the contralateral lobula or to the posterior protocerebrum (Fig. 4E, 9E). The posterior protocerebrum contains the dendritic processes of descending neurons that project to motor control centers (Strausfeld and Bassemir, 1985; Ibbotson, 2001; Schröter et al., 2007). Our findings therefore predict that these descending neurons require highly consistent inputs, such as those provided by the reliable layer 1–4 neurons, to accurately affect course adjustments and to navigate obstacles. These projections implicate a clear role for the layer 1–4 neurons in the color insensitive optomotor reflex, and in circuits that control speed of flight and detect moving targets (Kaiser and Liske, 1972; Giger and Srinivasan, 1996; Chittka and Tautz, 2003).
Many of the layer 5–6 neurons project via the lobula optic tract or the anterior optic tubercle tract into the calyces of the mushroom bodies or into the dorsal and lateral protocerebrum (Fig. 9F) (Gronenberg, 1986; Ehmer and Gronenberg, 2002; Strausfeld, 2002; Paulk and Gronenberg, 2008). Not much is known about the dorsal and lateral protocerebrum, although these regions have been implicated in the formation of a memory trace in flies (Liu et al., 2006) and include other visual processing glomeruli (Strausfeld and Okamura, 2007). Conversely, we know the second layer 5–6 output region, the mushroom bodies, have long been associated with olfactory learning and memory (Heisenberg, 1998, 2003), but their function in visual tasks is less well understood. Mushroom body intrinsic neurons, the Kenyon cells, have high rates of adaptation and high firing thresholds and so need highly correlated, or precise, inputs to trigger firing (Laurent and Naraghi, 1994; Perez-Orive et al., 2004; Szyszka et al., 2005), requirements met by the particularly precise layer 5–6 neurons.
The importance of this observation becomes clear in when considering the dynamics of subsequent neural response properties. Mushroom body neurons exhibit spike-timing-dependent plasticity (Mauelshagen, 1993; Li and Strausfeld, 1997; Menzel and Manz, 2005; Cassenaer and Laurent, 2007). The precise spiking characteristics of the layer 5–6 neurons could be essential for inducing these spike-timing-dependent changes in the mushroom body and protocerebral neurons.
Bees navigate the natural world much as we do, and must similarly cope with all the challenges of processing visual cues and responding to salient stimuli. To surmount these challenges with so few neurons, the visual system of the bee has evolved to make use of separate visual processing pathways organized into a remarkably efficient anatomical scheme. A part of this efficiency is the arrangement of the lobula neural dendrites into layers, which allows very different functional pathways to be segregated within a structure of only 50,000 neurons (Witthöft, 1967). Thus, the ability of a small insect brain to perform the visual tasks required to process the natural world derives from a remarkably efficient anatomical organization of the individual neurons.
Footnotes
This work was supported by National Institute of Neurological Disorders and Stroke Grant F31NS051123 (A.C.P.) and National Science Foundation Grant IOB-0519483 (W.G.). The content is solely our responsibility and does not necessarily represent the official views of the National Institute of Neurological Disorders and Stroke, the National Institutes of Health (NIH), or the National Science Foundation. This work was additionally supported by NIH Grant T32 AG007434 and by the Center for Insect Science, University of Arizona. We thank Patrick Williams, Cole Gilbert, Aaron Beyerlein, Andre Riveros, and Penny Dacks for helpful comments on this manuscript.
References
- Backhaus W. Color vision in honeybees. Neurosci Biobehav Rev. 1992;16:1–12. doi: 10.1016/s0149-7634(05)80045-4. [DOI] [PubMed] [Google Scholar]
- Backhaus W, Werner A, Menzel R. Neurobiology and behavior of honeybees. New York: Springer; 1987. Color vision in honeybees: metric, dimensions, constancy, and ecological aspects; pp. 172–190. [Google Scholar]
- Barnett PD, Nordström K, O'Carroll DC. Retinotopic organization of small-field-target-detecting neurons in the insect visual system. Curr Biol. 2007;17:569–578. doi: 10.1016/j.cub.2007.02.039. [DOI] [PubMed] [Google Scholar]
- Baumann F, Hadjilazaro B. A depolarizing aftereffect of intense light in the drone visual system. Vision Res. 1972;12:17–31. doi: 10.1016/0042-6989(72)90134-4. [DOI] [PubMed] [Google Scholar]
- Bicker G. Biogenic amines in the brain of the honeybee: cellular distribution, development, and behavioral functions. Microsc Res Tech. 1999;44:166–178. doi: 10.1002/(SICI)1097-0029(19990115/01)44:2/3<166::AID-JEMT8>3.0.CO;2-T. [DOI] [PubMed] [Google Scholar]
- Borst A. Models of motion detection. Nat Neurosci. 2000;3:1168. doi: 10.1038/81435. [DOI] [PubMed] [Google Scholar]
- Borst A, Haag J. Neural networks in the cockpit of the fly. J Comp Physiol A Neuroethol Sens Neural Behav Physiol. 2002;188:419–437. doi: 10.1007/s00359-002-0316-8. [DOI] [PubMed] [Google Scholar]
- Cajal SR, Sanchez D. Contribución al conocimiento de los centros nerviosos de los insectos. Parte 1. Retina y centros opticos. Trab Lab Invest Biol Univ Madr. 1915;13:1–168. [Google Scholar]
- Callaway EM. Structure and function of parallel processing pathways in the primate early visual system. J Physiol (Lond) 2005;566:13–19. doi: 10.1113/jphysiol.2005.088047. [DOI] [PMC free article] [PubMed] [Google Scholar]
- Cassenaer S, Laurent G. Hebbian STDP in mushroom bodies facilitates the synchronous flow of olfactory information in locusts. Nature. 2007;448:709–713. doi: 10.1038/nature05973. [DOI] [PubMed] [Google Scholar]
- Chittka L, Tautz J. The spectral input of honeybee visual odometry. J Exp Biol. 2003;206:2393–2397. doi: 10.1242/jeb.00436. [DOI] [PubMed] [Google Scholar]
- Dacks AM, Christensen TA, Hildebrand JG. Phylogeny of a serotonin-immunoreactive neuron in the primary olfactory center of the insect brain. J Comp Neurol. 2006;498:727–746. doi: 10.1002/cne.21076. [DOI] [PubMed] [Google Scholar]
- DeVoe RD, Kaiser W, Ohm J, Stone LS. Horizontal movement detectors of honeybees: directionally-selective visual neurons in the lobula and brain. J Comp Physiol. 1982;147:155–170. [Google Scholar]
- Douglass JK, Strausfeld NJ. Functionally and anatomically segregated visual pathways in the lobula complex of a calliphorid fly. J Comp Neurol. 1998;396:84–104. [PubMed] [Google Scholar]
- Ehmer B, Gronenberg W. Segregation of visual input to the mushroom bodies in the honeybee (Apis mellifera) J Comp Neurol. 2002;451:362–373. doi: 10.1002/cne.10355. [DOI] [PubMed] [Google Scholar]
- Erber J, Kloppenburg P. The modulatory effects of serotonin and octopamine in the visual system of the honey bee (Apis mellifera L.). I. Behavioral analysis of the motion-sensitive antennal reflex. J Comp Physiol A Neuroethol Sens Neural Behav Physiol. 1995;176:111–118. [Google Scholar]
- Fano U. Ionization yield of radiations. II. The fluctuations of the number of ions. Phys Rev. 1947;72:26–29. [Google Scholar]
- Giger A, Srinivasan MV. Pattern recognition in honeybees: chromatic properties of orientation analysis. J Comp Physiol A Neuroethol Sens Neural Behav Physiol. 1996;178:763–769. [Google Scholar]
- Giurfa M. Behavioral and neural analysis of associative learning in the honeybee: a taste from the magic well. J Comp Physiol A Neuroethol Sens Neural Behav Physiol. 2007;193:801–824. doi: 10.1007/s00359-007-0235-9. [DOI] [PubMed] [Google Scholar]
- Gregory CE. The Bodian protargol technique. In: Strausfeld NJ, Miller TA, editors. Neuroanatomical techniques. New York: Springer; 1980. pp. 75–95. [Google Scholar]
- Gronenberg W. Physiological and anatomical properties of optical input-fibres to the mushroom bodies in the bee brain. J Insect Physiol. 1986;32:695–704. [Google Scholar]
- Hausen K. Monocular and binocular computation in the lobula plate of the fly. Verh Dtsch Sool Ges. 1981;1981:49–70. [Google Scholar]
- Hausen K, Wehrhahn C. Neural circuits mediating visual flight control in flies. I. Quantitative comparison of neural and behavioral response characteristics. J Neurosci. 1989;9:3828–3836. doi: 10.1523/JNEUROSCI.09-11-03828.1989. [DOI] [PMC free article] [PubMed] [Google Scholar]
- Heisenberg M. What do the mushroom bodies do for the insect brain? Learn Mem. 1998;5:1–10. [PMC free article] [PubMed] [Google Scholar]
- Heisenberg M. Mushroom body memoir: from maps to models. Nat Rev Neurosci. 2003;4:266–275. doi: 10.1038/nrn1074. [DOI] [PubMed] [Google Scholar]
- Hertel H. Chromatic properties of identified interneurons in the optic lobes of the bee. J Comp Physiol A Neuroethol Sens Neural Behav Physiol. 1980;137:215–231. [Google Scholar]
- Hertel H, Maronde U. The physiology and morphology of centrally projecting visual interneurons in the honeybee brain. J Exp Biol. 1987;133:301–315. [Google Scholar]
- Hertel H, Schäfer S, Maronde U. The physiology and morphology of visual commissures in the honeybee brain. J Exp Biol. 1987;133:283–300. [Google Scholar]
- Hubel DH, Livingstone MS. Segregation of form, color, and stereopsis in primate area 18. J Neurosci. 1987;7:3378–3415. doi: 10.1523/JNEUROSCI.07-11-03378.1987. [DOI] [PMC free article] [PubMed] [Google Scholar]
- Ibbotson MR. Evidence for velocity-tuned motion-sensitive descending neurons in the honeybee. Proc Biol Sci. 2001;268:2195–2201. doi: 10.1098/rspb.2001.1770. [DOI] [PMC free article] [PubMed] [Google Scholar]
- Kaiser W, Liske E. A preliminary report on the analysis of the optomotor system of the bee: behavioral studies with spectral lights. In: Wehner R, editor. Information processing in the visual systems of arthropods. New York: Springer; 1972. pp. 163–166. [Google Scholar]
- Kenyon FC. The brain of the bee. A preliminary contribution to the morphology of the nervous system of Arthropoda. J Comp Neurol. 1896;6:133–210. [Google Scholar]
- Kien J, Menzel R. Chromatic properties of interneurons in the optic lobes of the bee-I. Broad-band neurons. J Comp Physiol. 1977a;113:17–34. [Google Scholar]
- Kien J, Menzel R. Chromatic properties of interneurons in the optic lobes of the bee-II. Narrow band and color opponent neurons. J Comp Physiol. 1977b;113:35–53. [Google Scholar]
- Kloppenburg P, Erber J. The modulatory effects of serotonin and octopamine in the visual system of the honey bee (Apis mellifera L.) II. Electrophysiological analysis of motion-sensitive neurons in the lobula. J Comp Physiol A Neuroethol Sens Neural Behav Physiol. 1995;176:119–129. [Google Scholar]
- Kreissl S, Bicker G. Histochemistry of acetylcholinesterase and immunocytochemistry of an acetylcholine receptor-like antigen in the brain of the honeybee. J Comp Neurol. 1989;286:71–84. doi: 10.1002/cne.902860105. [DOI] [PubMed] [Google Scholar]
- Laurent G, Naraghi M. Odorant-induced oscillations in the mushroom bodies of the locust. J Neurosci. 1994;14:2993–3004. doi: 10.1523/JNEUROSCI.14-05-02993.1994. [DOI] [PMC free article] [PubMed] [Google Scholar]
- Lehrer M, Srinivasan MV, Zhang SW, Horridge GA. Motion cues provide the bee's visual world with a third dimension. Nature. 1988;332:356–357. [Google Scholar]
- Lennie P. Single units and visual cortical organization. Perception. 1998;27:889–935. doi: 10.1068/p270889. [DOI] [PubMed] [Google Scholar]
- Lennie P, Movshon JA. Coding of color and form in the geniculostriate visual pathway (invited review) J Opt Soc Am A Opt Image Sci Vis. 2005;22:2013–2033. doi: 10.1364/josaa.22.002013. [DOI] [PubMed] [Google Scholar]
- Li Y, Strausfeld NJ. Morphology and sensory modality of mushroom body extrinsic neurons in the brain of the cockroach, Periplaneta americana. J Comp Neurol. 1997;387:631–650. [PubMed] [Google Scholar]
- Liu G, Seiler H, Wen A, Zars T, Ito K, Wolf R, Heisenberg M, Liu L. Distinct memory traces for two visual features in the Drosophila brain. Nature. 2006;439:551–556. doi: 10.1038/nature04381. [DOI] [PubMed] [Google Scholar]
- Maddess T, Yang E. Orientation-sensitive neurons in the brain of the honey bee (Apis mellifera) J Insect Physiol. 1997;43:329–336. doi: 10.1016/s0022-1910(96)00111-4. [DOI] [PubMed] [Google Scholar]
- Mainen ZF, Sejnowski TJ. Reliability of spike timing in neocortical neurons. Science. 1995;268:1503–1506. doi: 10.1126/science.7770778. [DOI] [PubMed] [Google Scholar]
- Mares S, Ash L, Gronenberg W. Brain allometry in bumblebee and honey bee workers. Brain Behav Evol. 2005;66:50–61. doi: 10.1159/000085047. [DOI] [PubMed] [Google Scholar]
- Mauelshagen J. Neural correlates of olfactory learning in an identified neuron in the honeybee brain. J Neurophysiol. 1993;69:609–625. doi: 10.1152/jn.1993.69.2.609. [DOI] [PubMed] [Google Scholar]
- Menzel R. Spectral responses of moving detecting and “sustaining” fibres in the optic lobe of the bee. J Comp Physiol. 1973;82:135–150. [Google Scholar]
- Menzel R, Blakers M. Color receptors in the bee eye morphology and spectral sensitivity. J Comp Physiol. 1976;108:11–33. [Google Scholar]
- Menzel R, Giurfa M. Dimensions of cognition in an insect, the honeybee. Behav Cogn Neurosci Rev. 2006;5:24–40. doi: 10.1177/1534582306289522. [DOI] [PubMed] [Google Scholar]
- Menzel R, Manz G. Neural plasticity of mushroom body-extrinsic neurons in the honeybee brain. J Exp Biol. 2005;208:4317–4332. doi: 10.1242/jeb.01908. [DOI] [PubMed] [Google Scholar]
- Mobbs PG. The brain of the honeybee, Apis mellifera I. The connections and spatial organization of the mushroom bodies. Phil Trans R Soc Lond B Biol Sci. 1982;298:309–354. [Google Scholar]
- Mobbs PG. Neural networks in the mushroom bodies of the honeybee. J Insect Physiol. 1984;30:43–58. [Google Scholar]
- Ney-Nifle M, Keasar T, Shmida A. Location and color learning in bumblebees in a two-phase conditioning experiment. J Insect Behav. 2001;14:697–711. [Google Scholar]
- Paulk AC, Gronenberg W. Higher order visual input to the mushroom bodies in the bee, Bombus impatiens. Arthropod Struct Dev. 2008 doi: 10.1016/j.asd.2008.03.002. in press. [DOI] [PMC free article] [PubMed] [Google Scholar]
- Peitsch D, Feitz A, Hertel H, de Souza J, Ventura DF, Menzel R. The spectral input systems of hymenopteran insects and their receptor-based colour vision. J Comp Physiol A Neuroethol Sens Neural Behav Physiol. 1992;170:23–40. doi: 10.1007/BF00190398. [DOI] [PubMed] [Google Scholar]
- Perez-Orive J, Bazhenov M, Laurent G. Intrinsic and circuit properties favor coincidence detection for decoding oscillatory input. J Neurosci. 2004;24:6037–6047. doi: 10.1523/JNEUROSCI.1084-04.2004. [DOI] [PMC free article] [PubMed] [Google Scholar]
- Ribi WA, Scheel M. The second and third optic ganglia of the worker bee: Golgi studies of the neuronal elements in the medulla and lobula. Cell Tissue Res. 1981;221:17–43. doi: 10.1007/BF00216567. [DOI] [PubMed] [Google Scholar]
- Roig-Alsina A, Michener CD. Studies of the phylogeny and classification of long-tongued bees (Hymenoptera: Apidae) Univ Kansas Sci Bull. 1993;55:124–162. [Google Scholar]
- Schäfer S, Bicker G. Distribution of GABA-like immunoreactivity in the brain of the honeybee. J Comp Neurol. 1986;246:287–300. doi: 10.1002/cne.902460302. [DOI] [PubMed] [Google Scholar]
- Schultz TR, Engel MS, Ascher JS. Evidence for the origin of eusociality in the corbiculate bees (Hymenoptera: Apidae) J Kansas Entomol Soc. 2001;74:10–16. [Google Scholar]
- Schreiber S, Fellous JM, Whitmer D, Tiesinga P, Sejnowski TJ. A new correlation-based measure of spike timing reliability. Neurocomputing. 2003;52–54:925–931. doi: 10.1016/S0925-2312(02)00838-X. [DOI] [PMC free article] [PubMed] [Google Scholar]
- Schröter U, Wilson SL, Srinivasan MV, Ibbotson MR. The morphology, physiology and function of suboesophageal neck motor neurons in the honeybee. J Comp Physiol A Neuroethol Sens Neural Behav Physiol. 2007;193:289–304. doi: 10.1007/s00359-006-0182-x. [DOI] [PubMed] [Google Scholar]
- Sinakevitch I, Niwa M, Strausfeld NJ. Octopamine-like immunoreactivity in the honey bee and cockroach: comparable organization in the brain and subesophageal ganglion. J Comp Neurol. 2005;488:233–254. doi: 10.1002/cne.20572. [DOI] [PubMed] [Google Scholar]
- Sincich LC, Horton JC. The circuitry of V1 and V2: integration of color, form, and motion. Annu Rev Neurosci. 2005;28:303–326. doi: 10.1146/annurev.neuro.28.061604.135731. [DOI] [PubMed] [Google Scholar]
- Srinivasan MV. Pattern recognition in the honeybee: recent progress. J Insect Physiol. 1993;40:183–194. [Google Scholar]
- Srinivasan MV, Lehrer M. Spatial acuity of honeybee vision and its spectral properties. J Comp Physiol A Neuroethol Sens Neural Behav Physiol. 1988;162:159–172. [Google Scholar]
- Srinivasan MV, Zhang SW. Probing perception in a miniature brain: Pattern recognition and maze navigation in honeybees. Zoology. 1998;101:246–259. [Google Scholar]
- Strausfeld NJ. Organization of the honey bee mushroom body: representation of the calyx within the vertical and gamma lobes. J Comp Neurol. 2002;450:4–33. doi: 10.1002/cne.10285. [DOI] [PubMed] [Google Scholar]
- Strausfeld NJ, Bassemir UK. Lobula plate and ocellar interneurons converge onto a cluster of descending neurons leading to neck and leg neuropil in Calliphora erythrocephala. Cell Tissue Res. 1985;240:617–640. [Google Scholar]
- Strausfeld NJ, Okamura JY. Visual system of calliphorid flies: organization of optic glomeruli and their lobula complex efferents. J Comp Neurol. 2007;500:166–188. doi: 10.1002/cne.21196. [DOI] [PubMed] [Google Scholar]
- Straw AD, Warrant EJ, O'Carroll DC. A “bright zone” in male hoverfly (Eristalis tenax) eyes and associated faster motion detection and increased contrast sensitivity. J Exp Biol. 2006;209:4339–4354. doi: 10.1242/jeb.02517. [DOI] [PubMed] [Google Scholar]
- Szyszka P, Ditzen M, Galkin A, Galizia CG, Menzel R. Sparsening and temporal sharpening of olfactory representations in the honeybee mushroom bodies. J Neurophysiol. 2005;94:3303–3313. doi: 10.1152/jn.00397.2005. [DOI] [PubMed] [Google Scholar]
- Teich MC, Turcott RG, Siegel RM. Temporal correlation in cat striate-cortex neural spike trains. IEEE Eng Med Biol. 1996;15:79–87. [Google Scholar]
- Tiesinga P, Fellous JM, Sejnowski TJ. Regulation of spike timing in visual cortical circuits. Nat Rev Neurosci. 2008;9:97–107. doi: 10.1038/nrn2315. [DOI] [PMC free article] [PubMed] [Google Scholar]
- Vorobyev M, Brandt R, Peitsch D, Laughlin SB, Menzel R. Colour thresholds and receptor noise: behavior and physiology compared. Vision Res. 2001;41:639–653. doi: 10.1016/s0042-6989(00)00288-1. [DOI] [PubMed] [Google Scholar]
- Witthöft W. Absolute Anzahl und Verteilung der Zellen im Hirn der Honigbiene. Z Morph Tiere. 1967;61:160–184. [Google Scholar]
- Yang EC, Lin HC, Hung YS. Patterns of chromatic information processing in the lobula of the honeybee, Apis mellifera L. J Insect Physiol. 2004;50:913–925. doi: 10.1016/j.jinsphys.2004.06.010. [DOI] [PubMed] [Google Scholar]
- Zhang SW, Srinivasan MV, Collett TS. Convergent processing in honeybee vision: multiple channels for the recognition of shape. Proc Natl Acad Sci USA. 1995;92:3029–3031. doi: 10.1073/pnas.92.7.3029. [DOI] [PMC free article] [PubMed] [Google Scholar]