

Abstract
The genes Kcnc1 and Kcnc3 encode the subunits for the fast-activating/fast-deactivating, voltage-gated potassium channels Kv3.1 and Kv3.3, which are expressed in several brain regions known to be involved in the regulation of the sleep–wake cycle. When these genes are genetically eliminated, Kv3.1/Kv3.3-deficient mice display severe sleep loss as a result of unstable slow-wave sleep. Within the thalamocortical circuitry, Kv3.1 and Kv3.3 subunits are highly expressed in the thalamic reticular nucleus (TRN), which is thought to act as a pacemaker at sleep onset and to be involved in slow oscillatory activity (spindle waves) during slow-wave sleep. We showed that in cortical electroencephalographic recordings of freely moving Kv3.1/Kv3.3-deficient mice, spectral power is reduced up to 70% at frequencies <15 Hz. In addition, the number of sleep spindles in vivo as well as rhythmic rebound firing of TRN neurons in vitro is diminished in mutant mice. Kv3.1/Kv3.3-deficient TRN neurons studied in vitro show ∼60% increase in action potential duration and a reduction in high-frequency firing after depolarizing current injections and during rebound burst firing. The results support the hypothesis that altered electrophysiological properties of TRN neurons contribute to the reduced EEG power at slow frequencies in the thalamocortical network of Kv3-deficient mice.
Keywords: parvalbumin, fast-spiking interneurons, thalamic reticular nucleus, spindle waves, rhythmic rebound bursts, cortical activation
Introduction
Compared with other voltage-gated potassium (Kv) channels, members of the Kv3 subfamily (Kv3.1–Kv3.4) show large unit conductances, high thresholds of activation, and very fast activation and deactivation kinetics (Rudy and McBain, 2001). Kv3-type channels are involved in the rapid repolarization of the action potential (AP), and their presence in neurons correlates with narrow APs, fast afterhyperpolarization (AHP), and high-frequency firing beyond 200 Hz. Although Kv3.1 and Kv3.3 subunits are expressed throughout the brain, their expression is restricted to distinct neuronal subpopulations (Drewe et al., 1992; Perney et al., 1992; Weiser et al., 1994, 1995; Sekirnjak et al., 1997; Ozaita et al., 2002; Chang et al., 2007). In neocortex, thalamus, hippocampus, and striatum, Kv3-type channels are found in GABAergic cells (mostly interneurons) that also express the calcium-binding protein parvalbumin (PV), a marker for fast-spiking neurons. The genetic elimination of Kv3.1 or Kv3.3 increases AP duration, reduces high-frequency firing, and affects synaptic transmission of neurons in several brain nuclei (Lau et al., 2000; Porcello et al., 2002; Macica et al., 2003; Matsukawa et al., 2003; McMahon et al., 2004; Ozaita et al., 2004). The coexpression of Kv3.1 and Kv3.3 channel subunits in several brain regions suggests that functional redundancy among these subunits may exist. In agreement with this notion, single mutants of Kv3.1 and Kv3.3 channels show milder phenotypes than the Kv3.1/Kv3.3 double mutant (Ho et al., 1997; Joho et al., 1999; Espinosa et al., 2001, 2004; Matsukawa et al., 2003; McMahon et al., 2004; Joho et al., 2006a,b).
Thalamocortical EEG oscillations reflect the concerted activity of millions of neurons of several types, e.g., corticothalamic, thalamocortical relay, and thalamic reticular neurons (Steriade et al., 1991). Within this network, subunits for both Kv3.1 and Kv3.3 channels are expressed at particularly high levels in the thalamic reticular nucleus (TRN) (Weiser et al., 1994, 1995; Chang et al., 2007). The TRN is a homogenous nucleus consisting of parvalbumin-expressing GABAergic neurons that send projections to thalamic relay neurons and that receive inputs from thalamocortical and corticothalamic collaterals as well as inputs from brainstem and basal forebrain. The activity of TRN cells varies among arousal states (Steriade et al., 1986; Marks and Roffwarg, 1993). At sleep onset, TRN neurons show high-frequency bursting activity >300 Hz with interburst intervals of 6–16 Hz in response to prolonged hyperpolarizing potentials (Steriade et al., 1987; Fuentealba et al., 2004). This activity is thought to underlie the generation of cortical spindle waves, which, in turn, help to entrain the thalamocortical circuitry during slow-wave sleep (SWS). In agreement, in rats, ibotenic acid-induced lesions restricted to the rostral pole of TRN dramatically changed the characteristics of delta and spindle waves and of behavioral sleep (Marini et al., 2000). Because Kv3.1 and Kv3.3 subunits are highly expressed in the TRN, we hypothesized that the absence of Kv3.1 and Kv3.3 in double-mutant (DKO) mice would alter the firing properties of TRN neurons as well as the oscillatory properties of the thalamocortical circuit.
Materials and Methods
Breeding of Kv3.1/Kv3.3 double-mutant mice.
The generation and initial characterization of double-mutant mice lacking Kv3.1 and Kv3.3 K+ channel subunits has been described previously (Ho et al., 1997; Espinosa et al., 2001). Mice were kept on a 12 h light/dark cycle, and all experiments were performed with 3- to 6-month-old mice. Experiments were done with Kv3.1+/+ Kv3.3+/+ (+/+; +/+ or WT) and Kv3.1−/− Kv3.3−/− (−/−; −/− or DKO) mice that were offspring from Kv3.1+/− Kv3.3+/− (+/−; +/− or DHET) mating pairs to equalize the unavoidable genetic variability among individual mice of different genotypes. Using this breeding scheme, the genetic background varied among individual mice; however, the variability was the same for mice of all genotypes.
We previously showed that the phenotypic changes in DKO mutants were penetrant on different genetic backgrounds (Espinosa et al., 2001, 2004). For the current studies, we used mice on the mixed 129/Sv (25%), C57BL/6 (25%), ICR (50%) background because DKO mice appeared stronger and were more suitable for experiments requiring anesthesia and surgery. All experiments were approved by the Institutional Animal Care and Research Advisory Committee.
Polysomnographic recordings in freely behaving mice.
Anesthetized male mice (ketamine/acepromazine; 100/2.5 mg/kg, i.p.) were surgically prepared with an array of electrodes for chronic polysomnography. Animals were permitted 1 week to recover from surgery and 1 week to adapt to the recording environment, where they were tethered to the recording equipment through a light-weight and ultraflexible electrical lead inside sound-attenuated chambers. The EEG from somatomotor cortex (using an uneven-bipolar transcortical electrode), a hippocampal–cerebellar derivation for theta-rhythm detection, and the electromyogram (EMG) from nuchal muscles were recorded as described previously (Joho et al., 1999). The coordinates for electrode placement were as follows (in mm): 0 anteroposterior, 2 lateral, and 0.3 and 1 depth, from bregma, for the somatosensory staggered bipolar electrodes; −2.3 anteroposterior, 2 lateral, and −1.2 depth, from bregma, for the hippocampal electrode; and −1 anteroposterior and 0 lateral, from lambda, for the cerebellar screw. Analog potentials were digitized (sampled at 128 or 256 Hz) and stored on optical disc.
Spindle-wave episodes recorded by the transcortical bipolar electrodes were counted using 1 s epochs. Spindle-wave episodes were scored manually using the program Rodent Sleep Stager (RSS; Grass Telefactor) and were readily detected after bandpass filtering of the EEG at frequencies between 10 and 15 Hz. To avoid bias resulting from the fact that DKO mice sleep less than WT mice and that spindle-wave episodes are mainly present during SWS, scoring of spindle-wave episodes was normalized to 60 min of SWS (at lights on). Fast Fourier transform algorithms (FFTs) were calculated during staging using a built-in function in the RSS program.
Block of cortical activation.
Cortical activation of extrathalamic monoaminergic and muscarinic cholinergic cortical afferents was inhibited by systemic (i.p.) application of high doses of reserpine (10 μg/g) and scopolamine (7.5 μg/g), respectively (Somerville and Whittle, 1967; Diabac, 1968; Erickson et al., 1996; Dringenberg et al., 2003). Because monoamine depletion requires several hours before reaching effective levels (>80% depletion), reserpine was injected 14–16 h before EEG recordings (Dringenberg and Vanderwolf, 1998). The effects of scopolamine (in the presence or absence of reserpine) were assessed acutely 5–40 min after drug injection. Vehicle solution (0.85% NaCl) was applied to control mice to assess possible stress effects induced by the injections.
Sleep deprivation.
WT and DKO mice were sleep deprived for 6 h by a combination of gentle handling and locomotion on a rotating wheel (67 cm diameter, 1 rpm) starting at lights on. Total sleep time was monitored from hour 7 to hour 24 after lights on. Continuous 18 h records were divided into 15 s epochs and visually scored by standard criteria as wake, SWS, or rapid eye movement (REM) sleep, and data were used to calculate the times spent in the different arousal states (Joho et al., 1999; Espinosa et al., 2004). An FFT was used to calculate EEG power spectra for control conditions (baseline) and for recovery sleep. FFTs were performed on 180 4 s segments (12 min total) of SWS and on 75 4 s segments (5 min total) of waking. SWS segments were chosen from hours 7–12, using the first minute of artifact-free SWS for every half-hour interval. The first 5 min of artifact-free wake episodes were chosen from hours 12–14 (immediately after lights off).
Brain slice recordings.
Thalamocortical slices were prepared and recordings performed as described previously (Porcello et al., 2002). Briefly, mice were anesthetized with Nembutal (50 mg/kg) and decapitated, and the brain was immediately isolated. Slices 250–300 μm thick were prepared at ice-cold temperature from mice at postnatal day 17 (P17)–P30. The slicing solution contained the following (in mm): 234 sucrose, 3 KCl, 1.25 NaH2PO4, 10 MgSO4, 26 NaHCO3, 10 dextrose, and 0.5 CaCl2. The bathing solution contained the following (in mm): 126 NaCl, 3 KCl, 1.25 NaH2PO4, 2 MgSO4, 26 NaHCO3, 10 dextrose, and 2 CaCl2, saturated with 95% O2/5% CO2. Slices were incubated in the bathing solution at 32°C for 1 h and kept at 32°C until transferred to a 36°C submersion-type recording chamber. Whole-cell patch recordings were performed on TRN neurons using micropipettes made from 1.1/1.5 mm borosilicate glass (Sutter) and filled with the following (in mm): 130 K-gluconate, 3 KCl, 2 NaCl, 10 HEPES, 0.2 EGTA, 4 ATP-Mg, 0.3 GTP-Tris, 7 phosphocreatine-Tris, 10 sucrose (pH 7.25, 290 mOsm). A junction potential of 11 mV was subtracted on-line. Series resistance was frequently checked to be <25 MΩ. On average, it was 15.2 ± 0.92 MΩ for WT and 18.0 ± 1.2 MΩ for DKO. Recordings were obtained using the Axopatch 200A amplifier (Molecular Devices), and neurons were visualized using infrared differential interference contrast visualization through a Nikon E600FN microscope and a CCD camera (Hamamatsu). Data was filtered at 5–10 kHz and digitized at 20–50 kHz. Firing and AP parameters (frequency, AP threshold, rise time constant, and decay time constant) were analyzed using Clampfit 9.2 or a custom-based program kindly provided by Dr. Jay Gibson (University of Texas Southwestern Medical Center at Dallas, Dallas, TX). The AP threshold (i.e., the inflection point) and the maximal level of hyperpolarization were visually determined. Rise and decay time constants were respectively calculated by using a single-exponential function built into Clampfit.
RT-PCR.
The neurochemical identity of a subset of the recorded TRN neurons was confirmed by single-cell reverse transcription (RT)-PCR (Cauli et al., 2000). The cytoplasm of cells that were patched in areas visually identified as TRN or the ventrobasal thalamus was aspirated and recovered in the pipette's internal solution. Samples were analyzed for expression of PV and glyceraldehyde-3-phosphate dehydrogenase (GAPDH). Briefly, each sample (10 μl) was mixed with 1 μl of 10 mm dNTPs and 2 μl of the following gene-specific mix of primers (1 μm for each primer): PV-3′, 5′-ATTGTTTCTCCAGCATTTTCCAG-3′ and GAPDH-3′, 5′-TTCACACCCATCACAAACAT-3′ for reverse transcription of PV and GAPDH mRNA, respectively (Wang et al., 2004). After denaturing at 65°C, the mixture was incubated overnight at 55°C with the following reagents (Invitrogen): 5× first-strand buffer (4 μl), 0.1 m DTT (1 μl), RNaseOUT (1 μl), and SuperScript III RT (1 μl). The PCR for parvalbumin was performed using 2 μl of the cDNA sample obtained above and 0.5 μl of the PV primer mix (10 μm for each primer) consisting of PV-5′, 5′-AAGAACCCGGATGAGGTGAAGA-3′ and PV-3′ (same as above), 10 mm dNTPs (0.75 μl), the Accuprime TaqDNA polymerase (0.5 μl), and buffer I (2.5 μl). The following PCR program was used: denaturing at 94°C for 2 min, 40 cycles at 94°C for 30 s, 55°C for 30 s, and 68°C for 1 min, and a final extension at 68°C for 5 min. To amplify GAPDH, 2 μl of cDNA sample were mixed with 1 μl of the GAPDH primer mix (10 μm for each primer) consisting of GAPDH-5′, 5′-GCCATCAACGACCCCTTCAT-3′ and GAPDH-3′ (same as above), 10 mm dNTPs (0.75 μl), the Red TaqDNA polymerase (1.25 μl; Sigma), and its buffer (2.5 μl). The PCR was done at 94°C for 2 min, 40 cycles at 94°C for 30 s, 55°C for 30 s, and 72°C for 1 min, and a final extension at 72°C for 5 min. The conditions of amplification were optimized using 100 pg of total RNA from wild-type mouse brain.
Immunohistochemistry.
Two-month-old mice were perfused intracardially with 4% paraformaldehyde in PBS. The brains were extracted and embedded in OCT (optimal cutting temperature; Tissue-Tek; Sakura Finetek USA) and subsequently cut into 30-μm-thick slices. The slices were stained using as primary antibody the monoclonal anti-parvalbumin (1:3000; clone parv-19; Sigma). After several washes with PBS, sections were incubated with Alexa Fluor-488 goat anti-mouse IgG (Invitrogen). Fluorescence was detected using a Bio-Rad MR-1024 confocal microscope and standard FITC filters.
Statistical analysis.
Results are expressed as mean ± SEM. Unpaired Student's t tests or repeated-measures ANOVAs were used for statistical analysis as appropriate. p values are expressed as *p < 0.05, **p < 0.01, and ***p < 0.001 (between genotypes) and as #p < 0.05, ##p < 0.01, and ###p < 0.001 (within genotypes). p values >0.05 are expressed numerically. The statistical analyses were done using GraphPad Prism version 4.00 for Windows (GraphPad Software).
Results
Altered sleep oscillations in Kv3.1/Kv3.3-deficient mice
To determine whether changes of thalamocortical oscillations were present in Kv3.1/Kv3.3-deficient mice, we recorded the somatomotor EEG of freely moving mice during a 24 h period. Typical recordings of a WT and a DKO mouse are shown in Figure 1A. At this level of analysis, no obvious differences were evident for waking in the cortical EEG between WT and DKO. During SWS, however, the amplitude of slow delta oscillations seems reduced in DKO mice. During REM sleep, theta activity appears to be somewhat increased.
Figure 1.

Low-frequency oscillations are reduced in Kv3.1/Kv3.3 mutant mice. A, Typical 10 s segments for a WT (+/+; +/+) and a DKO (−/−; −/−) mouse representing the different states of arousal. During SWS, DKO mice show reduced slow-wave activity. The behaviorally observed myoclonic jerks (Espinosa et al., 2001) can be seen in the EMG of DKO mice both in slow-wave and in REM sleep (marked by asterisks). B, The averaged power spectra for waking and SWS show a power reduction in the frequency range below ∼15 Hz in DKO. For slow-wave sleep (solid lines), the absolute delta power (1–4 Hz) is ∼70% reduced in DKO compared with WT. The color insets show that gamma power for waking and SWS is higher in DKO than in WT, and the top inset shows the WT/DKO ratio (SWS, solid line; waking, black dashed line). The power spectra are averages of seven WT and six DKO mice. C, The dynamic range (ratio) between the power corresponding to SWS and the power corresponding to wake is shown. The dynamic range at frequencies <15 Hz is much higher in WT than in DKO. D, Power during slow-wave sleep is lower in mutants in delta (1–4 Hz) and spindle wave (7–16 Hz) ranges. E, Power in discrete bands at frequencies >20 Hz during slow-wave sleep was normalized to the absolute power in the delta band. Between 20 and 40 Hz, the normalized power is severalfold higher in the DKO.
We previously showed that homozygous Kv3.1/Kv3.3 double mutants sleep 40–50% less than WT or double-heterozygous mice (Espinosa et al., 2004). This sleep loss was caused by an abundance of short, unstable SWS episodes that resulted in increased sleep fragmentation in DKO compared with WT mice (Joho et al., 2006a). In search for a mechanism underlying the instability of SWS, we determined the power spectra of the somatomotor EEGs to gain insight into possible thalamocortical alterations that might be involved in SWS anomalies. Like WT mice, the power spectrum of DKO mice in SWS shows a peak in the delta band (1–4 Hz) and lowest power in the gamma band (30–50 Hz) (Fig. 1B). In stark contrast to WT, absolute power in the delta band (1–4 Hz) was reduced ∼40% for wake and ∼70% for SWS in DKO. The reduction of absolute power was observed up to ∼15 Hz, a frequency range that includes spindle waves (Fig. 1B,D). Absolute power >15 Hz showed a tendency to be higher in DKO mice for wake and >25 Hz for SWS. Its intergenotype relative change during SWS, measured as the ratio of the absolute power in DKO mice to the absolute power in WT mice, is greatest (∼150%) in the 25–35 Hz range (Fig. 1B, inset).
The power spectra for individual mice of a given genotype show variability that may depend on the sites of electrode placements, possibly generating apparent differences in power spectra between genotypes. To rule out this possibility, we determined the dynamic range for different arousal states of both genotypes by normalizing the power spectra of SWS to the power spectra of waking (Fig. 1C). The difference between genotypes for the dynamic range at slow frequencies is consistent with the results obtained with absolute power. The dynamic range for WT is several times larger than that for DKO in the delta, theta, and spindle waves ranges, reinforcing the notion that the DKO brain is deficient in generating these types of oscillations.
Thalamocortical mechanisms responsible for the generation of delta oscillations block access of extrathalamic stimuli to cortex (Steriade et al., 1991), increasing the threshold for cortical activation during SWS in animals (Neckelmann and Ursin, 1993; Timofeev et al., 1996) and humans (Elton et al., 1997). Alterations in the thalamocortical circuitry resulting in a dramatic reduction of absolute power in the delta range, as seen in the DKO, could decrease the threshold for cortical activation, and therefore, signals of lower intensity (whether internal or external) may suffice to promote arousal.
In addition to their high expression levels in the TRN, Kv3.1 and Kv3.3 subunits are also expressed in several extrathalamic areas, including the basal forebrain, the pontine nuclei, and the laterodorsal tegmentum (Weiser et al., 1994, 1995; Burlet et al., 1999; Chang et al., 2007), structures that participate in the generation of low-voltage, fast activity (LVFA) (Szymusiak, 1995; Dringenberg and Vanderwolf, 1998; Lee et al., 2004). The natural or experimental induction of LVFA of adequate intensity can interrupt high-voltage, slow-wave activity (SWA) during SWS or during anesthesia (Metherate et al., 1992; Neckelmann and Ursin, 1993; Dringenberg et al., 1998, 2003; Lee et al., 2004). The ratio of DKO absolute power to WT absolute power suggested that increased afferent inputs to the thalamocortical circuitry might be present in DKO mice. As an approximation of the increased extrathalamic arousal input present in the brain of WT and DKO during SWS, we normalized the absolute power of discrete frequency bands >20 Hz to the absolute power in the delta band (Fig. 1E). DKO mice show a severalfold increase in the normalized power at bands >20 Hz (see next section for a discussion on the possible implications of these findings).
Block of monoaminergic and cholinergic systems increases slow-wave activity in wild-type mice but less in Kv3.1/Kv3.3-deficient mice
Elevated activity in the high-frequency range in DKO mice (Fig. 1B,E) suggests that increased afferent input to the thalamocortical circuitry associated with arousal might be responsible for interrupting SWA and, therefore, could be the sole origin for the reduced power at frequencies <15 Hz as well as for the alterations in the sleep–wake cycle. Hence, if the thalamocortical circuitry operated normally in DKO, it should be capable, at least in principle, of generating oscillations similar to those observed in WT after reduction of the extrathalamic input to thalamus and cortex. Conversely, if changes intrinsic to the thalamocortical circuitry were mainly responsible for lower SWA in DKO, reduced extrathalamic input to the thalamocortical circuitry may not restore oscillations similar to those in WT.
To determine whether putative increased extrathalamic inputs alters cortical oscillations in DKO, we attempted to isolate pharmacologically the thalamocortical circuitry from this influence by blocking the action of arousal-promoting neurotransmitters by depleting monoamines and using a cholinergic antagonist (Metherate et al., 1992; Dringenberg et al., 2003) (for review, see Dringenberg and Vanderwolf, 1998). After baseline recordings, mice were subjected to block of cortical activation either by application of scopolamine alone (a cholinergic muscarinic receptor antagonist) or by the combined action of scopolamine and reserpine (a monoamine store-depleting drug). Figure 2A shows EEG and EMG traces of a WT and a DKO mouse while ambulating under baseline conditions (top), after drug application (middle), and during normal SWS (bottom). Because EEG differences exist between wake states of different behaviors, we compared mice while ambulating. In the presence of scopolamine and more so when reserpine was also present, SWA in awake WT and DKO mice while ambulating was increased compared with baseline. When scopolamine was applied alone, the increased SWA in WT compared with baseline was fourfold to sevenfold throughout all frequency bands, including the 25–50 Hz band (Fig. 2B). In contrast, scopolamine in DKO had small effects at frequencies <25 Hz, and no changes were seen in the 25–50 Hz band. When both drugs were applied, SWA in WT was increased 30-fold in the delta range (1–4 Hz), ninefold in the range of spindle waves (7–17 Hz), and sixfold in the sigma band (15–25 Hz); however, no significant difference was seen in the 25–50 Hz band (Fig. 2B). For DKO, there was also an increase in SWA at frequencies <25 Hz, but the changes were consistently ∼70% less than those of WT. Similar to WT, DKO mice showed no change in the 25–50 Hz band when both drugs were applied (Fig. 2B). The increase in absolute power after drug treatment was significantly greater in WT than in DKO in the 1–4 Hz band for scopolamine alone (p < 0.05) and for the combined application of reserpine and scopolamine (p < 0.05). In the 7–17 Hz band, the difference between genotypes was also significant for the scopolamine treatment (p < 0.05), with the combined drug application barely missing significance (p = 0.076).
Figure 2.

Reduced cortical activation does not restore normal slow-wave activity in Kv3.1/Kv3.3-deficient mice. A, Baseline (BL) EEG and EMG traces for WT (left) and DKO (right) during active waking while walking (top) and after application of reserpine and scopolamine (center), and during BL slow-wave sleep (bottom). For both genotypes, block of cortical activation results in a wake EEG displaying an increase in slow-wave activity (the EMGs for walking are clipped). B, Power before and after drug application is compared for active waking (walking). The dynamic range (the ratio of power after drug to power before drug) for discrete frequency bands (1–4, 7–17, 15–25, and 25–50 Hz) is shown either for scopolamine alone (Scop) or when coapplied with reserpine (Res-Scop). With both drugs, WT shows an ∼30-fold power increase in the delta range; in contrast, DKO shows only an ∼9-fold increase. WT mice also show power increases in the other frequency bands. The power increase in DKO is restricted to frequencies <25 Hz. The dotted line indicates the baseline power. C, After 6 h of sleep deprivation, WT mice show ∼30% sleep rebound during the subsequent 18 h recovery period (Rec; p < 0.0001). In contrast, DKO mice show no sleep rebound. Total sleep time during baseline or recovery was significantly less in DKO (BL, p < 0.05; Rec, p < 0.001). D, The change of power averaged for the first 6 h after sleep deprivation (second 6 h period in the light) compared with the corresponding baseline period is plotted. During the first 6 h of the recovery period (top), WT mice show a 70% increase in delta power (1–4 Hz) and a decrease in power in higher-frequency bands. In contrast, DKO mice show no increase in delta power (averages of 7 WT and 6 DKO mice).
In summary, monoaminergic and cholinergic activating systems are not likely to be the sole cause of the SWA differences between WT and DKO, because inhibition of these systems does not eliminate the significant differences observed between genotypes.
Neither sleep nor delta power rebound after sleep deprivation in Kv3.1/Kv3.3-deficient mice
The findings above do not rule out the possibility that other extrathalamic systems (e.g., GABAergic and glutamatergic cells in the basal forebrain), not directly affected by the drugs used to block cortical activation, may also have a disrupting influence on SWA in DKO during SWS (Lee et al., 2004; Kaur et al., 2008). Therefore, to decrease cortical activation in a general and more physiological way, we sleep deprived WT and DKO mice to increase the physiological pressure for sleep.
The two-process model for homeostatic sleep regulation predicts an increase of sleep time and/or delta power during recovery from sleep deprivation (Borbély et al., 1989; Tobler and Borbély, 1990; Franken et al., 1991, 1999; Huber et al., 2000). Both recovery sleep and delta power rebound were measured in mice after sleep deprivation (Fig. 2C,D). Six hours of sleep deprivation was performed in the first half of the light period, and recovery sleep was recorded for the subsequent 18 h (i.e., during the second 6 h of the light period followed by the 12 h dark period). Sleep/wake amounts were compared with the animals' own baseline recording for the corresponding 18 h period before sleep deprivation. The total sleep time (SWS and REM sleep) during the 18 h of baseline was 475 ± 30 min for WT (n = 6) and 366 ± 9.9 min for DKO (n = 7; p < 0.05), corresponding to 23% reduction of total sleep time in DKO mice (Fig. 2C). After 6 h of sleep deprivation, the total sleep time was increased to 613 ± 46 min in WT (p < 0.001), corresponding to a 30% rebound in total sleep time, in agreement with published reports (Tobler and Borbély, 1990; Huber et al., 2000). In contrast, the total sleep time for DKO mice remained at baseline value of 340 ± 12 min (p = 0.94) (Fig. 2C). Hence, Kv3.1/Kv3.3-deficient mice do not increase total sleep time, even under conditions of increased sleep pressure that lead to sleep rebound in WT mice.
We determined the latency period to entering the first SWS episode and its duration in WT and DKO mice after 6 h of sleep deprivation (Table 1). WT mice entered the first SWS episode within a few minutes (7.03 ± 2.44 min; n = 9), a time significantly shorter than the latency for DKO (21.04 ± 5.12 min; n = 7; p = 0.02). Also, WT mice remained longer in the first SWS episode than DKO (WT, 3.92 ± 0.93 min; n = 9; DKO, 1.64 ± 0.52 min; n = 7; p = 0.07) before reentering the wake state, and the total time spent in SWS during the first hour after sleep deprivation was significantly higher in WT than in DKO mice (WT, 60.3 ± 5.1%; n = 9; DKO, 38.9 ± 7.0%; n = 7; p = 0.02). After cycling between episodes of SWS and waking, WT and DKO mice entered their first REM episode after a similar delay (Table 1). Hence, even under increased sleep pressure, Kv3.1/Kv3.3-deficient mice do not appear to readily enter slow-wave sleep.
Table 1.
Increased latency to slow-wave sleep in Kv3.1/Kv3.3 mutants
| SWS |
REM |
|||||
|---|---|---|---|---|---|---|
| Latency | Duration | % in hour | Latency | Duration | % in hour | |
| +/+; +/+ (9) | 7.0 ± 2.4 | 3.9 ± 0.9 | 60.3 ± 5.1 | 36.8 ± 4.2 | 1.3 ± 0.3 | 5.3 ± 1.0 |
| −/−; −/− (7) | 21.0 ± 5.1 | 1.6 ± 0.5 | 38.9 ± 7.0 | 50.1 ± 8.8 | 1.9 ± 0.4 | 5.2 ± 1.9 |
| p value | 0.02 | 0.07 | 0.02 | 0.16 | 0.29 | 0.98 |
For slow-wave sleep and REM sleep, the latency to enter the first episode, its duration (both in minutes), and the percentage of time spent in the state during the first hour after 6 hr of sleep deprivation are shown for WT (+/+; +/+) and DKO (−/−; −/−) mice (number of mice in parentheses). For DKO mice, the latency period for entering slow-wave sleep is significantly prolonged (p = 0.02), and the time spent in slow-wave sleep during the first hour is significantly reduced in DKO (p = 0.02).
We also monitored changes in delta power during baseline SWS and after sleep deprivation (Fig. 2D). As expected for WT, during the first 6 h of recovery sleep, delta power was increased by ∼70% from baseline value after sleep deprivation; in contrast, there was no increase in delta power in DKO. Hence, Kv3.1/Kv3.3-deficient mice not only have a constitutive 70% decrease of absolute delta power but are also unable to generate more delta power, even under conditions of increased sleep pressure. At higher frequencies (>20 Hz), both genotypes showed a decrease in EEG power during recovery sleep after sleep deprivation, a finding consistent with reduced cortical activation as a result of increased sleep drive (Tobler and Borbély, 1986, 1990; Neckelmann and Ursin, 1993).
Fewer spindle-wave episodes in Kv3.1/Kv3.3-deficient mice
The TRN has been implicated in the generation of sleep spindles (Steriade et al., 1987). The occurrence of spindle waves correlates with the burst activity of the thalamic relay and reticular neurons and is most prominent during the initial stages of SWS (Nuñez et al., 1992; von Krosigk et al., 1993; Fuentealba et al., 2004; Fuentealba and Steriade, 2005). Spindle-wave episodes in the mouse are short, mostly <2 s in duration. To correctly quantify spindle waves during SWS, 1 s epochs were analyzed at the beginning of the light period, when mice tend to sleep the most. EEG recordings were bandpass filtered (10–15 Hz) off-line to allow a better observation of sleep spindles, especially in WT, in which the abundance of slow waves tended to mask the presence of spindles (Fig. 3A,B). Compared with WT, the number of spindle-wave episodes was reduced in DKO mice (453 ± 38 in WT; 289 ± 57 in DKO; p < 0.05), and the percentage of SWS epochs with sleep spindles present was less than one-half in DKO mice (29% in WT; 13% in DKO; p < 0.05) (Fig. 3C, top). The mean duration of spindle episodes and the power difference between spindle episodes and wake episodes showed also a tendency to be reduced (Fig. 3C, bottom). These findings suggest that the lack of Kv3.1 and Kv3.3 channel subunits in DKO mice leads to fewer spindle waves in the cortical EEG thought to originate in TRN in vivo. Therefore, we next compared in brain slices the basic electrophysiological as well as the cellular oscillatory properties of TRN neurons between both genotypes.
Figure 3.
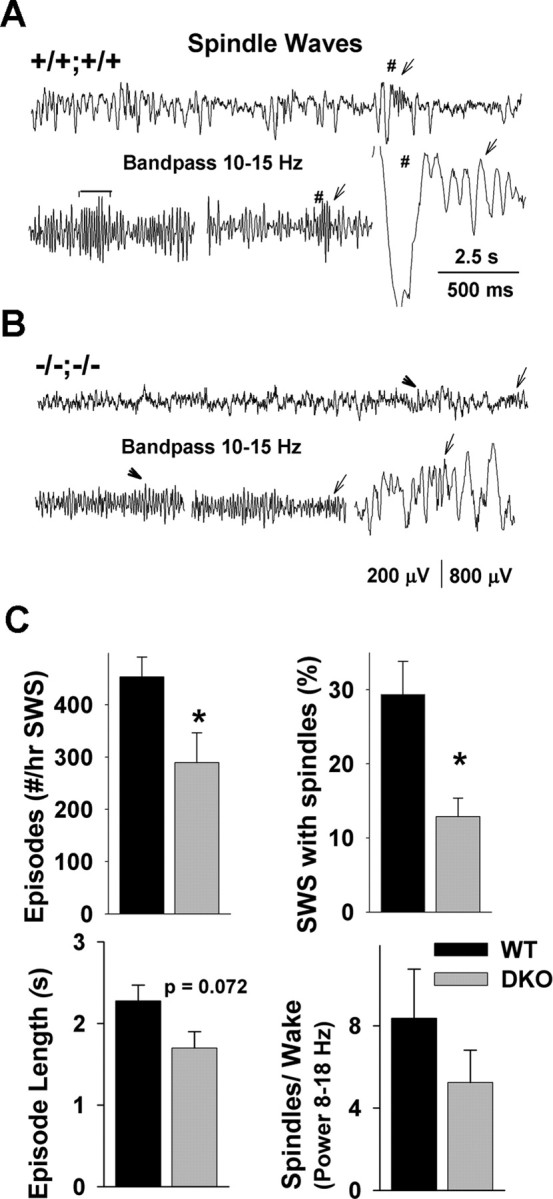
Reduced occurrence of spindle waves in Kv3.1/Kv3.3 mutants. A, B, Typical 15 s cortical EEG traces for WT (A) and DKO (B) during SWS. To facilitate the detection of spindles, EEG traces were bandpass filtered at 10–15 Hz. Two filtered 5 s segments are shown for each genotype. Spindle waves are shown by arrows, arrowheads, or the bracket. In the WT and DKO EEG, the pound sign and arrow mark the expanded slow wave shown on the right. The traces to the right are on an expanded time scale. C, The number of spindle-wave episodes and the percentage of SWS in which spindle waves are significantly lower in DKO. The length of spindle-wave episodes and the dynamic range in the 8–18 Hz band between SWS and waking also showed a trend to lower values in DKO (n = 5 for both genotypes).
Firing properties are altered in Kv3.1/Kv3.3-deficient TRN neurons
As expected, immunostaining for PV in the TRN was abundant and included both cell bodies and fibers (Fig. 4A). In brain slices, we confirmed the neurochemical identity in a subset of recorded neurons by single-cell RT-PCR. Of a total of 18 GAPDH-positive cytoplasms (a control for mRNA quality) from TRN neurons, 16 were also PV positive. In contrast, PV could not be detected in VB neurons (Fig. 4B).
Figure 4.

Firing properties of TRN neurons in wild-type and Kv3.1/Kv3.3-deficient mice. A, Thalamic sections were labeled with anti-PV antibodies. PV is profusely expressed in TRN neurons in the adult mouse. There is no immunofluorescent signal in neurons of the ventrobasal complex of the thalamus (VB). Some cells in the capsule (Cp) and striatum (St) are also immunoreactive for PV. B, Identification of PV (Parvb)-expressing cells in the thalamus by single-cell RT-PCR. A 390 bp band was detected in 8 of 10 cytoplasmic samples collected from the TRN of WT and DKO mice but absent in cytoplasms collected from VB. GAPDH as control was detected in all samples. The cDNAs for PV and GAPDH were amplified from 100 pg of total (Tot) RNA from WT mouse. C, Current-clamp recordings of TRN neurons from WT and DKO mice. The membrane potential was held at −80 mV, and firing was triggered by 400 ms current steps in increments of twice the threshold current (WT, 56.3 ± 5.3 pA; n = 27; DKO, 52.1 ± 6.3 pA; n = 19). The traces to the right correspond to four times the threshold current, at which the differences in firing frequency, AP width, and fast AHP between WT and DKO are evident. D, Average firing frequencies during the 400 ms pulse are plotted versus current. The instantaneous frequency at 12 times the threshold was ∼270 Hz for WT and ∼220 Hz for DKO (p < 0.001). E, After increased current injection, both a WT and a DKO neuron failed to generate APs. DKO neurons entered depolarization block at lower levels of injected current (p < 0.05).
The firing properties of fast-spiking TRN neurons were compared between WT and DKO mice. The analysis focused on firing frequency, AP width at half-height, AP amplitude, and AHP amplitude. No differences were detected in the passive membrane properties between WT and DKO that could have accounted for the alterations described below. The resting membrane potential was −76.5 ± 1.6 mV for WT (n = 28) and −74.9 ± 2.0 mV for DKO (n = 21; p = 0.36); the input resistance was 259 ± 20 MΩ for WT (n = 27) and 273 ± 31 MΩ for DKO (n = 19; p = 0.68), suggesting similar intrinsic excitability for TRN neurons of both genotypes. The current threshold to trigger AP firing at a holding potential of −80 mV was 56.3 ± 5.3 pA for WT (n = 27) and 52.1 ± 6.3 pA for DKO (n = 19; p = 0.64), and the average firing frequency at four times the threshold current was 137 ± 15.9 Hz for WT and 98 ± 8.4 Hz for DKO neurons (p = 0.068) (Fig. 4C, left). As expected, the AP was broader and the fast AHP was absent in DKO [Figs. 4C (right), 5A]. The latencies between the beginning of the current step and the peak of the first spike were similar. Comparisons of “firing-frequency versus fold-threshold-current” curves are shown in Figure 4D. TRN neurons of DKO mice consistently fired at lower frequencies at all levels of injected current. After large current injections, neurons depolarize strongly and eventually fail to fire because of cumulative inactivation of voltage-dependent Na+ channels. Threshold of failure induction is lower in DKO mice than in WT (1504 ± 239 pA for WT; 1022 ± 125 pA for DKO; p < 0.05), likely caused by the reduced fast AHP and, therefore, slowed recovery of Na+ channels from inactivation (Fig. 4E).
Figure 5.

Action potential duration is increased in Kv3.1/Kv3.3-deficient mice. A, Shape of the AP in WT (black dots) and DKO (gray dots) for the first spike (left) and the spike averaged for the last 50 ms (right; ASF50) of the test pulse (at 4 times the threshold current). AP duration (at half-height) was ∼60% increased in DKO compared with WT (n = 15–18). The lines overlapping the first spike of WT and DKO correspond to fits for the rise and decay time constants. The inset shows the rise time difference between WT (black) and DKO (gray) of ASF50 after normalizing the amplitudes. B, Comparison of AP width, rise time constant (10–90%), and decay time constant (10–90%) between WT (black) and DKO (gray) for the first spike and for the ASF50. DKO mice showed increased AP width and decay time constants. The rise time constant was only different between genotypes for the last 50 ms, not for the first spike (**p < 0.01, ***p < 0.001, differences between genotypes; ###p < 0.001, differences between the first spike and ASF50).
As is expected in the absence of fast-repolarizing Kv3-type currents, DKO mice showed an ∼60% increase in AP duration (0.24 ± 0.02 ms at half-height for WT; n = 18; 0.38 ± 0.02 ms for DKO; n = 17; p < 0.001) as well as for the averaged spike of the final 50 ms of the current pulse (ASF50; 0.28 ± 0.02 ms for WT; n = 15; 0.42 ± 0.03 ms for DKO; n = 16; p < 0.001) (Fig. 5). The maximal level of AHP was 22.8 ± 1.08 mV for WT and 20.1 ± 0.04 mV for DKO (p = 0.07); however, the actual time to peak AHP was delayed in DKO. The AP rise time constants for the first spike were not different between genotypes (0.14 ± 0.02 ms for WT; 0.15 ± 0.02 ms for DKO; p = 0.57); in contrast, the rise time constants for ASF50 were significantly different (0.16 ± 0.02 ms for WT; 0.25 ± 0.03 ms for DKO; p < 0.01), because of a significant increase in DKO (p < 0.001), indicating that the lack of the fast AHP (Fig. 5A) resulted in fewer Na+ channels in the resting state ready to generate the upstroke of the next AP. The repolarization time constants of both the first spike (0.26 ± 0.02 ms for WT; 0.72 ± 0.06 ms for DKO; p < 0.0001) and ASF50 (0.37 ± 0.02 ms for WT; 0.98 ± 0.16 ms for DKO; p < 0.0001) were significantly different.
Depolarization-induced bursts and rhythmic rebound bursts are altered in Kv3.1/Kv3.3-deficient TRN neurons
Given the importance of the TRN for the generation of spindle waves, we studied the in vitro bursting properties of TRN neurons in thalamocortical slices to gain insight into potential cellular correlates that might be responsible for reduced spindling in DKO.
For slice recordings, the holding potential of TRN neurons was adjusted to −80 mV by current injection (<50 pA) to induce recovery from inactivation of low-threshold T-type Ca2+ channels. We induced burst activity at a frequency expected for spindle waves by applying five depolarizing current pulses at 12 Hz (Fig. 6A). TRN neurons fired several APs for each depolarization-induced burst (DIB). WT neurons fired an average of 4.8 ± 0.29 APs per DIB (n = 13), whereas DKO neurons fired 3.9 ± 0.40 APs (n = 9; p = 0.072). The AP duration was significantly increased in DKO; the first and last spike in a DIB showed a 49% and a 70% larger duration than in WT (Fig. 6B), and DKO neurons fired consistently fewer APs per burst (repeated-measures ANOVA, p < 0.001) (Fig. 6C).
Figure 6.

Burst firing is altered in Kv3.1/Kv3.3-deficient mice. A, WT and DKO show burst firing after repetitive current injections. Burst firing was induced by five consecutive current injections at 12 Hz (400 pA for 21 ms). Cells fired from three to seven APs per burst. The arrows point to putative Ca2+ spikes present after the current steps, which were more frequently seen in WT mice. B, AP widths for the first and the last spike in a burst were significantly prolonged in DKO. C, For both genotypes, the number of spikes per burst decreases in subsequent bursts compared with the first burst. DKO neurons fired consistently fewer APs per burst (repeated-measures ANOVA, p < 0.001).
The arrows in Figure 6A point to shoulder-like depolarizations present after the current steps and bursts had terminated. It is possible that these depolarizations represent Ca2+ spikes driven by a slow T-type Ca2+-current (ITs) that is thought to be important in the oscillating rhythmic bursting in the spindle frequency (Huguenard and Prince, 1992, 1994b). These putative slow Ca2+ spikes were rarely seen in TRN neurons of the DKO mouse. On average, there were 2.5 ± 0.36 putative Ca2+ spikes per cycle in WT neurons and 0.5 ± 0.36 in DKO (p < 0.01). Of 19 WT neurons, 18 showed depolarizing shoulders; of 9 DKO neurons, only 4 neurons did. Presently, we do not know why putative slow Ca2+ spikes were rarely seen in TRN neurons of the DKO mouse (see also Discussion).
Next, we compared rhythmic rebound bursts (RRBs), a cellular property that gives TRN neurons pacemaker qualities (Steriade et al., 1987; Nuñez et al., 1992; Bal and McCormick, 1993). RRBs were induced by single hyperpolarizing current steps (400 ms) from a holding potential range of −60 mV to −75 mV. After releasing the hyperpolarizing current, cells fired one to several bursts of APs. To remove inactivation of ITs, the injected current was set to hyperpolarize the cells to voltages between −95 and −105 mV. The number of RRBs was strongly influenced by the initial holding potential, in agreement with previous reports (Nuñez et al., 1992; Bal and McCormick, 1993) (Fig. 7). The dependence of RRBs on the holding potential was not significantly different between genotypes. At membrane potentials near rest (approximately −80 mV) and at more negative potentials, no RRBs were seen. As the holding potential was slightly depolarized, a rebound was triggered, though composed of only a slow Ca2+ spike with no APs (data not shown). A few millivolts more positive, the rebound was composed of a single burst with a few APs (Fig. 7A, top). Bursts increased in number and frequency as the holding potential became more positive. On average, the maximal number of RRBs was obtained at holding potentials of approximately −66 mV (∼70 mV for WT and DKO in Fig. 7A), and cells started firing tonically at approximately −64 mV. At the peak of RRBs, several differences were detected between WT and DKO. In DKO, the AP duration was increased, the numbers of spikes per burst were fewer, and the total number of putative low-threshold Ca2+ spikes was decreased (n = 13 for WT; n = 12 for DKO). In summary, the differences in DIBs and RRBs between WT and DKO are consistent with the lower oscillatory capacity of the DKO brain in generating spindle waves.
Figure 7.
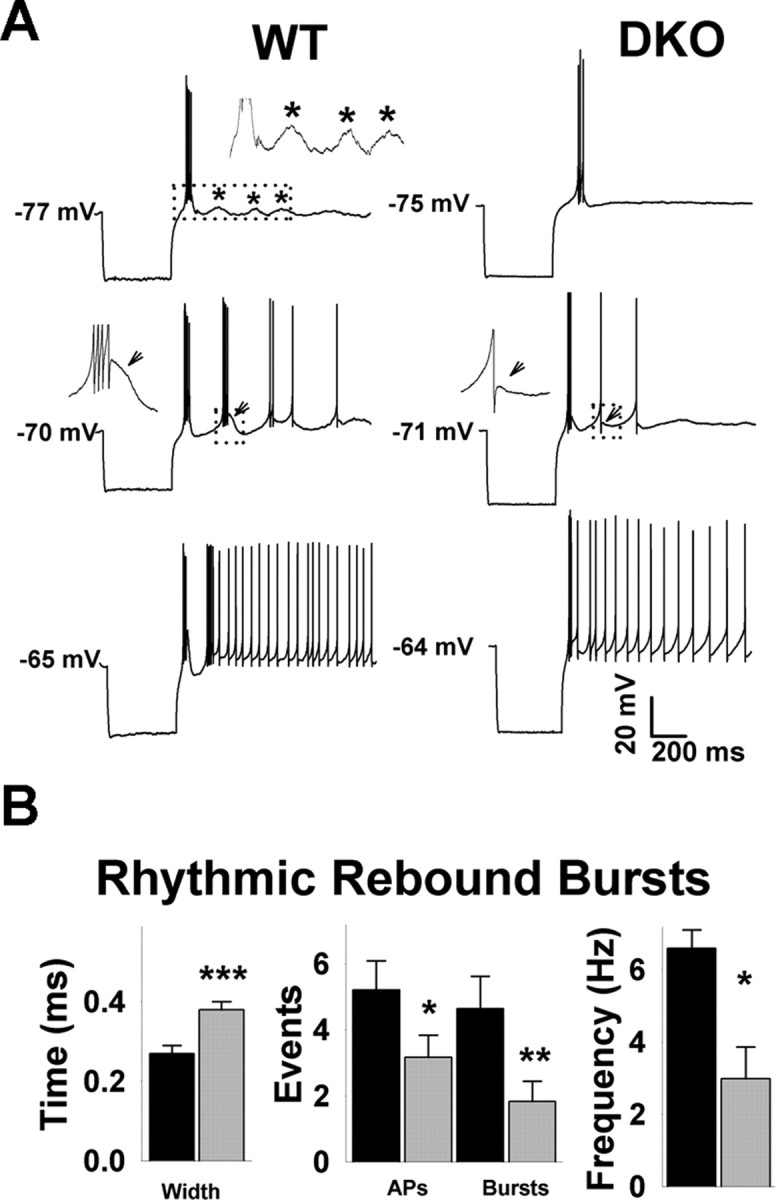
Rhythmic rebound bursts. A, TRN neurons in thalamocortical slices of WT (left) and of DKO (right) fire bursts of APs after a hyperpolarizing current step (400 ms to approximately −100 mV). The RRBs show a voltage dependence with a threshold at approximately −75 mV (top traces) and a maximal frequency at approximately −70 mV (middle traces). Responses changed to tonic firing at approximately −65 mV (bottom traces). The inset on top of the upper left trace shows depolarizing deflections of the membrane potential that likely represent rebound Ca2+ spikes that did not reach threshold for AP firing. The insets in the middle traces are expanded segments corresponding to the dotted boxes. The arrows point to putative Ca2+ spikes clearly visible at the end of a burst in WT that appear absent in DKO. B, DKO neurons show RRBs whose APs are 30% wider than in WT (left). The number of APs in the threshold burst, the maximal number of RRBs, and the frequency among bursts were significantly lower in DKO.
Discussion
We showed that in Kv3.1/Kv3.3 double mutants, similar to Kv3.1 single mutants though more pronounced (Joho et al., 1999; Porcello et al., 2002), the absolute power in the delta band (1–4 Hz) was 70% reduced during SWS, and the duration of APs in TRN neurons was 60% longer. DKO mice also showed a correlation between fewer spindles and lower delta power in the EEG during SWS. In brain slice recordings, fewer APs per burst and a reduced number and frequency of bursts in TRN neurons were observed in DKO compared with WT mice.
Slow-wave activity during reduced cortical activation
It is possible that the combined effect of reduced absolute power in the delta range, which could decrease the threshold for cortical activation, together with the elevated power at frequencies >25 Hz, which may reflect increased inputs from Kv3-deficient extrathalamic regions, results in disruption of SWA and increased arousal in DKO mice. To isolate the thalamocortical network from extrathalamic activity, we used the joint actions of reserpine and scopolamine, a powerful pharmacological tool to block cortical activation (Dringenberg and Vanderwolf, 1998). Drug application during active waking (ambulating) was sufficient to generate sleep-like, delta-wave activity in WT mice. Compared with WT, the application of these drugs in DKO mice had a smaller effect on the dynamic range of EEG power at frequencies <25 Hz. This supports the notion that the reduced SWA is not caused by monoaminergic or cholinergic hyperactivation in DKO mice but results from alterations intrinsic to the thalamocortical circuitry in DKO.
We cannot rule out, however, that neurotransmitter systems not directly affected by these drugs (e.g., glutamatergic, GABAergic, and orexinergic systems) may also be involved in increasing fast oscillations in DKO. GABAergic neurons in basal forebrain that express Kv3.1, Kv3.2, and Kv3.3 subunits (Chang et al., 2007) are thought to project to neocortex, where they are involved in the generation of gamma oscillations (Maloney et al., 1997; Lee et al., 2004) and in promoting cortical activation. In contrast, basal forebrain cholinergic neurons that do not express Kv3-type channels (Chang et al., 2007) promote wake with no direct effect on EEG oscillations (Kaur et al., 2008). Another possibility is that a mechanism intrinsic to neocortex and independent of the thalamus is involved. Fast-spiking GABAergic interneurons are involved in the generation of gamma oscillations in hippocampus and neocortex (Jefferys et al., 1996; Whittington and Traub, 2003). Like PV-containing neurons in basal forebrain, these interneurons express Kv3.1, Kv3.2, and, at lower levels, Kv3.3 (Chow et al., 1999; Chang et al., 2007), suggesting that PV-positive GABAergic neurons in the basal forebrain and neocortex might also be involved in the physiological and behavioral changes observed in DKO mice, although it is possible that the remaining Kv3.2 subunits mask the lack of Kv3.1 and Kv3.3 in these brain regions, a notion in agreement with the finding that Kv3.2 mutant mice show no alterations in the sleep–wake cycle and minimal changes in the EEG (Vyazovskiy et al., 2002).
When we reduced extrathalamic activity by increasing sleep drive through sleep-deprivation procedures, the resulting sleep loss in DKO was not compensated by increased delta power during recovery sleep, suggesting that reduced activating cortical input did not suffice to generate normal SWA in Kv3.1/Kv3.3 mutants. Several caveats preclude using this data as conclusive. The lack of delta-power rebound in DKO could be attributable to alterations in the homeostatic control of the sleep–wake cycle. This notion is supported by the fact that DKO mice did not show sleep rebound after sleep deprivation. Because animals awakening from hibernation or daily torpor show delta-power rebound (Palchykova et al., 2002), it has been suggested that the lack of sleep per se, i.e., sleep debt, and not the length of the preceding wake bout, is responsible for increasing sleep propensity. This possibility is especially important for DKO, because the actual sleep debt after a 6 h sleep deprivation would be ∼40% less compared with sleep debt in WT. It is possible that longer sleep-deprivation procedures might be needed for sleep and delta-power rebound to occur in DKO.
The role of Kv3-deficient TRN neurons in the disruption of slow oscillations
Based on a large body of experimental data and on modeling, it is now well established that the presence of Kv3-type channels facilitates brief APs and short refractory periods that enable neurons to fire at high frequencies (Rudy and McBain, 2001). We showed that TRN neurons of DKO mice have 60% increase of AP duration compared with the 20% increase in Kv3.1 single mutants (Porcello et al., 2002). Hence, the questions arise: what are the consequences of prolonged APs that likely result in increased neurotransmitter release; and what are the consequences of longer refractory periods that result in impaired high-frequency firing?
GABAergic TRN neurons send projections to thalamic relay cells and lateral local projections to other TRN neurons (Pinault et al., 1997; Pinault and Deschênes, 1998). Lateral projections among TRN neurons are thought to exert recurrent inhibition, and the blockade of GABAA receptors on TRN neurons causes seizure-like oscillations (Huguenard and Prince, 1994a). Similarly, mice lacking the GABAA receptor β3 subunit (present in thalamic reticular but not in relay neurons) show hypersynchronized field potentials that correlate with increased delta power during SWS in the mutant mouse (Huntsman et al., 1999; Wisor et al., 2002). In contrast, the selective increase in recurrent inhibition in TRN neurons by the application of benzodiazepines induces a reduction in the amplitude of slow IPSPs (GABAB component) in VB neurons with little to no effect on the fast GABAA component (Huguenard and Prince, 1994a). At the network level, these results predict a reduced synchronization among relay neurons, which, in turn, will decrease slow (<10 Hz) oscillations, as has been shown in vitro (Huguenard and Prince, 1994a) as well as in vivo (Lancel et al., 1996), and is reminiscent of the phenotype of Kv3.1 single mutant as well as Kv3.1/Kv3.3 double mutant. It is possible, therefore, that increased recurrent inhibition at TRN–TRN synapses in Kv3 mutants contributes to the weakening of synchronizations among relay cells.
In addition to the alterations of network oscillatory activity by recurrent inhibition in TRN neurons, our results with RRBs are in agreement with the notion that altered properties intrinsic to TRN neurons could also be involved in the oscillatory deficiencies in DKO. It is not yet clear why RRBs are different between WT and DKO, because rhythmic Ca2+ spikes indispensable for the generation of RRBs can be induced in TRN neurons by intracellular injection of hyperpolarizing currents in the presence of tetrodotoxin, indicating that TRN neurons can generate RRBs in the absence of AP-driven neurotransmitter release in the thalamocortical network (Bal et al., 1993). Slow K, BK, and KCNQ channels are known to be present in TRN neurons (Bal and McCormick, 1993; Cooper et al., 2001; Geiger et al., 2006; Sausbier et al., 2006). These shunting potassium conductances are known to modulate neurotransmission, excitability, and bursting properties in other neuronal types (Alger and Williamson, 1988; Robitaille and Charlton, 1992; Lorenzon and Foehring, 1995; Martire et al., 2004), explaining why the maximal level of hyperpolarization during the AHP is similar in WT and DKO. Such a mechanism could reduce charge and voltage changes on the plasma membrane and, therefore, may underlie the alterations in intrinsic oscillatory properties of TRN neurons in DKO mice. In addition, this would also explain the apparent reduction of Ca2+ spikes in DKO when in fact the corresponding Ca2+ influx through T-type Ca2+ channels may actually be normal.
In summary, recordings of GABAergic TRN neurons demonstrated increased AP duration and impaired fast spiking either in response to depolarizing currents or during RRBs. Moreover, increasing sleep drive by sleep deprivation or pharmacological blockade of cortical activation was not sufficient to generate thalamocortical oscillations in the range <15 Hz that were equivalent to those present in WT. In conclusion, these results are consistent with the involvement of Kv3.1/Kv3.3-deficient TRN neurons in the reduced capacity of the thalamocortical network in generating oscillations typical for sleep.
Footnotes
This work was supported by National Institutes of Health Grants R01 NS042210 (R.H.J.), R21 NS059632 (R.H.J.), and R01 HL64277 (G.A.M.) and by a grant from the Restless Leg Syndrome Foundation (F.E.).
References
- Alger BE, Williamson A. A transient calcium-dependent potassium component of the epileptiform burst after-hyperpolarization in rat hippocampus. J Physiol (Lond) 1988;399:191–205. doi: 10.1113/jphysiol.1988.sp017075. [DOI] [PMC free article] [PubMed] [Google Scholar]
- Bal T, McCormick DA. Mechanisms of oscillatory activity in guinea-pig nucleus reticularis thalami in vitro: a mammalian pacemaker. J Physiol (Lond) 1993;468:669–691. doi: 10.1113/jphysiol.1993.sp019794. [DOI] [PMC free article] [PubMed] [Google Scholar]
- Borbély AA, Achermann P, Trachsel L, Tobler I. Sleep initiation and initial sleep intensity: interactions of homeostatic and circadian mechanisms. J Biol Rhythms. 1989;4:149–160. [PubMed] [Google Scholar]
- Burlet S, Tyler CJ, Chow A, Joho RH, Lau D, Rudy B, Leonard CS. Immunocytochemical evidence for Kv3.1b K+ channel subunits in laterodorsal (LDT) and pedunculopontine (PPT) tegmental nuclei in mouse. Soc Neurosci Abstr. 1999;25 857.19. [Google Scholar]
- Cauli B, Porter JT, Tsuzuki K, Lambolez B, Rossier J, Quenet B, Audinat E. Classification of fusiform neocortical interneurons based on unsupervised clustering. Proc Natl Acad Sci USA. 2000;97:6144–6149. doi: 10.1073/pnas.97.11.6144. [DOI] [PMC free article] [PubMed] [Google Scholar]
- Chang SY, Zagha E, Kwon WS, Ozaita A, Bobik M, Martone ME, Ellisman MH, Heintz N, Rudy B. Distribution of Kv3.3 potassium channel subunits in distinct populations of mouse brain. J Comp Neurol. 2007;502:953–972. doi: 10.1002/cne.21353. [DOI] [PubMed] [Google Scholar]
- Chow A, Erisir A, Farb C, Nadal MS, Ozaita A, Lau D, Welker E, Rudy B. K+ channel expression distinguishes subpopulations of parvalbumin- and somatostatin-containing neocortical interneurons. J Neurosci. 1999;19:9332–9345. doi: 10.1523/JNEUROSCI.19-21-09332.1999. [DOI] [PMC free article] [PubMed] [Google Scholar]
- Cooper EC, Harrington E, Jan YN, Jan LY. M channel KCNQ2 subunits are localized to key sites for control of neuronal network oscillations and synchronization in mouse brain. J Neurosci. 2001;21:9529–9540. doi: 10.1523/JNEUROSCI.21-24-09529.2001. [DOI] [PMC free article] [PubMed] [Google Scholar]
- Diabac A. Relation of 5-hydroxytryptamine and catecholamine depletion to the central depressive action of a reserpine derivative with differential action on brain monoamines. Adv Pharmacol. 1968;6:73–74. doi: 10.1016/s1054-3589(08)60297-5. [DOI] [PubMed] [Google Scholar]
- Drewe JA, Verma S, Frech G, Joho RH. Distinct spatial and temporal expression patterns of K+ channel mRNAs from different subfamilies. J Neurosci. 1992;12:538–548. doi: 10.1523/JNEUROSCI.12-02-00538.1992. [DOI] [PMC free article] [PubMed] [Google Scholar]
- Dringenberg HC, Vanderwolf CH. Involvement of direct and indirect pathways in electrocorticographic activation. Neurosci Biobehav Rev. 1998;22:243–257. doi: 10.1016/s0149-7634(97)00012-2. [DOI] [PubMed] [Google Scholar]
- Dringenberg HC, Vanderwolf CH, Noseworthy PA. Superior colliculus stimulation enhances neocortical serotonin release and electrocorticographic activation in the urethane-anesthetized rat. Brain Res. 2003;964:31–41. doi: 10.1016/s0006-8993(02)04062-3. [DOI] [PubMed] [Google Scholar]
- Elton M, Winter O, Heslenfeld D, Loewy D, Campbell K, Kok A. Event-related potentials to tones in the absence and presence of sleep spindles. J Sleep Res. 1997;6:78–83. doi: 10.1046/j.1365-2869.1997.00033.x. [DOI] [PubMed] [Google Scholar]
- Erickson JD, Schafer MK, Bonner TI, Eiden LE, Weihe E. Distinct pharmacological properties and distribution in neurons and endocrine cells of two isoforms of the human vesicular monoamine transporter. Proc Natl Acad Sci USA. 1996;93:5166–5171. doi: 10.1073/pnas.93.10.5166. [DOI] [PMC free article] [PubMed] [Google Scholar]
- Espinosa F, McMahon A, Chan E, Wang S, Ho CS, Heintz N, Joho RH. Alcohol hypersensitivity, increased locomotion, and spontaneous myoclonus in mice lacking the potassium channels Kv3.1 and Kv3.3. J Neurosci. 2001;21:6657–6665. doi: 10.1523/JNEUROSCI.21-17-06657.2001. [DOI] [PMC free article] [PubMed] [Google Scholar]
- Espinosa F, Marks G, Heintz N, Joho RH. Increased motor drive and sleep loss in mice lacking Kv3-type potassium channels. Genes Brain Behav. 2004;3:90–100. doi: 10.1046/j.1601-183x.2003.00054.x. [DOI] [PubMed] [Google Scholar]
- Franken P, Dijk DJ, Tobler I, Borbely AA. Sleep deprivation in rats: effects on EEG power spectra, vigilance states, and cortical temperature. Am J Physiol. 1991;261:R198–R208. doi: 10.1152/ajpregu.1991.261.1.R198. [DOI] [PubMed] [Google Scholar]
- Franken P, Malafosse A, Tafti M. Genetic determinants of sleep regulation in inbred mice. Sleep. 1999;22:155–169. [PubMed] [Google Scholar]
- Fuentealba P, Steriade M. The reticular nucleus revisited: intrinsic and network properties of a thalamic pacemaker. Prog Neurobiol. 2005;75:125–141. doi: 10.1016/j.pneurobio.2005.01.002. [DOI] [PubMed] [Google Scholar]
- Fuentealba P, Timofeev I, Steriade M. Prolonged hyperpolarizing potentials precede spindle oscillations in the thalamic reticular nucleus. Proc Natl Acad Sci USA. 2004;101:9816–9821. doi: 10.1073/pnas.0402761101. [DOI] [PMC free article] [PubMed] [Google Scholar]
- Geiger J, Weber YG, Landwehrmeyer B, Sommer C, Lerche H. Immunohistochemical analysis of KCNQ3 potassium channels in mouse brain. Neurosci Lett. 2006;400:101–104. doi: 10.1016/j.neulet.2006.02.017. [DOI] [PubMed] [Google Scholar]
- Ho CS, Grange RW, Joho RH. Pleiotropic effects of a disrupted K+ channel gene: reduced body weight, impaired motor skill and muscle contraction, but no seizures. Proc Natl Acad Sci USA. 1997;94:1533–1538. doi: 10.1073/pnas.94.4.1533. [DOI] [PMC free article] [PubMed] [Google Scholar]
- Huber R, Deboer T, Tobler I. Effects of sleep deprivation on sleep and sleep EEG in three mouse strains: empirical data and simulations. Brain Res. 2000;857:8–19. doi: 10.1016/s0006-8993(99)02248-9. [DOI] [PubMed] [Google Scholar]
- Huguenard JR, Prince DA. A novel T-type current underlies prolonged Ca2+-dependent burst firing in GABAergic neurons of rat thalamic reticular nucleus. J Neurosci. 1992;12:3804–3817. doi: 10.1523/JNEUROSCI.12-10-03804.1992. [DOI] [PMC free article] [PubMed] [Google Scholar]
- Huguenard JR, Prince DA. Clonazepam suppresses GABAB-mediated inhibition in thalamic relay neurons through effects in nucleus reticularis. J Neurophysiol. 1994a;71:2576–2581. doi: 10.1152/jn.1994.71.6.2576. [DOI] [PubMed] [Google Scholar]
- Huguenard JR, Prince DA. Intrathalamic rhythmicity studied in vitro: nominal T-current modulation causes robust antioscillatory effects. J Neurosci. 1994b;14:5485–5502. doi: 10.1523/JNEUROSCI.14-09-05485.1994. [DOI] [PMC free article] [PubMed] [Google Scholar]
- Huntsman MM, Porcello DM, Homanics GE, DeLorey TM, Huguenard JR. Reciprocal inhibitory connections and network synchrony in the mammalian thalamus. Science. 1999;283:541–543. doi: 10.1126/science.283.5401.541. [DOI] [PubMed] [Google Scholar]
- Jefferys JG, Traub RD, Whittington MA. Neuronal networks for induced ‘40 Hz’ rhythms. Trends Neurosci. 1996;19:202–208. doi: 10.1016/s0166-2236(96)10023-0. [DOI] [PubMed] [Google Scholar]
- Joho RH, Ho CS, Marks GA. Increased gamma- and decreased delta-oscillations in a mouse deficient for a potassium channel expressed in fast-spiking interneurons. J Neurophysiol. 1999;82:1855–1864. doi: 10.1152/jn.1999.82.4.1855. [DOI] [PubMed] [Google Scholar]
- Joho RH, Marks GA, Espinosa F. Kv3 potassium channels control the duration of different arousal states by distinct stochastic and clock-like mechanisms. Eur J Neurosci. 2006a;23:1567–1574. doi: 10.1111/j.1460-9568.2006.04672.x. [DOI] [PubMed] [Google Scholar]
- Joho RH, Street C, Matsushita S, Knopfel T. Behavioral motor dysfunction in Kv3-type potassium channel-deficient mice. Genes Brain Behav. 2006b;5:472–482. doi: 10.1111/j.1601-183X.2005.00184.x. [DOI] [PubMed] [Google Scholar]
- Kaur S, Junek A, Black MA, Semba K. Effects of ibotenate and 192IgG-saporin lesions of the nucleus basalis magnocellularis/substantia innominata on spontaneous sleep and wake states and recovery sleep after sleep deprivation in rats. J Neurosci. 2008;28:491–504. doi: 10.1523/JNEUROSCI.1585-07.2008. [DOI] [PMC free article] [PubMed] [Google Scholar]
- Lancel M, Cronlein TA, Faulhaber J. Role of GABAA receptors in sleep regulation. Differential effects of muscimol and midazolam on sleep in rats. Neuropsychopharmacology. 1996;15:63–74. doi: 10.1016/0893-133X(95)00157-9. [DOI] [PubMed] [Google Scholar]
- Lau D, Vega-Saenz de Miera EC, Contreras D, Ozaita A, Harvey M, Chow A, Noebels JL, Paylor R, Morgan JI, Leonard CS, Rudy B. Impaired fast-spiking, suppressed cortical inhibition, and increased susceptibility to seizures in mice lacking Kv3.2 K+ channel proteins. J Neurosci. 2000;20:9071–9085. doi: 10.1523/JNEUROSCI.20-24-09071.2000. [DOI] [PMC free article] [PubMed] [Google Scholar]
- Lee MG, Manns ID, Alonso A, Jones BE. Sleep-wake related discharge properties of basal forebrain neurons recorded with micropipettes in head-fixed rats. J Neurophysiol. 2004;92:1182–1198. doi: 10.1152/jn.01003.2003. [DOI] [PubMed] [Google Scholar]
- Lorenzon NM, Foehring RC. Alterations in intracellular calcium chelation reproduce developmental differences in repetitive firing and afterhyperpolarizations in rat neocortical neurons. Dev Brain Res. 1995;84:192–203. doi: 10.1016/0165-3806(94)00171-u. [DOI] [PubMed] [Google Scholar]
- Macica CM, von Hehn CA, Wang LY, Ho CS, Yokoyama S, Joho RH, Kaczmarek LK. Modulation of the Kv3.1b potassium channel isoform adjusts the fidelity of the firing pattern of auditory neurons. J Neurosci. 2003;23:1133–1141. doi: 10.1523/JNEUROSCI.23-04-01133.2003. [DOI] [PMC free article] [PubMed] [Google Scholar]
- Maloney KJ, Cape EG, Gotman J, Jones BE. High-frequency gamma electroencephalogram activity in association with sleep-wake states and spontaneous behaviors in the rat. Neuroscience. 1997;76:541–555. doi: 10.1016/s0306-4522(96)00298-9. [DOI] [PubMed] [Google Scholar]
- Marini G, Ceccarelli P, Macia M. Effects of bilateral microinjections of ibotenic acid in the thalamic reticular nucleus on delta oscillations and sleep in freely-moving rats. J Sleep Res. 2000;9:359–366. doi: 10.1046/j.1365-2869.2000.00224.x. [DOI] [PubMed] [Google Scholar]
- Marks GA, Roffwarg HP. Spontaneous activity in the thalamic reticular nucleus during the sleep/wake cycle of the freely-moving rat. Brain Res. 1993;623:241–248. doi: 10.1016/0006-8993(93)91434-t. [DOI] [PubMed] [Google Scholar]
- Martire M, Castaldo P, D'Amico M, Preziosi P, Annunziato L, Taglialatela M. M channels containing KCNQ2 subunits modulate norepinephrine, aspartate, and GABA release from hippocampal nerve terminals. J Neurosci. 2004;24:592–597. doi: 10.1523/JNEUROSCI.3143-03.2004. [DOI] [PMC free article] [PubMed] [Google Scholar]
- Matsukawa H, Wolf AM, Matsushita S, Joho RH, Knopfel T. Motor dysfunction and altered synaptic transmission at the parallel fiber–Purkinje cell synapse in mice lacking potassium channels Kv3.1 and Kv3.3. J Neurosci. 2003;23:7677–7684. doi: 10.1523/JNEUROSCI.23-20-07677.2003. [DOI] [PMC free article] [PubMed] [Google Scholar]
- McMahon A, Fowler SC, Perney TM, Akemann W, Knopfel T, Joho RH. Allele-dependent changes of olivocerebellar circuit properties in the absence of the voltage-gated potassium channels Kv3.1 and Kv3.3. Eur J Neurosci. 2004;19:3317–3327. doi: 10.1111/j.0953-816X.2004.03385.x. [DOI] [PubMed] [Google Scholar]
- Metherate R, Cox CL, Ashe JH. Cellular bases of neocortical activation: modulation of neuronal oscillations by the nucleus basalis and endogenous acetylcholine. J Neurosci. 1992;12:4701–4711. doi: 10.1523/JNEUROSCI.12-12-04701.1992. [DOI] [PMC free article] [PubMed] [Google Scholar]
- Neckelmann D, Ursin R. Sleep stages and EEG power spectrum in relation to acoustical stimulus arousal threshold in the rat. Sleep. 1993;16:467–477. [PubMed] [Google Scholar]
- Nuñez A, Curró Dossi R, Contreras D, Steriade M. Intracellular evidence for incompatibility between spindle and delta oscillations in thalamocortical neurons of cat. Neuroscience. 1992;48:75–85. doi: 10.1016/0306-4522(92)90339-4. [DOI] [PubMed] [Google Scholar]
- Ozaita A, Martone ME, Ellisman MH, Rudy B. Differential subcellular localization of the two alternatively spliced isoforms of the Kv3.1 potassium channel subunit in brain. J Neurophysiol. 2002;88:394–408. doi: 10.1152/jn.2002.88.1.394. [DOI] [PubMed] [Google Scholar]
- Ozaita A, Petit-Jacques J, Volgyi B, Ho CS, Joho RH, Bloomfield SA, Rudy B. A unique role for Kv3 voltage-gated potassium channels in starburst amacrine cell signaling in mouse retina. J Neurosci. 2004;24:7335–7343. doi: 10.1523/JNEUROSCI.1275-04.2004. [DOI] [PMC free article] [PubMed] [Google Scholar]
- Palchykova S, Deboer T, Tobler I. Selective sleep deprivation after daily torpor in the Djungarian hamster. J Sleep Res. 2002;11:313–319. doi: 10.1046/j.1365-2869.2002.00310.x. [DOI] [PubMed] [Google Scholar]
- Perney TM, Marshall J, Martin KA, Hockfield S, Kaczmarek LK. Expression of the mRNAs for the Kv3.1 potassium channel gene in the adult and developing rat brain. J Neurophysiol. 1992;68:756–766. doi: 10.1152/jn.1992.68.3.756. [DOI] [PubMed] [Google Scholar]
- Pinault D, Deschênes M. Anatomical evidence for a mechanism of lateral inhibition in the rat thalamus. Eur J Neurosci. 1998;10:3462–3469. doi: 10.1046/j.1460-9568.1998.00362.x. [DOI] [PubMed] [Google Scholar]
- Pinault D, Smith Y, Deschênes M. Dendrodendritic and axoaxonic synapses in the thalamic reticular nucleus of the adult rat. J Neurosci. 1997;17:3215–3233. doi: 10.1523/JNEUROSCI.17-09-03215.1997. [DOI] [PMC free article] [PubMed] [Google Scholar]
- Porcello DM, Ho CS, Joho RH, Huguenard JR. Resilient RTN fast spiking in Kv3.1 null mice suggests redundancy in the action potential repolarization mechanism. J Neurophysiol. 2002;87:1303–1310. doi: 10.1152/jn.00556.2001. [DOI] [PubMed] [Google Scholar]
- Robitaille R, Charlton MP. Presynaptic calcium signals and transmitter release are modulated by calcium-activated potassium channels. J Neurosci. 1992;12:297–305. doi: 10.1523/JNEUROSCI.12-01-00297.1992. [DOI] [PMC free article] [PubMed] [Google Scholar]
- Rudy B, McBain CJ. Kv3 channels: voltage-gated K+ channels designed for high-frequency repetitive firing. Trends Neurosci. 2001;24:517–526. doi: 10.1016/s0166-2236(00)01892-0. [DOI] [PubMed] [Google Scholar]
- Sausbier U, Sausbier M, Sailer CA, Arntz C, Knaus HG, Neuhuber W, Ruth P. Ca2+-activated K+ channels of the BK-type in the mouse brain. Histochem Cell Biol. 2006;125:725–741. doi: 10.1007/s00418-005-0124-7. [DOI] [PubMed] [Google Scholar]
- Sekirnjak C, Martone ME, Weiser M, Deerinck T, Bueno E, Rudy B, Ellisman M. Subcellular localization of K+ channel subunit Kv3.1b in selected rat CNS neurons. Brain Res. 1997;766:173–187. doi: 10.1016/s0006-8993(97)00527-1. [DOI] [PubMed] [Google Scholar]
- Somerville AR, Whittle BA. The interrelation of hypothermia and depletion of noradrenaline, dopamine and 5-hydroxytryptamine from brain by reserpine, para-chlorophenylalanine and alpha-methylmetatyrosine. Br J Pharmacol Chemother. 1967;31:120–131. doi: 10.1111/j.1476-5381.1967.tb01982.x. [DOI] [PMC free article] [PubMed] [Google Scholar]
- Steriade M, Domich L, Oakson G. Reticularis thalami neurons revisited: activity changes during shifts in states of vigilance. J Neurosci. 1986;6:68–81. doi: 10.1523/JNEUROSCI.06-01-00068.1986. [DOI] [PMC free article] [PubMed] [Google Scholar]
- Steriade M, Domich L, Oakson G, Deschênes M. The deafferented reticular thalamic nucleus generates spindle rhythmicity. J Neurophysiol. 1987;57:260–273. doi: 10.1152/jn.1987.57.1.260. [DOI] [PubMed] [Google Scholar]
- Steriade M, Curro Dossi R, Nuñez A. Network modulation of a slow intrinsic oscillation of cat thalamocortical neurons implicated in sleep delta waves: cortically induced synchronization and brainstem cholinergic suppression. J Neurosci. 1991;11:3200–3217. doi: 10.1523/JNEUROSCI.11-10-03200.1991. [DOI] [PMC free article] [PubMed] [Google Scholar]
- Szymusiak R. Magnocellular nuclei of the basal forebrain: substrates of sleep and arousal regulation. Sleep. 1995;18:478–500. doi: 10.1093/sleep/18.6.478. [DOI] [PubMed] [Google Scholar]
- Timofeev I, Contreras D, Steriade M. Synaptic responsiveness of cortical and thalamic neurones during various phases of slow sleep oscillation in cat. J Physiol (Lond) 1996;494:265–278. doi: 10.1113/jphysiol.1996.sp021489. [DOI] [PMC free article] [PubMed] [Google Scholar]
- Tobler I, Borbély AA. Sleep EEG in the rat as a function of prior waking. Electroencephalogr Clin Neurophysiol. 1986;64:74–76. doi: 10.1016/0013-4694(86)90044-1. [DOI] [PubMed] [Google Scholar]
- Tobler I, Borbély AA. The effect of 3-h and 6-h sleep deprivation on sleep and EEG spectra of the rat. Behav Brain Res. 1990;36:73–78. doi: 10.1016/0166-4328(90)90161-7. [DOI] [PubMed] [Google Scholar]
- von Krosigk M, Bal T, McCormick DA. Cellular mechanisms of a synchronized oscillation in the thalamus. Science. 1993;261:361–364. doi: 10.1126/science.8392750. [DOI] [PubMed] [Google Scholar]
- Vyazovskiy VV, Deboer T, Rudy B, Lau D, Borbély AA, Tobler I. Sleep EEG in mice that are deficient in the potassium channel subunit Kv3.2. Brain Res. 2002;947:204–211. doi: 10.1016/s0006-8993(02)02925-6. [DOI] [PubMed] [Google Scholar]
- Wang Y, Toledo-Rodriguez M, Gupta A, Wu C, Silberberg G, Luo J, Markram H. Anatomical, physiological and molecular properties of Martinotti cells in the somatosensory cortex of the juvenile rat. J Physiol (Lond) 2004;561:65–90. doi: 10.1113/jphysiol.2004.073353. [DOI] [PMC free article] [PubMed] [Google Scholar]
- Warren RA, Agmon A, Jones EG. Oscillatory synaptic interactions between ventroposterior and reticular neurons in mouse thalamus in vitro. J Neurophysiol. 1994;72:1993–2003. doi: 10.1152/jn.1994.72.4.1993. [DOI] [PubMed] [Google Scholar]
- Weiser M, Vega-Saenz de Miera E, Kentros C, Moreno H, Franzen L, Hillman D, Baker H, Rudy B. Differential expression of Shaw-related K+ channels in the rat central nervous system. J Neurosci. 1994;14:949–972. doi: 10.1523/JNEUROSCI.14-03-00949.1994. [DOI] [PMC free article] [PubMed] [Google Scholar]
- Weiser M, Bueno E, Sekirnjak C, Martone ME, Baker H, Hillman D, Chen S, Thornhill W, Ellisman M, Rudy B. The potassium channel subunit Kv3.1b is localized to somatic and axonal membranes of specific populations of CNS neurons. J Neurosci. 1995;15:4298–4314. doi: 10.1523/JNEUROSCI.15-06-04298.1995. [DOI] [PMC free article] [PubMed] [Google Scholar]
- Whittington MA, Traub RD. Interneuron diversity series: inhibitory interneurons and network oscillations in vitro. Trends Neurosci. 2003;26:676–682. doi: 10.1016/j.tins.2003.09.016. [DOI] [PubMed] [Google Scholar]
- Wisor JP, DeLorey TM, Homanics GE, Edgar DM. Sleep states and sleep electroencephalographic spectral power in mice lacking the beta 3 subunit of the GABAA receptor. Brain Res. 2002;955:221–228. doi: 10.1016/s0006-8993(02)03467-4. [DOI] [PubMed] [Google Scholar]