

Abstract
Selective attention lends relevant sensory input priority access to higher-level brain areas and ultimately to behavior. Recent studies have suggested that those neurons in visual areas that are activated by an attended stimulus engage in enhanced gamma-band (30–70 Hz) synchronization compared with neurons activated by a distracter. Such precise synchronization could enhance the postsynaptic impact of cells carrying behaviorally relevant information. Previous studies have used the local field potential (LFP) power spectrum or spike-LFP coherence (SFC) to indirectly estimate spike synchronization. Here, we directly demonstrate zero-phase gamma-band coherence among spike trains of V4 neurons. This synchronization was particularly evident during visual stimulation and enhanced by selective attention, thus confirming the pattern inferred from LFP power and SFC. We therefore investigated the time course of LFP gamma-band power and found rapid dynamics consistent with interactions of top-down spatial and feature attention with bottom-up saliency. In addition to the modulation of synchronization during visual stimulation, selective attention significantly changed the prestimulus pattern of synchronization. Attention inside the receptive field of the recorded neuronal population enhanced gamma-band synchronization and strongly reduced α-band (9–11 Hz) synchronization in the prestimulus period. These results lend further support for a functional role of rhythmic neuronal synchronization in attentional stimulus selection.
Keywords: synchronization, oscillation, coherence, gamma, α, attention
Introduction
Our remarkable capacity to recognize objects critically relies on response characteristics of neurons at later stages of visual cortex, particularly within the inferotemporal (IT) cortex. IT neurons respond selectively to complex objects composed of simpler visual features and may gain some of this selectivity during learning (Erickson and Desimone, 1999; Baker et al., 2002; Sigala and Logothetis, 2002). One aspect underlying such complex representations in IT cortex is that receptive fields (RFs) span much of the central visual field. During natural vision, such a RF will typically contain multiple competing objects. However, when attention is directed to one of those objects, the respective neuronal response is biased toward the response that would be obtained if only the attended stimulus were presented (Moran and Desimone, 1985; Chelazzi et al., 1993; Desimone and Duncan, 1995; Sheinberg and Logothetis, 2001). Such a dynamic bias of responses in IT cortex will partly be attributable to a selective modulation of the neuronal input from earlier visual areas such as area V4, containing neurons with smaller RFs and thus coding for only a fraction of the visual space compared with IT neurons (Reynolds et al., 1999). Thus, attention likely enhances (reduces) the postsynaptic impact of those neuronal groups in area V4 processing attended (nonattended) stimuli or stimulus features.
Previous studies have shown that attention accomplishes such a dynamic routing of sensory information in cortex not only by enhancing the spiking rate of input neurons, but also by enhancing precise synchronization of neuronal groups activated by the attended stimulus (Fries et al., 2001; Bichot et al., 2005; Taylor et al., 2005; Womelsdorf et al., 2006). Enhanced synchronization of the spiking output of selective neuronal groups could enhance their impact on postsynaptic target cells (Salinas and Sejnowski, 2001; Azouz and Gray, 2003) and could establish a robust communication structure among activated neuronal groups by imposing a selective pattern of synchronization across cortical areas (Fries, 2005; Womelsdorf et al., 2007). However, previous reports of enhancements of synchronization with selective visual attention estimated synchronization of spike output from a visual area only indirectly by measuring local field potential (LFP) oscillatory activity (Taylor et al., 2005), or coherence between neuronal spiking activity with the LFP (Fries et al., 2001; Bichot et al., 2005; Womelsdorf et al., 2006).
Here, we investigate the rhythmic synchronization among spike trains and extend previous findings in several critical respects. We report that the spiking output of neurons in area V4 synchronizes in the gamma-frequency band at near-zero time lag during visual stimulation and show that this spike-to-spike synchronization is enhanced with selective attention. Furthermore, we illustrate that synchronization and spiking rates are dynamically modulated by bottom-up saliency in addition to top-down attention during the course of the task. Although some previous analyses of the recordings reported in the present study have been published (Fries et al., 2001; Womelsdorf et al., 2006, 2007), our new analysis is focused on unexplored aspects of the data and thereby reveals substantial new results.
Materials and Methods
Experimental procedure.
Experiments were performed in two hemispheres of two male rhesus monkeys (Macaca mulatta) and followed guidelines of the National Institutes of Health with approval by the National Institute of Mental Health Intramural Animal Care and Use Committee. The prelunate gyrus was first localized using magnetic resonance image (MRI) scans. Recording chambers were then implanted over the prelunate gyrus under surgical anesthesia. Before recording through small trepanations of the skull within the recording chamber, four to eight tungsten microelectrodes (impedances of 1–2 MΩ) were advanced separately at a very slow rate (1.5 μm/s) to minimize deformation of the cortical surface by the electrode (“dimpling”). Electrode tips were separated by 650 or 900 μm. Data amplification, filtering, and acquisition were done with a Multichannel Acquisition Processor (Plexon, Dallas, TX). The signal from each electrode was passed through a headstage with unit gain and an output impedance of 240 Ω and then split to separately extract the spike and the LFP components. For spike recordings, the signals were filtered with a passband of 100–8000 Hz, further amplified, and digitized with 40 kHz. A threshold was set interactively, and spike waveforms were stored for a time window from 150 μs before to 700 μs after threshold crossing. The threshold clearly separated spikes from noise but was chosen to include multiunit activity (MUA). Off-line, we performed a principal component analysis of the waveforms and plotted the first against the second principal component. Those waveforms that corresponded to artifacts were excluded. For multiunit analyses, all other waveforms were accepted, and the times of threshold crossing were kept and downsampled to 1 kHz. For LFP recordings, the signals were filtered with a passband of 0.7–170 Hz, further amplified, and digitized at 1 kHz.
The powerline artifact was removed from the LFP using the following procedure: all signals had been recorded continuously for the entire duration of the recording session. For each time epoch of interest (and each recording channel), we first took a 10 s epoch out of the continuous signal with the epoch of interest in the middle. We then calculated the discrete Fourier transform (DFT) of the 10 s epoch at 60, 120, and 180 Hz without any tapering. Because the powerline artifact is of a perfectly constant frequency, the 10 s epoch contains integer cycles of the artifact frequencies and nearly all the artifact energy is contained in those DFTs. We then constructed 60, 120, and 180 Hz sine waves with the amplitudes and phases as estimated by the respective DFTs and subtracted those sine waves from the 10 s epoch. The epoch of interest was then cut out of the cleaned 10 s epoch. Power spectra of the cleaned 10 s epochs demonstrated that all artifact energy was eliminated, leaving a notch of a bin width of 0.1 Hz (= 1/10 s). The actual spectral analysis used the multitaper method, with a spectral smoothing beyond ±1 Hz (see below), so that the notch became invisible.
At the start of the recordings, each electrode was lowered separately until it recorded visually driven activity. Once this had been achieved for all electrodes, we fine tuned the electrode positions to optimize the signal-to-noise ratio of the multiple spike recordings. Because the penetration was halted as soon as clear visually driven activity was obtained, most of the recordings were presumably done from the superficial layers of the cortex. To confirm the recording position without killing the animal, we obtained a structural MRI with one electrode in place, confirming the placement in the appropriate portion of the prelunate gyrus. RF position and neuronal stimulus selectivity were as expected for the target part of area V4.
Visual stimulation and experimental paradigm.
Stimuli were presented on a 17 inch cathode ray tube monitor 0.57 m from the monkey's eyes that had a resolution of 800 × 600 pixels and a screen refresh rate of 120 Hz noninterlaced. Stimulus generation and behavioral control were accomplished with the CORTEX software package (www.cortex.salk.edu).
A trial started when the monkey touched a bar and directed its gaze within 0.7° of the fixation spot on the computer screen (Fig. 1). When we used trial-by-trial cueing of selective attention, first the cue appeared, followed after 1500–2000 ms by the stimulus (see below for more detail on the different cueing regimens used). The general task of the monkey was to release the bar between 150 and 650 ms after a change in stimulus color (i.e., a change of the white stripes of the grating to photometrically isoluminant yellow). That change in stimulus color could occur at an unpredictable moment in time between 500 and 5000 ms after stimulus onset. All times during this period were equally likely for the color change. Note that as a consequence, the conditional probability of a color change, given that no color change has yet happened, increased with time to reach unity at 5000 ms after stimulus onset. Successful trial completion was rewarded with four drops of diluted apple juice. If the monkey released the bar too early or if it moved its gaze out of the fixation window, the trial was immediately aborted and followed by a timeout.
Figure 1.

Experimental protocol. A, B, Sequence of trial events in trials when the first stimulus change is that of the attended target stimulus (A) and when the distracter stimulus changes before the target stimulus (B). Target and distracter event lines are thickened when the color of the respective stimulus is changed.
For initial RF mapping, the monkey was rewarded for maintaining fixation on a target and detecting a color change of the target. RFs were mapped by presenting task-irrelevant flashing bars of variable size and orientation. RFs of all recording sites from one session typically overlapped substantially.
Next, direction tuning curves were compiled for all electrodes simultaneously. For this, a circular patch of drifting square-wave luminance grating (100% contrast, 2–3° diameter, 1–2°/s drift rate, 1–2 cycles/degree of spatial frequency) was adjusted in size and location to fit into the region of RF overlap. The orientation of the stripes of the grating was always orthogonal to the movement direction, which was varied in steps of 45°. During those measurements, the monkey had to detect a change of the white grating stripes to photometrically isoluminant yellow. At least five repetitions were collected per movement direction.
For testing the effect of selective visual attention, we selected the patch of drifting grating from the orientation tuning that had resulted in maximal coactivation of the simultaneously recorded units. Note that the selected grating could therefore not activate all sites to a similar extent, but necessarily ended up being suboptimal or (rarely) even suppressive for some sites. A second patch of drifting grating was placed outside the region of RF overlap. This patch was identical to the inside-RF patch with regard to eccentricity, size, contrast, and spatial and temporal frequency, but its orientation was rotated by 90°. This was done to avoid preattentive perceptual binding of the two patches of grating. Two patches of grating moving in orthogonal direction can nevertheless be perceived as part of one pattern moving behind two apertures, if the movement directions are consistent with this interpretation. To preclude this, the movement direction of the patch outside the RFs was chosen to be inconsistent with this interpretation. For most recording sessions, the position of the outside-RF patch was 90° away (counterclockwise) from the inside-RF patch at that eccentricity. For a subset of recordings, it was moved to be as close as possible to the RF without evoking a stimulus-driven response.
Both stimuli could change color with equal likelihood. However, one of the stimuli was cued as the target, and the monkey's task was to respond to color changes in the target and ignore changes in the other stimulus, the distracter. The color changes were close to the monkey's detection threshold, ensuring that the task could only be performed when attention was actually allocated to the target. On the 50% of the trials in which the distracter changed before the target (Fig. 1B), the target nevertheless changed later on in the trial. Those target changes were distributed equally in the remaining time between distracter changes and 5000 ms after stimulus onset.
We used three different cueing paradigms for directing selective visual attention and all of them gave essentially identical results. Two of the paradigms used trial-by-trial cueing. The cue stayed on during the trial and was either a short (0.75°) line next to the fixation spot, pointing to the location of the target or, alternatively, the fixation spot color, red cueing the upper and green cueing the lower stimulus. In the rest of the recording sessions, we used a blocked trial design. Blocks consisted of 20 trials. The first two trials in a block were instruction trials in which only one of the two stimuli was shown and the monkey performed the task on that stimulus. The location of that stimulus was the target location for that block. For the remainder of the block, both stimuli were shown together without any further cue. Thus, in the block design, the different attention conditions were physically identical. We recorded 100–300 correctly performed trials per attention condition.
Data analysis.
All data analysis was done in Matlab (MathWorks, Natick, MA) and using the FieldTrip open source Matlab toolbox (http://www.ru.nl/fcdonders/fieldtrip/). We quantified power and coherence spectra and firing rates separately for the prestimulus period (the 1 s before stimulus onset) and for the sustained epoch with constant visual stimulation until the first stimulus change (excluding the first 300 ms after stimulus onset with response onset transients) (Fig. 1, color shaded areas). These two epochs were sufficiently long to deliver enough spikes for a reliable estimate of spike–spike coherence (SSC). For both time epochs, we cut the data into non-overlapping time segments. We used two different time segment lengths for spectral analysis at high and low frequencies. For frequencies of 2–22 Hz, we cut the data into non-overlapping 1000 ms segments to allow for a spectral resolution of 1 Hz. Higher frequencies (>22 Hz) were analyzed in non-overlapping 250 ms segments providing a spectral resolution of 4 Hz. For each comparison between conditions (including the comparison between the prestimulus interval and stimulation), we equalized the number of data segments for both conditions before spectral analysis by randomly discarding data epochs from the condition with a higher number of segments. This equalization prevents any bias for the spectral estimates that could potentially be introduced by unequal numbers of trials.
In addition to the described procedure, we performed a time-resolved analysis of attentional modulation, which included the time around the change of targets or distracters (see below). Our design included two attentional conditions with attention directed either inside or outside the RF of the recorded neuronal population.
Spectral analysis.
Exploratory data analysis demonstrated several oscillatory components at low (∼4 and 10 Hz) and high (∼60 Hz) frequencies, which occupied frequency bands that varied in width, with the width increasing with the main frequency of the component. For this reason, we used different tapers for the analysis of low and high frequencies. For frequencies up to 22 Hz, we used a single Hanning taper and applied fast Fourier transforms to the Hanning-tapered trials. For frequencies beyond 22 Hz, we used multitaper methods to achieve optimal spectral concentration (Mitra and Pesaran, 1999; Jarvis and Mitra, 2001; Pesaran et al., 2002). Multitaper methods involve the use of multiple data tapers for spectral estimation. A segment of data is multiplied by a data taper before Fourier transformation. A variety of tapers can be used, but an optimal family of orthogonal tapers is given by the prolate spheroidal functions or Slepian functions. These are parameterized by their length in time, T, and their bandwidth in frequency, W. For a choice of T and W, up to K = 2TW − 1 tapers are concentrated in frequency and suitable for use in spectral estimation. We used seven Slepian tapers, providing an effective taper smoothing of ±14 Hz. For each taper, the data segment was multiplied with that taper and Fourier transformed, giving the windowed Fourier transform, x̃k(f):
 |
where xt, (t = 1, 2, …N) is the time series of the signal under consideration and wk(t), (k = 1, 2, …K) are K orthogonal taper functions. For spike signals, the firing rate was represented with a bin width of 1 ms and subjected to spectral analysis like LFPs.
The multitaper estimates for the spectrum Sx(f) and the cross-spectrum Syx(f) are given by the following:
 |
 |
Spectra and cross-spectra are averaged over trials before calculating the coherency Cyx(f):
 |
Coherency is a complex quantity. Its absolute value is termed coherence and ranges from 0 to 1. A coherence value of 1 indicates that the two signals have a constant phase relationship (and amplitude covariation), and a value of 0 indicates the absence of any phase relationship.
Testing for statistical significance of differences between spectra.
We were interested in the difference of relative LFP power, spike field coherence (SFC), and SSC between the pre-stimulus time epoch and the sustained stimulation period and between the attention inside and attention outside the RF conditions. To test for the statistical significance of the differences, we performed a nonparametric permutation test, with the median difference between conditions as our test statistic. The test involves a comparison of the observed difference against a reference distribution of differences under the null hypothesis of no significant modulation of the LFP power, SFC, or SSC at individual frequencies between conditions. The reference distribution was obtained by performing the following procedure 1000 times. For each recording site (or pairs of sites), a random decision was made to which condition the data from either condition was assigned. We then calculated the test statistic at each frequency for these randomly assigned conditions and stored only the minimal and maximal difference across frequencies. From the resulting distribution of 1000 minimal and maximal differences, we determined the 2.5th and the 97.5th percentile. The empirically observed, nonrandomized difference at a particular frequency was considered statistically significant (p < 0.05), when it was larger than the 97.5th or smaller than the 2.5th percentile of the reference distribution. This procedure corresponds to a two-sided test with a global false positive rate of 5% and correction for the multiple comparisons across frequencies.
Time-dependent analysis of gamma-band synchronization and firing rate.
To analyze the temporal evolution of attentional modulation, we calculated LFP power in the gamma-frequency band and firing rate with a sliding-window analysis around the time of stimulus onset and around the time of the color change of the target and distracter. LFP power at 60 Hz was estimated for windows of ±125 ms that were slid over the data in 20 ms steps. Spectral estimation relied on multitapering as described above and used a smoothing bandwidth of ±18 Hz. LFP gamma-band power was normalized per recording site through dividing by the power in the baseline period, averaged over both attention conditions. To ease comparison with LFP power, we quantified firing rates within the same time windows (±125 ms slid across the data in 20 ms steps) and normalized them per recording site through dividing by the baseline firing rate, averaged over both attention conditions. The statistical testing of the power and firing rate time courses used the same nonparametric randomization approach as for the spectra (see above), except that (1) the test statistic was the t value from a t test between conditions and across recording sites and (2) the corresponding multiple-comparison correction was across time.
Microsaccade detection.
Microsaccades (MSs) were detected according to the following procedure. Horizontal and vertical eye position recordings were low-pass filtered (<40 Hz), to remove high-frequency noise. The filtered position signals were differentiated in time to obtain velocity signals. Horizontal and vertical eye velocities were then combined to give overall eye velocity, regardless of movement direction. If this velocity exceeded 3 SDs of its mean, this was considered a saccade. Saccades that stayed within the predefined fixation window of 0.7° around the fixation point were considered MSs.
Results
Behavior
Bar releases occurred in 85.4% within 0.15–0.65 s after a target change and were therefore classified as correct responses. The two conditions with attention into the RFs or outside did not differ with respect to behavioral performance (Fig. 2A): correct responses occurred in 85.6 and 85.4% (p = 0.90, paired t test in this and all subsequent behavioral comparisons), premature bar releases occurred in 7.9 and 6.1% (p = 0.093), failures to release the bar within 650 ms after target change occurred in 6.1 and 8.4% (p = 0.085), and fixation breaks occurred in 8.4 and 8.8% (p = 0.63). Reaction times were 421 and 425 ms (p = 0.64).
Figure 2.
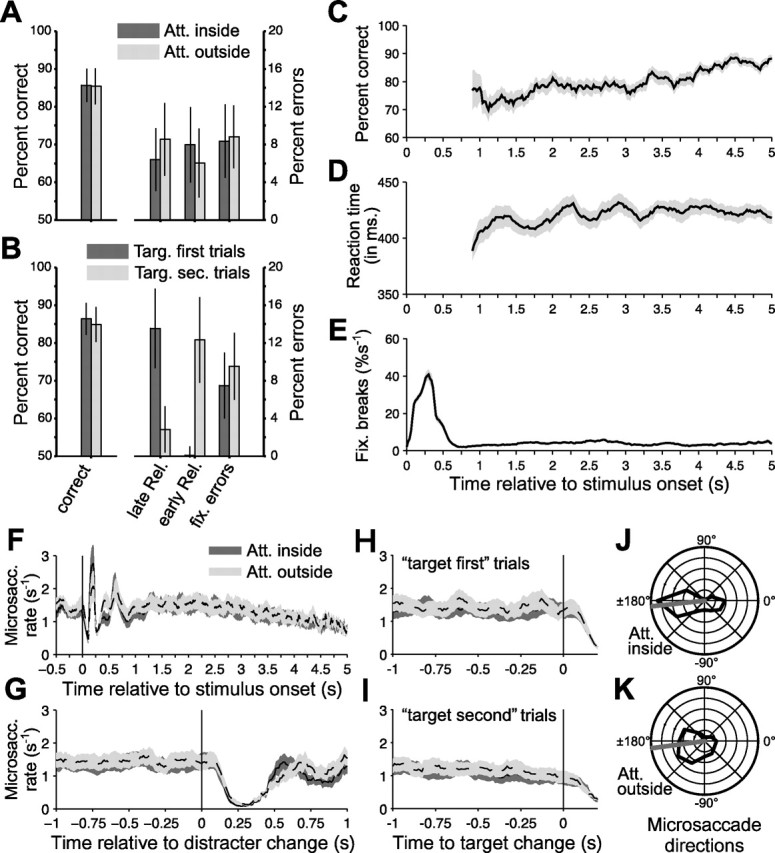
Detailed analysis of behavior. A, Left, Proportion bar releases (of all bar releases) that occurred within 0.15–0.65 s after a target change and were therefore classified as correct responses. Right, Proportion of bar releases that occurred too late or too early and of fixation breaks. Please note the two different y-axes for the left and right parts. The different shades of gray indicate trials with attention into or outside of the RF of the recorded neurons. Error bars denote the confidence range (i.e., the mean ± 1.96 SEM). B, Same analysis and format as in A, but with the trials split according to whether the target changed first or only after a distracter change. C, Proportion of correct responses as a function of time after stimulus onset. D, Behavioral response times as a function of time after stimulus onset. C and D use a sliding window of ±0.15 s. E, The rate of fixation breaks as a function of time after stimulus onset. The value shown gives the proportion of trials (as percentage of those trials that were still alive until that time after stimulus onset) that was terminated by fixation breaks. This proportion was estimated with a sliding ±0.15 s window but scaled to the rate per second. F–I, The rate of MSs as a function of time relative to stimulus onsets (F), distracter changes (G), target changes before distracter changes (H), and target changes after distracter changes (I). The MS rate was determined with a sliding window of ±0.05 s. All shaded regions around time courses show the mean ± 1 SEM. J, K, Distribution of MS directions and their mean. Att., Attention; Targ., target; Rel., release; fix., fixation; sec., second.
In any given trial, the target could change first, or it could change after a distracter change. Those trial types had the same rate of correct responses (86.4 and 84.85%; p = 0.41), but they differed in their patterns of errors (Fig. 2B). In target-first trials, errors were rarely bar releases before the target change but predominantly failures to release the bar in time. In contrast, in target-second trials, errors were rarely failures to release in time but predominantly releases before target change. Of those premature responses in target-second trials, 88% (±4% confidence range) occurred between 0.15 and 0.65 s after the distractor change and were therefore likely responses to the distracter. Moreover, target-second trials had shorter reaction times than target-first trials (417 and 439 ms; p < 0.001).
As a function of trial duration, there was a slight increase in the proportion of correct responses (Fig. 2C) but no consistent change in reaction time (Fig. 2D). (These analyses start at 0.9 s after stimulus onset, because meaningful estimations for earlier times are precluded by the earliest stimulus changes at 0.5 s and the average reaction time around 0.4 s.) Fixation breaks showed a peak in the first 0.5 s after stimulus onset and occurred at an approximately constant rate thereafter.
Finally, we investigated the rate and direction of MSs, because there is evidence of an interaction of oculomotor mechanisms and visual responses in cortex and of a role of the former in spatial attention. On average, there were 1.3 MSs per second. After stimulus onset, the MS rate showed strong perturbations (Fig. 2F): There were three clear peaks, ∼0.2, 0.4, and 0.6 s after stimulus onset, and the first of those peaks was surrounded by pronounced troughs. Thereafter, the MS rate showed a slow, smooth decline. Most importantly, at no point in time was there a significant difference in MS rate between the two attention conditions.
Stimulus (color) changes, both of the target or the distracter, also led to pronounced perturbations of the MS rate (Fig. 2G–I), although very different from the stimulus onset-related perturbations. Approximately 0.1 s after stimulus changes, the MS rate declined sharply to reach a low point with almost no MSs ∼0.25 s after stimulus change. After correctly ignored distracter changes, trials and fixation continued, and the MS rate returned to its steady-state value ∼0.5 s after the change event. After correctly reported target changes, trials and fixation control ended at the moment of bar release, such that the analysis could only reveal the postchange dip in MS rate but no potential rebound. MS directions were clearly nonuniformly distributed (Fig. 2J,K). On average, MSs moved the eye to the left and slightly downward, both when attention was inside or outside of the RFs of the neuron (average directions of −174 and −172°). It is important to note that our coherence analysis was ended at the time of the first color change (target or distracter), and thus no effects of MSs after stimulus changes could have contributed to the results.
In the following, we will concentrate on the neuronal consequences of visual stimulation and selective visual attention. Neuronal activity was analyzed for two time periods in the trial: a prestimulus period (the 1 s before stimulus onset) and for the sustained epoch with constant visual stimulation until the first stimulus change (excluding the first 300 ms after stimulus onset with response onset transients) (Fig. 1, shaded areas). These two epochs were sufficiently long to deliver enough spikes for a reliable estimate of SSC.
Effects of visual stimulation on coherence
In the prestimulus period, local oscillatory neuronal synchronization in V4 was present in several distinct frequency bands that matched well with classical frequency bands described from human encephalographic studies and animal experiments (Fig. 3, blue spectra). All measures of neuronal synchronization (the LFP power, the SFC, and the SSC) showed a peak around 10 Hz, corresponding to the classical α rhythm. In addition, SFC and SSC (and, to a lesser extent, the LFP power) showed an elevation for 2–4 Hz, straddling the lower end of the spectrum, which might correspond to a delta and/or a low-theta rhythm. Interestingly, in the prestimulus period, the classical gamma-frequency band (30–70 Hz) was not discernible in LFP power and SSC but clearly evident in the SFC.
Figure 3.
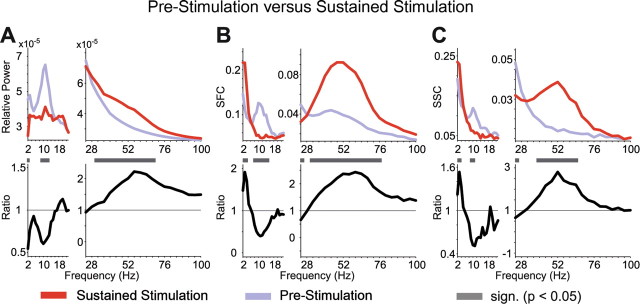
Modulation of synchronization by visual stimulation. A, Relative power of the LFP and its modulation by visual stimulation. The median relative LFP power before (blue line) and during (red line) visual stimulation (top panel) is shown; the bottom panel shows the ratio of relative LFP power before versus during visual stimulation. B, C, Same format as in A, but for SFC (B) and SSC (C). Gray bars above the bottom panels indicate statistically significant differences (p < 0.05), corrected for multiple comparisons across frequencies. Note that spectral estimation for frequencies <22 Hz was based on an effective smoothing of ±1 Hz, whereas at frequencies >22 Hz, a spectral smoothing of ±14 Hz was used for the multitaper spectral analysis (see Materials and Methods).
Visual stimulation had three main effects on this pattern of oscillatory synchronization. First, α-frequency synchronization was strongly reduced or even abolished in all three measures (Fig. 3A–C). Second, SFC and SSC at 2–4 Hz was enhanced, whereas LFP power in this band was reduced. Third, gamma-frequency synchronization was strongly enhanced as evidenced by all measures.
Coherence of V4 neuronal activity can have consequences for the impact on target areas of V4 only if it is present between V4 output spike trains, because only those travel to the next area. SSC can, in turn, have postsynaptic consequences primarily if it occurs at zero relative phase between the spike trains (i.e., if spikes occur at the same time across cells in the population). Therefore, we determined, for each pair of simultaneously recorded spike trains, their average phase relationship and compiled the distribution of these phase relationships across pairs of recording sites. We did this separately for the prestimulus period (Fig. 4, top row) and the period of sustained visual stimulation (Fig. 4, bottom row), and we restricted this analysis to those frequency bands that had shown clear rhythmic synchronization in the previous analyses. Figure 4 illustrates that SSC for all investigated periods and frequencies was mainly at zero relative phase. Please note that for each individual pair of spike recordings, the sign of the SSC phase is arbitrary, because any one recording site from the pair could be taken as the reference. Please also note that our MUA recordings most likely contained mixtures of pyramidal cells and interneurons, and it is reasonable to assume that the composition of this mixture was approximately the same across MUA recordings. Under this assumption, the relative phase between two MUAs (i.e., the phase of MUA–MUA coherence) is the same as the relative phase between the pyramidal (output) cells in the two MUAs (and also the same as the relative phase between the interneurons in the two MUAs).
Figure 4.

Phase distributions of spike–spike synchronization. Polar histograms of the mean phase relationhips of spike–spike synchronization in the prestimulus interval (top row) and during visual stimulation (bottom row) for frequencies of ∼4 Hz (A) and 10 Hz (B) and for the gamma-frequency band (C). Note that there was no clear SSC during visual stimulation in the α-frequency band. Note also that phase relationships in the gamma-band were calculated with an effective taper smoothing of ±14 Hz, whereas the lower frequencies were smoothed by ±1 Hz.
Effects of attention on coherence in the prestimulus period
In the prestimulus interval, selective attention inside the RF of the recorded neuronal population reduced α-band synchronization (Fig. 5 and middle row of Fig. 6). Interestingly, this effect reached significance for the SFC and SSC, but not for the LFP power. In the 2–4 Hz band, selective attention mainly reduced synchronization, with small differences between LFP power, SFC, and SSC with regard to the precise spectral (significance) pattern (Fig. 5 and top row of Fig. 6). In the gamma-frequency band, selective attention increased neuronal synchronization already in this prestimulus interval. This effect can be appreciated for all synchronization measures from the ratio spectra (Fig. 5, bottom row), but it reached significance only for the SFC. It appears noteworthy that, in contrast to this overall effect, recording sites with particularly high LFP power and pairs of sites with particularly high SFC coherence tended to show reduced gamma-band synchronization with selective attention into the RF, during this prestimulus interval (Fig. 6, bottom row).
Figure 5.
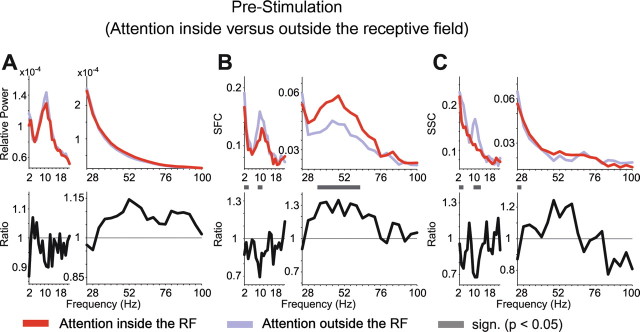
Attentional modulation of synchronization in the prestimulus period. The format is the same as in Figure 3, but showing the LFP power (A), SFC (B), and SSC (C) during the prestimulus interval, with attention directed inside (red) or outside (blue) the RF (top row) and the ratio between attentional conditions (bottom row).
Figure 6.

Distribution of synchronization measures with attention inside versus outside the RF in the prestimulus period. A, Relative LFP power at 4 Hz (top), at 10 Hz (middle), and ∼60 Hz (bottom) with attention inside (y-axis) and outside (x-axis) the RF of the recorded neuronal population. B, C, The format is the same as in A, but showing the distribution of spike–field (B) and spike–spike (C) coherence. The red cross indicates the median of the respective distributions. The insets in the bottom panels show distributions in log–log scales with x- and y-axis limits identical to the respective larger panels to enhance visualization of the distribution around dense clusters of data points.
Effects of attention on coherence in the sustained visually driven response
Extending our previous reports (Fries et al., 2001; Womelsdorf et al., 2006), selective attention into the RF during sustained stimulation enhanced gamma-band synchronization in all measures of neuronal synchronization, including the SSC (Figs. 7, 8). Notably, to demonstrate an influence of attention on SSC in the gamma-frequency range, appropriate spectral smoothing was crucial. An exploratory analysis with a spectral smoothing of ±1 Hz revealed a gamma-band peak of the SSC, averaged across all pairs of recording sites, very similar to SFC, but with too much noise in the SSC estimate for attention effects to be convincing (data not shown). This exploratory analysis suggested that the gamma-band extended approximately from 30 to 70 Hz, such that a spectral smoothing of ±14 Hz was appropriate. For lower frequencies, attention effects during this stimulation interval appeared inconsistent.
Figure 7.
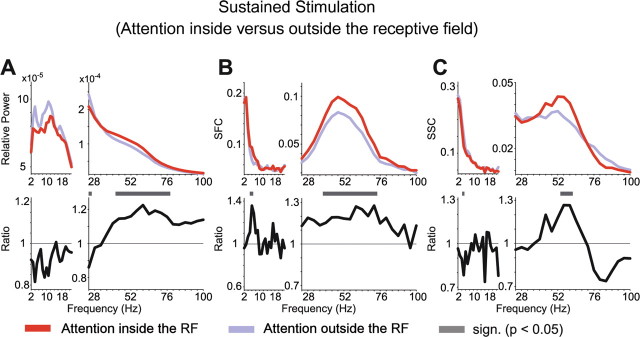
Attentional modulation of synchronization during sustained visual stimulation. The format is the same as in Figure 3, but showing the LFP power (A), SFC (B), and SSC (C) during the sustained stimulation interval, with attention directed inside (red) or outside (blue) the RF (top row) and the ratio between attentional conditions (bottom row).
Figure 8.

Distribution of synchronization in the gamma-band with attention inside versus outside the RF during sustained visual stimulation. Relative LFP power (A), spike–field coherence (B), and SSC (C) around 60 Hz when the visual stimulus was attended (y-axis) and unattended (x-axis). The red cross indicates the median of the respective distributions. The inset in C reproduces the larger panel in log scale to enhance visualization of the dense cluster of data points.
Time course of attentional modulation of synchronization and firing rates
To investigate the temporal evolution of attentional modulation of gamma-band synchronization and firing rates, we calculated both measures time resolved with identical analysis windows (±125 ms) around the time of stimulus onset and around the times of color changes of the distracter and target stimulus (see Materials and Methods). Having established above that the LFP power is a good indirect measure of SFC or SSC, at least for the gamma-band, we used the LFP gamma-band power for this time-dependent analysis. A time-dependent analysis of coherence would have been much more problematic because the variable trial lengths led to trial numbers that varied grossly as a function of time around the respective alignment events (stimulus onset, target/distracter change). Coherence has an inherent bias that depends on trial number (sample size), which would have caused a time-dependent bias in our data. Eliminating this bias by restricting the number of trials to the lowest available number across time would have grossly reduced sensitivity.
In general, attention modulated gamma-band synchronization and firing rates in close temporal correspondence (Figs. 9–12). In the prestimulus period (Fig. 9), attention into the RF enhanced LFP gamma power and elevated the firing rates. During the response onset transient, these attentional effects were reduced, but they increased again during the first few hundred milliseconds of the response and then remained approximately constant over time.
Figure 9.

Time course of attentional modulation of gamma-band synchronization and firing rates. A, LFP gamma power with attention inside (red line) and outside (blue line) the RF. B, Percentage change and statistical significance (gray bars at the bottom indicate p < 0.05, nonparametric randomization statistic, correcting for multiple comparisons across time). The format is the same as in A, but for firing rates. Norm., Normalized; rel., relative.
Figure 10.

Attentional modulation around the time of the target change in trials when this was the first stimulus change that occurred. The format is the same as in Figure 9, but showing LFP gamma-band power (A) and firing rate (B) aligned to the time of the target change when attention was directed inside (red line) and outside (blue line) the RF. Norm., Normalized; rel., relative.
Figure 11.

Attentional modulation around the time of the distracter change. The format is the same as in Figure 9, but showing LFP gamma-band power (A) and firing rate (B) aligned to the time of the distracter change in those trials when the distracter changed before the target. The colored lines show the average response when the distracter change occurred inside the RF (with attention outside the RF; blue line) and outside the RF (with attention directed inside the RF; red line). Norm., Normalized; rel., relative; distr., distracter.
Figure 12.

Attentional modulation around the time of the target change in trials when this was the second stimulus change that occurred. The format is the same as in Figure 9, but showing LFP gamma-band power (A) and firing rate (B) aligned to the time of the target change in those trials when the target changed after the distracter had already changed. The colored lines show the average response when the attended target was inside the RF (red line) or outside the RF (blue line). Note that there is a negative attention effect preceding the target change (i.e., in the time interval when the distracter was already changed; see Fig. 11), but that a positive attention effect emerges again in response to the target change (see Results). Norm., Normalized; rel., relative.
Interestingly, although the attentional effect remained approximately stable over the trial, the strength of LFP gamma power itself (per attention condition) increased steadily over the course of the trial, whereas such an increase was not present in the firing rates. This increase in LFP gamma power approximately paralleled the increase in the conditional probability that the change of the target stimulus will occur, given that it has not occurred earlier during the trial (i.e., the hazard rate; see Materials and Methods).
We next analyzed the temporal dynamics of the neuronal response around the times of the color changes of the attended (target) and ignored (distracter) stimulus. When the stimulus inside the RF of the recorded neurons was attended, then its color change resulted in a strong increase in LFP gamma power and firing rates (Fig. 10). This increase in gamma power and firing rates may have simply been a sensory response to the target color change, or it may have reflected an increase in attention, induced by the color change. In contrast, when the RF stimulus was the distracter, then a color change of the target outside the RF resulted in a decrease in LFP gamma power and firing rates to the distracter stimulus (Fig. 10). Given that there was no change in the stimulus inside the RF at this time, this effect of a target color change outside the RF may reflect some type of attentional suppression of responses to the distracter stimulus, or a withdrawal of any remaining attention directed to the distracter.
In exactly half of the trials, the distracter changed its color before the target stimulus, and this allowed us to analyze neuronal dynamics around this nonattended bottom-up change in the sensory inputs. When the stimulus inside the RF was attended, then a distracter color change outside the RF resulted in a transient decrease followed by a small transient increase in gamma power and firing rates to the RF stimulus (Fig. 11, red line). Given that there was no change in the stimulus inside the RF at this time, this effect of a distracter color change outside the RF may have been caused by a transient, automatic (bottom-up) reorienting of attention to the distracter. Conversely, when the stimulus inside the RF was the distracter, its color change resulted in a pronounced increase in gamma-band power and firing rates, with the firing rate dynamics starting earlier and being more phasic (Fig. 11, blue line). As a consequence, after the distracter change and before the target change, the distracter stimulus induced stronger LFP gamma power and higher firing rates than the attended target. Because these increases in gamma power and firing rates occurred immediately after a distracter color change inside the RF, they may have simply been stimulus-induced responses. Alternatively, they may have been caused by an automatic (bottom-up) reorienting of attention to the distracter stimulus in the RF when it changed color.
During the trials in which the distracter changed first, the target always changed later and had to be reported by the monkey for it to receive its reward. To better understand the effects of the distracter color change on the subsequent target-change responses, we therefore aligned the analysis to those target changes that followed the distracter changes (Fig. 12). This analysis confirmed that before the late target changes, the preceding distracter change induced stronger gamma-band power and firing rates than the nonchanging target (compare red with blue lines). However, when the target eventually changed color, these neural effects were rapidly reversed. The target color change caused a rapid rise in firing rates and gamma power, such that the target (red line) elicited greater firing rates and gamma power than the distracter (blue line). Conversely, when the distracter was inside the RF, then late color changes of the target outside the RF resulted in decreases of gamma-band power and firing rates to the distracter (Fig. 12, blue line).
Discussion
In summary, we found that visual stimulation reduced oscillatory synchronization of V4 neurons in the α-frequency band and enhanced synchronization in the gamma-band. Selective visual attention modulated synchronization before stimulus onset and during sustained visual stimulation. Attention reduced α-frequency synchronization and enhanced gamma-band synchronization already during the prestimulus period. During the sustained visually driven response, attention strongly enhanced gamma-band synchronization. Crucially, selective visual attention increased the precision of zero-phase gamma-band coherence among spike trains from separate groups of neurons in V4. This provides direct support for the hypothesis that synchronization could enhance the postsynaptic impact of V4 neurons driven by the attended stimulus. Furthermore, we show how the bottom-up saliency of stimulus color changes interacts with top-down attention in modulating LFP gamma power and firing rates in V4. When the target changed color, this led to an increase in gamma-band power and firing rates for the neurons driven by the target, but it led to a decrease for the neurons driven by the distracter. Conversely, when the distracter changed color, this led to an increase in gamma-band power and firing rates for the neurons driven by the distracter and a decrease for the neurons driven by the target.
The main findings of the current study support and critically extend our previous findings (Fries et al., 2001). In particular, the previous study demonstrated the existence of coherence between spike trains and field potentials and a clear attentional modulation of this SFC. In contrast, it failed to demonstrate clear coherence between spike trains or any attentional modulation thereof. Thus, the previously described SFC and its attentional modulation would have suggested SSC with a similar modulation, but the failure to actually demonstrate the latter were troublesome. The new analysis presented here was able to directly demonstrate zero-phase gamma-frequency SSC with an attentional modulation that is on the same order of magnitude as the attentional modulation of the SFC. This finding is significant, because we argue that the attentional modulation of oscillatory synchronization will have effects on postsynaptic target neurons in different cortical areas, and only the spikes will travel to those target neurons, not the field potentials.
The discrepancy between our previous failure and our present success in demonstrating gamma-band SSC is attributable to differences in data analysis. Our previous analysis used the cross-correlation histogram (CCH) [Fries et al. (2001), their supplemental information], our current analysis the coherence measure. While the CCH is defined in the time domain, coherence is defined in the frequency domain. Time domain and frequency domain analyses highlight different aspects of the data. In the time domain, a time bin provides temporal specificity but contains information from all frequencies, or, in other words, it confounds all frequencies. In the frequency domain, a frequency bin provides spectral specificity through integrating rhythmic components over time, but thereby sacrificing temporal specificity. (Time-frequency approaches are compromises between those extremes, but any given compromise still involves the same tradeoff.) Our data clearly contain several rhythmic components that show differential effects of stimulation and attention. Therefore, an analysis in the time domain, which confounds all frequencies, is problematic. This problem is aggravated by the fact that power declines strongly with frequency, such that time domain analyses are dominated by low-frequency components. In contrast, the coherence measure does not suffer from this problem, because it treats different frequencies separately.
Besides the choice between time and frequency domain analysis, another crucial factor is the appropriate level of concentration (smoothing) in the respective domain. The central operation in both correlation and coherence analysis is the multiplication between the two signals, followed by integration over multiple products. The multiplication reveals the match between the two signals, and the integration reveals the consistency of this match across samples. But this operation is only sensitive if the energy of the two signals has been sufficiently concentrated (smoothed) beforehand. This can be illustrated by the extreme example of a multiplication between two spike trains sampled at infinite temporal resolution, which will never reveal two simultaneous spikes. The gamma-band energy in our data was distributed across a band of ∼30 Hz width. Correspondingly, the coherence analysis benefited substantially from appropriate spectral concentration through multitapering (Mitra and Pesaran, 1999; Jarvis and Mitra, 2001; Pesaran et al., 2002). Figure 13 illustrates the correlation and the coherence approaches, both with and without smoothing in the respective domains, and it demonstrates that only the frequency domain coherence analysis with appropriate spectral concentration reveals (through appropriate smoothing) and isolates (through frequency decomposition) the gamma-band synchronization and its attentional modulation.
Figure 13.

The importance of frequency domain analysis with appropriate spectral concentration. The different panels show different analyses of the correlation/coherence between one example pair of MUA recordings (red, attention into the RFs of the recorded neurons; blue, attention outside the RFs of the recorded neurons; the shaded regions indicate ± 1 SEM). A, The cross-correlation function between the two MUA recordings with a temporal resolution of 1 ms. B, As in A, but after first smoothing the MUA recordings with a boxcar of 9 ms. C, The coherence spectrum between the same two MUA recordings, based on 1 s data epochs, tapered with a Hanning window. D, The coherence spectrum based on the same 1 s data epochs, but now using 29 tapers from a discrete prolate spheroidal sequence to obtain spectral concentration of ±14.5 Hz.
Besides the gamma-frequency band, we also observed synchronization and attention effects in other frequency bands. The previous report revealed prestimulus low-frequency synchronization with a single broad peak <17 Hz, which shifted to lower frequencies with visual stimulation. Although this shift suggested more than one underlying oscillatory process, those could not be resolved because of a relatively low spectral resolution. Our new analysis provided improved spectral resolution and allowed to differentiate low-frequency rhythms and to separate α-band modulation from lower-frequency rhythms at 2–4 Hz that showed differential effects of visual stimulation and of attention. We report a significant reduction in α-band synchronization with attention in the prestimulus period, similar to recent findings from scalp recordings over human sensory cortex (Worden et al., 2000; Thut et al., 2006). With regard to the 2–4 Hz synchronization, to our knowledge, this is the first demonstration of a modulation of this frequency band in visual cortex of the awake monkey. Interestingly, coherence in this band was strongly enhanced by visual stimulation. The visual stimulation with moving square-wave gratings did, for some sessions, contain temporal frequencies in the delta-frequency (2–3 Hz) range. However, the observed low-frequency synchronization is likely not attributable to this. First, it is already present before stimulus onset. Second, separate analyses that removed most of the stimulus-locked coherence had no appreciable influence on the observed delta-frequency synchronization (data not shown).
The observed selective attention effect on gamma-band synchronization adds to the growing evidence for a general role of gamma-band synchronization for a selective modulation of sensory processing (Pesaran et al., 2002; Bichot et al., 2005; Scherberger et al., 2005; Taylor et al., 2005; Sejnowski and Paulsen, 2006; Buschman and Miller, 2007). Notably, similar to a previous report (Bichot et al., 2005), we found that the temporal dynamics of gamma-band modulation closely corresponded to the time course of spike rate modulation. Both measures were not only modulated by top-down attention but were also affected by the bottom-up change of the sensory input. If the sensory event occurred in the stimulus processed by the recorded neuronal group, then LFP gamma power and spike rate were enhanced, whereas a bottom-up change outside its RF (with no change inside the RF) caused a transient reduction in activity in both measures. This finding suggests that top-down and bottom-up attention recruit the same neuronal mechanisms to enhance (reduce) the impact of neuronal groups processing salient (nonsalient) sensory information (Reynolds and Desimone, 2003; Reynolds and Chelazzi, 2004; Womelsdorf et al., 2006).
Neuronal responses to stimulus changes also had behavioral counterparts. First, after any type of stimulus color change, be it a target or a distracter change, the rate of MSs dropped markedly (Fig. 2G–I). Second, after a correctly ignored distracter change, the pattern of bar release errors was changed from mostly late releases to mostly early (premature) releases (Fig. 2B). The very similar rate (≈13%) of late releases in target-first trials and early releases in target-second trials most likely corresponds to a misallocation of attention to the distracter in this percentage of trials. The significant drop in late responses (to ≈3%) in correct target-second trials demonstrates that distracter changes were sometimes noticed and had a measurable influence on subsequent performance. To the extent that the animal paid some attention to the distracter, this would likely reduce any effects of attention on the neural response measures. Our measures of attentional effects on firing rates and coherence are therefore likely to be underestimates. After the color change, stimuli did not revert but stayed changed (i.e., the white stripes of the grating stayed yellow for the rest of the trial). This was most likely the reason why neuronal responses to yellow distracters remained enhanced until subsequent target changes (Figs. 11, 12). This sustained response increase was, however, most likely not attributable to the yellow color itself, because subsequent target changes resulted in an abrupt drop in response. Rather, the most likely explanation is featural attention to the yellow color, which was the color to be detected in the target.
The observed effects of attention on gamma-band synchronization support the hypothesis that gamma-band synchronization mechanistically subserves effective neuronal interactions within area V4, and between area V4 and projection areas (Fries, 2005). Our results show that attention led to more (less) precise spike synchronization among V4 neurons processing the behaviorally relevant (irrelevant) stimulus. Our recordings were predominantly from superficial layers, and spike output from the two superficial groups of V4 neurons, driven by the two stimuli, will converge and compete for impact on those IT neurons that contain both stimuli in their RF (Barone et al., 2000; Douglas and Martin, 2004). Previous studies have shown that already moderate increases of synchronization among synaptic inputs can enhance the impact on their postsynaptic targets markedly (Salinas and Sejnowski, 2000, 2001; Azouz and Gray, 2003; Tiesinga et al., 2004). We therefore suggest that the V4 output that is more precisely gamma-band synchronized will have a competitive advantage in influencing the activity of those IT neurons.
If IT neurons are indeed preferentially driven by the V4 input that is more synchronized, then they likely synchronize more closely to that input. As a result, IT neurons would be selectively synchronized to those V4 neurons that represent the behaviorally relevant stimulus. Such a pattern of selective interareal synchronization would likely have important mechanistic consequences for neuronal communication (Fries, 2005; Womelsdorf et al., 2007). If the postsynaptic group of IT neurons is rhythmically synchronized, then the impact of synaptic input from V4 will likely depend on the phase of the IT oscillation at which the input arrives. In this case, maximal impact could only be obtained for the V4 input that is coherent to the IT rhythm.
There are several important implications of this putative interareal synchronization. First, once the interareal coherence is established, IT neurons actively contribute to the selection of the attended input through their selective synchronization to this input. We argue that this is a conceptually new form of top-down control (which actually does not necessarily require feedback connections). Second, feedback connections from an IT neuronal group will go approximately to all those V4 neurons that send feedforward projections to this IT neuronal group. Thus, IT feedback connections will reach both “attended” and “unattended” V4 neurons unselectively. However, as much as the attention-dependent phase-locking renders IT neurons selective to input from attended V4 neurons, feedback from IT to V4 will also be rendered selective to the attended V4 neurons. Feedforward and feedback projections will differ in terms of source and target cortical layers (Barone et al., 2000; Douglas and Martin, 2004), and a layer-specific characterization of interareal synchronization and potential attention effects thereof will be an important future target. Third, if the attended stimulus moves within the RFs of the IT neurons, no extra attentional resources would be needed to make the attentional selection follow the attended stimulus. An attentional bias had been necessary at one point to give one of the V4 groups a competitive advantage in driving IT neurons and getting them phase-locked. However, once this is established, the coherence pattern between V4 and IT would likely follow a moving stimulus with the correspondingly moving neuronal activity. Fourth, to selectively route information from attended early visual neurons to any other areas in the brain, it would be sufficient if those areas would phase-lock with the IT neurons and they would implicitly become selective for attended input from earlier visual areas (Fries, 2005). Experimental tests of those predictions appear as interesting targets for future studies.
Apart from those potential consequences of gamma-band synchronization and its attentional modulation, their causes will also need to be better understood. On the one hand, the mechanisms behind gamma-band synchronization itself have been studied extensively (Bartos et al., 2007; Fries et al., 2007). In short, gamma-band synchronization is generated by interactions in neuronal networks with interneurons as key elements, and interneurons have a particularly high density in supragranular layers where most of our recordings were done (Douglas and Martin, 2004). In this context, it is interesting to note that putative interneurons show larger attention-dependent increases in absolute firing rate and in reliability than putative pyramidal cells (Mitchell et al., 2007). On the other hand, the mechanisms behind the attentional modulation of gamma-band synchronization are still unknown. Gamma-band synchronization might be enhanced by increased excitation to the generating network and/or through increased modulatory input (e.g., with acetylcholine) (Munk et al., 1996; Rodriguez et al., 2004). In the case of spatial attention, likely sources of such an input(s) are the lateral intraparietal area (Bisley and Goldberg, 2003) and/or the frontal eye field (Moore and Armstrong, 2003). Importantly, attention mediating top-down input needs, in our conceptual model, to be selective only for a coarsely defined subregion of a cortical area with an organized specificity (a “map”) for the feature dimension along which attention is defined. In our case, attention was primarily defined spatially, and attention mediating input could target the part of area V4 that corresponds to the attended location. The synchronization of the “attended V4 neurons” should then increase their impact onto the postsynaptic target neurons, despite the fact that those “attended synapses” will be intermingled with “unattended distracter synapses.”
Footnotes
This work was supported by Human Frontier Science Program Organization Grant RGP0070/2003 (P.F.), The Volkswagen Foundation Grant I/79876 (P.F.), the European Science Foundation European Young Investigator Award Program (P.F.), The Netherlands Organization for Scientific Research Grants 452-03-344 (P.F.) and 016-071-079 (T.W.), the National Institute of Mental Health Intramural Research Program (R.D.), and National Institutes of Health Grant R01-EY017292 (R.D.). We thank J. H. Reynolds, A. E. Rorie, A. F. Rossi, and R. C. Saunders for help during the experiments and P. Mitra for helpful comments.
References
- Azouz R, Gray CM. Adaptive coincidence detection and dynamic gain control in visual cortical neurons in vivo. Neuron. 2003;37:513–523. doi: 10.1016/s0896-6273(02)01186-8. [DOI] [PubMed] [Google Scholar]
- Baker CI, Behrmann M, Olson CR. Impact of learning on representation of parts and wholes in monkey inferotemporal cortex. Nat Neurosci. 2002;5:1210–1216. doi: 10.1038/nn960. [DOI] [PubMed] [Google Scholar]
- Barone P, Batardiere A, Knoblauch K, Kennedy H. Laminar distribution of neurons in extrastriate areas projecting to visual areas V1 and V4 correlates with the hierarchical rank and indicates the operation of a distance rule. J Neurosci. 2000;20:3263–3281. doi: 10.1523/JNEUROSCI.20-09-03263.2000. [DOI] [PMC free article] [PubMed] [Google Scholar]
- Bartos M, Vida I, Jonas P. Synaptic mechanisms of synchronized gamma oscillations in inhibitory interneuron networks. Nat Rev Neurosci. 2007;8:45–56. doi: 10.1038/nrn2044. [DOI] [PubMed] [Google Scholar]
- Bichot NP, Rossi AF, Desimone R. Parallel and serial neural mechanisms for visual search in macaque area V4. Science. 2005;308:529–534. doi: 10.1126/science.1109676. [DOI] [PubMed] [Google Scholar]
- Bisley JW, Goldberg ME. Neuronal activity in the lateral intraparietal area and spatial attention. Science. 2003;299:81–86. doi: 10.1126/science.1077395. [DOI] [PubMed] [Google Scholar]
- Buschman TJ, Miller EK. Top-down versus bottom-up control of attention in the prefrontal and posterior parietal cortices. Science. 2007;315:1860–1862. doi: 10.1126/science.1138071. [DOI] [PubMed] [Google Scholar]
- Chelazzi L, Miller EK, Duncan J, Desimone R. A neural basis for visual search in inferior temporal cortex. Nature. 1993;363:345–347. doi: 10.1038/363345a0. [DOI] [PubMed] [Google Scholar]
- Desimone R, Duncan J. Neural mechanisms of selective visual attention. Annu Rev Neurosci. 1995;18:193–222. doi: 10.1146/annurev.ne.18.030195.001205. [DOI] [PubMed] [Google Scholar]
- Douglas RJ, Martin KA. Neuronal circuits of the neocortex. Annu Rev Neurosci. 2004;27:419–451. doi: 10.1146/annurev.neuro.27.070203.144152. [DOI] [PubMed] [Google Scholar]
- Erickson CA, Desimone R. Responses of macaque perirhinal neurons during and after visual stimulus association learning. J Neurosci. 1999;19:10404–10416. doi: 10.1523/JNEUROSCI.19-23-10404.1999. [DOI] [PMC free article] [PubMed] [Google Scholar]
- Fries P. A mechanism for cognitive dynamics: neuronal communication through neuronal coherence. Trends Cogn Sci. 2005;9:474–480. doi: 10.1016/j.tics.2005.08.011. [DOI] [PubMed] [Google Scholar]
- Fries P, Reynolds JH, Rorie AE, Desimone R. Modulation of oscillatory neuronal synchronization by selective visual attention. Science. 2001;291:1560–1563. doi: 10.1126/science.1055465. [DOI] [PubMed] [Google Scholar]
- Fries P, Nikolić D, Singer W. The gamma cycle. Trends Neurosci. 2007;30:309–316. doi: 10.1016/j.tins.2007.05.005. [DOI] [PubMed] [Google Scholar]
- Jarvis MR, Mitra PP. Sampling properties of the spectrum and coherency of sequences of action potentials. Neural Comput. 2001;13:717–749. doi: 10.1162/089976601300014312. [DOI] [PubMed] [Google Scholar]
- Mitchell JF, Sundberg KA, Reynolds JH. Differential attention-dependent response modulation across cell classes in macaque visual area V4. Neuron. 2007;55:131–141. doi: 10.1016/j.neuron.2007.06.018. [DOI] [PubMed] [Google Scholar]
- Mitra PP, Pesaran B. Analysis of dynamic brain imaging data. Biophys J. 1999;76:691–708. doi: 10.1016/S0006-3495(99)77236-X. [DOI] [PMC free article] [PubMed] [Google Scholar]
- Moore T, Armstrong KM. Selective gating of visual signals by microstimulation of frontal cortex. Nature. 2003;421:370–373. doi: 10.1038/nature01341. [DOI] [PubMed] [Google Scholar]
- Moran J, Desimone R. Selective attention gates visual processing in the extrastriate cortex. Science. 1985;229:782–784. doi: 10.1126/science.4023713. [DOI] [PubMed] [Google Scholar]
- Munk MH, Roelfsema PR, König P, Engel AK, Singer W. Role of reticular activation in the modulation of intracortical synchronization. Science. 1996;272:271–274. doi: 10.1126/science.272.5259.271. [DOI] [PubMed] [Google Scholar]
- Pesaran B, Pezaris JS, Sahani M, Mitra PP, Andersen RA. Temporal structure in neuronal activity during working memory in macaque parietal cortex. Nat Neurosci. 2002;5:805–811. doi: 10.1038/nn890. [DOI] [PubMed] [Google Scholar]
- Reynolds JH, Chelazzi L. Attentional modulation of visual processing. Annu Rev Neurosci. 2004;27:611–647. doi: 10.1146/annurev.neuro.26.041002.131039. [DOI] [PubMed] [Google Scholar]
- Reynolds JH, Desimone R. Interacting roles of attention and visual salience in V4. Neuron. 2003;37:853–863. doi: 10.1016/s0896-6273(03)00097-7. [DOI] [PubMed] [Google Scholar]
- Reynolds JH, Chelazzi L, Desimone R. Competitive mechanisms subserve attention in macaque areas V2 and V4. J Neurosci. 1999;19:1736–1753. doi: 10.1523/JNEUROSCI.19-05-01736.1999. [DOI] [PMC free article] [PubMed] [Google Scholar]
- Rodriguez R, Kallenbach U, Singer W, Munk MH. Short- and long-term effects of cholinergic modulation on gamma oscillations and response synchronization in the visual cortex. J Neurosci. 2004;24:10369–10378. doi: 10.1523/JNEUROSCI.1839-04.2004. [DOI] [PMC free article] [PubMed] [Google Scholar]
- Salinas E, Sejnowski TJ. Impact of correlated synaptic input on output firing rate and variability in simple neuronal models. J Neurosci. 2000;20:6193–6209. doi: 10.1523/JNEUROSCI.20-16-06193.2000. [DOI] [PMC free article] [PubMed] [Google Scholar]
- Salinas E, Sejnowski TJ. Correlated neuronal activity and the flow of neural information. Nat Rev Neurosci. 2001;2:539–550. doi: 10.1038/35086012. [DOI] [PMC free article] [PubMed] [Google Scholar]
- Scherberger H, Jarvis MR, Andersen RA. Cortical local field potential encodes movement intentions in the posterior parietal cortex. Neuron. 2005;46:347–354. doi: 10.1016/j.neuron.2005.03.004. [DOI] [PubMed] [Google Scholar]
- Sejnowski TJ, Paulsen O. Network oscillations: emerging computational principles. J Neurosci. 2006;26:1673–1676. doi: 10.1523/JNEUROSCI.3737-05d.2006. [DOI] [PMC free article] [PubMed] [Google Scholar]
- Sheinberg DL, Logothetis NK. Noticing familiar objects in real world scenes: the role of temporal cortical neurons in natural vision. J Neurosci. 2001;21:1340–1350. doi: 10.1523/JNEUROSCI.21-04-01340.2001. [DOI] [PMC free article] [PubMed] [Google Scholar]
- Sigala N, Logothetis NK. Visual categorization shapes feature selectivity in the primate temporal cortex. Nature. 2002;415:318–320. doi: 10.1038/415318a. [DOI] [PubMed] [Google Scholar]
- Taylor K, Mandon S, Freiwald WA, Kreiter AK. Coherent oscillatory activity in monkey area v4 predicts successful allocation of attention. Cereb Cortex. 2005;15:1424–1437. doi: 10.1093/cercor/bhi023. [DOI] [PubMed] [Google Scholar]
- Thut G, Nietzel A, Brandt SA, Pascual-Leone A. α-Band electroencephalographic activity over occipital cortex indexes visuospatial attention bias and predicts visual target detection. J Neurosci. 2006;26:9494–9502. doi: 10.1523/JNEUROSCI.0875-06.2006. [DOI] [PMC free article] [PubMed] [Google Scholar]
- Tiesinga PH, Fellous JM, Salinas E, José JV, Sejnowski TJ. Inhibitory synchrony as a mechanism for attentional gain modulation. J Physiol (Paris) 2004;98:296–314. doi: 10.1016/j.jphysparis.2005.09.002. [DOI] [PMC free article] [PubMed] [Google Scholar]
- Womelsdorf T, Fries P, Mitra PP, Desimone R. Gamma-band synchronization in visual cortex predicts speed of change detection. Nature. 2006;439:733–736. doi: 10.1038/nature04258. [DOI] [PubMed] [Google Scholar]
- Womelsdorf T, Schoffelen JM, Oostenveld R, Singer W, Desimone R, Engel AK, Fries P. Modulation of neuronal interactions through neuronal synchronization. Science. 2007;316:1609–1612. doi: 10.1126/science.1139597. [DOI] [PubMed] [Google Scholar]
- Worden MS, Foxe JJ, Wang N, Simpson GV. Anticipatory biasing of visuospatial attention indexed by retinotopically specific α-band electroencephalography increases over occipital cortex. J Neurosci. 2000;20(RC63):1–6. doi: 10.1523/JNEUROSCI.20-06-j0002.2000. [DOI] [PMC free article] [PubMed] [Google Scholar]