

Significance
This work characterizes variation in recombination across the genome of a flowering plant in detail using unique population genomic and computational approaches. The resulting recombination map approaches nucleotide-level resolution and advances our understanding of basic properties of recombination, notably the findings of enhanced recombination near starts of genes, varying degrees of intensities of “hotspots,” higher activity in exons than introns, and that a large fraction of the genome appears devoid of any recombination activity.
Keywords: plant biology, population genetics
Abstract
Meiotic recombination rates can vary widely across genomes, with hotspots of intense activity interspersed among cold regions. In yeast, hotspots tend to occur in promoter regions of genes, whereas in humans and mice, hotspots are largely defined by binding sites of the positive-regulatory domain zinc finger protein 9. To investigate the detailed recombination pattern in a flowering plant, we use shotgun resequencing of a wild population of the monkeyflower Mimulus guttatus to precisely locate over 400,000 boundaries of historic crossovers or gene conversion tracts. Their distribution defines some 13,000 hotspots of varying strengths, interspersed with cold regions of undetectably low recombination. Average recombination rates peak near starts of genes and fall off sharply, exhibiting polarity. Within genes, recombination tracts are more likely to terminate in exons than in introns. The general pattern is similar to that observed in yeast, as well as in positive-regulatory domain zinc finger protein 9–knockout mice, suggesting that recombination initiation described here in Mimulus may reflect ancient and conserved eukaryotic mechanisms.
Meiotic recombination is a highly regulated process that enables pairing of homologous chromosomes and, by the formation of crossovers, ensures proper segregation (1). Along with mutation, drift, and selection, recombination is a critical factor in shaping genome-wide sequence variation. Recombination rates vary substantially across eukaryote genomes (2) in a manner that we are only beginning to understand. In humans and mice, the location of regions of strong recombination (“hotspots”) is largely determined by positive-regulatory domain zinc finger protein 9 (PRDM9) binding sites (3), whereas in yeast such regions are associated with nucleosome-depleted open chromatin often associated with gene promoters (4). When PRDM9 is disabled in mice, hotspots tend to relocalize to promoter regions (5). In flowering plants, at least one example of a promoter-associated hotspot has been reported (6), but it remains an open question whether this is a general tendency in plants.
The positions of crossovers and the boundaries of gene conversion tracts resulting from meiotic recombination are often imprecisely known, because they can only be identified based on the location of nearby segregating markers. Within a species, genome-wide variation in recombination rates can be determined by following the inheritance of such genetic markers in crosses or pedigrees (7–10) or by examining patterns of linkage disequilibrium within a population (11–15). Population-based approaches have the advantage that in diverse populations, hundreds of thousands of historical recombination events can be sampled, compared with only hundreds in the largest pedigrees.
The monkeyflower Mimulus guttatus has an exceptionally high nucleotide diversity, which makes it a particularly appealing system for characterizing the boundaries of recombination events. We observed an average pairwise nucleotide difference of π = 2.9% in a sample of 98 wild plants (196 haploid genomes) from four locations within a 16-km radius in the Sierra Nevada foothills in Northern California. At such high diversity, pairs of adjacent SNPs defining local haplotypes are often found on the same Illumina sequencing read (e.g., within 50 bases). Thus, short-range haplotypes can be determined cost-effectively by shotgun sequencing pooled samples rather than by sequencing each plant individually.
For a pair of nearby segregating biallelic SNPs we expect to observe only three of the four possible haplotypes unless recombination and/or parallel mutation has occurred since the originating mutations. This is the essence of Hudson’s four-gamete test (16) and allows us to identify putative boundaries of historical crossovers and gene conversion tracts (Fig. 1) to within a fraction of a read length. If this information is combined with population genetic models, local recombination rates can then be inferred (17).
Fig. 1.
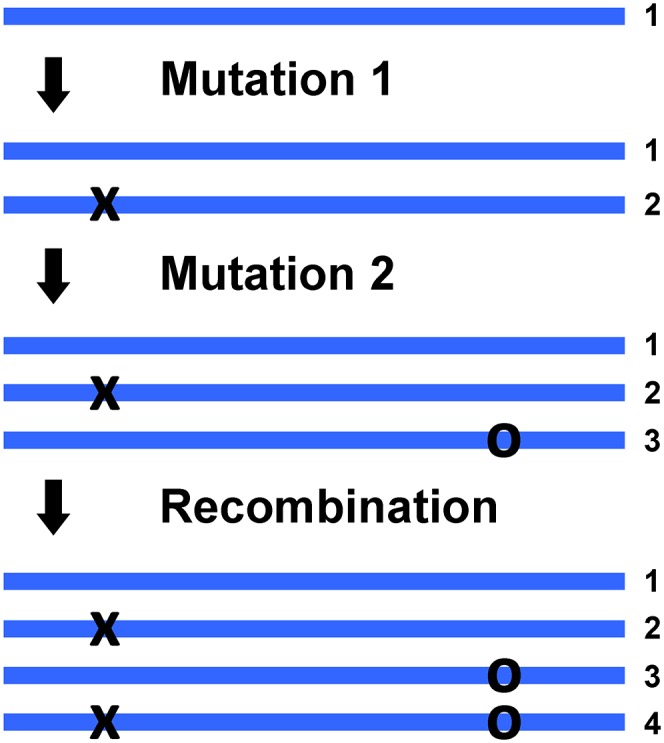
Appearance of four haplotypes at a pair of SNP loci by recombination. From a single ancestral sequence (Top) a single mutation produces a second haplotype. A second mutation at a nearby site (Middle) generates a third haplotype In the population. Finally, a recombination boundary between the two SNP loci (Bottom) generates a fourth haplotype. Note that the recombination boundary can be due to a crossover event or a gene conversion tract. A fourth haplotype can also appear due to a parallel mutation (not shown), but this scenario can be distinguished from recombination because parallel mutation at a site should not depend on the distance to the nearest SNP.
Results
With this goal in mind, we sequenced pooled population samples of M. guttatus to an average of 255X genomic coverage using Illumina. In parallel, an independent reference genome sequence for M. guttatus was assembled for the IM62 line using conventional Sanger whole-genome shotgun methods. This 322-Mb annotated reference genome is available at Phytozome (18) and described in more detail in the first four sections of the SI Text. About 111.3 million bases of the Sanger-derived reference genome were outside of repetitive regions and covered by between 58 and 450 bases of quality scores (Q) of 30 or higher from the population samples, which corresponds, on average, to sampling 50 distinct haploid genomes (SI Text, Data Analysis). We identified 9.43 million of these positions (8.5%) as “common” SNPs with minor allele frequency (MAF) of at least 5%. The folded allele frequency spectrum is well modeled by a coalescent process with an exponentially increasing effective population size (SI Text, Coalescent Simulations).
To develop a collection of nearby segregating variants suitable for our analysis we first identified all pairs of common, silent SNPs separated by 50 bp or less. To simplify comparison with coalescent models, we normalized the analysis to a sample size of 50 haplotypes per locus. Of these, 11.5 million pairs of SNPs had sufficient power for four-gamete testing in a sample of 50 [i.e., the rarest haplotype had expected frequency >1/50 in linkage equilibrium (SI Text, Data Analysis)]. We define F4 as the fraction of such SNP pairs that have all four possible haplotypes represented in the dataset. As in Hudson’s four-gamete test (16), nonzero F4 indicates the occurrence of either historical recombination between the SNPs or parallel mutation at one or both SNPs. Fig. 2 shows average F4 values as a function of distance to the nearest annotated coding DNA sequence (CDS). This value peaks immediately after the CDS starts, suggesting that the first coding exon of genes has on average nearly twice the amount of the recombination activity seen elsewhere.
Fig. 2.

Fraction F4 of nonredundant SNP pairs passing the four-gamete test, as a function of strand-dependent distance to the closest annotated CDS start.
We used coalescent simulations to convert observed F4 values into an effective recombination rate ρ, defined as the number of recombination boundaries per base per generation per haploid genome. At fixed sample size, F4 depends on (i) the minor allele frequency of the rarer SNP of the two sites, because rarer alleles typically arose more recently, and therefore chromosomes bearing these alleles have had less time to participate in recombination events; (ii) the distance between the two SNPs; and (iii) the local recombination rate ρ. Because in our study (i) and (ii) are known, we can fit the local recombination rate ρ to F4 using a lookup table based on coalescent simulations that account for the observed allele frequency spectrum.
To build intuition, it is useful to consider first how F4 is expected to vary in a simplified model for recombination. For this simplified initial analysis we use SNP pairs within 500 bp of the 5′ end of a CDS start. The reason for initially limiting ourselves to these regions is that recombination, as we have seen, is found to vary systematically relative to the positions of genes. The dependence of average F4 on allele frequency and inter-SNP separation in these regions is shown in Fig. 3. If we make the (overly simple) assumption that the 500 bp around a CDS start has a constant recombination rate ρ/μ = 3.5 for half of the predicted genes, and ρ/μ = 0 for the other half, then (using our lookup table) we find reasonable agreement (solid line) with our data (points). This rudimentary model captures the short-range linear variation and eventual saturation in F4 vs. inter-SNP separation, as well as the dependence of F4 on the lower-frequency minor allele of the SNP pair. Note that the observed F4 is small but nonzero in the limit of zero inter-SNP separation, which is consistent with a small fraction of fourth haplotypes being due to parallel mutations.
Fig. 3.

F4 vs. SNP separation for SNP pairs within 500 bp of CDS start. As predicted by simplified models (solid lines), F4 increases with distance between SNPs (dH) and with frequency of the least common allele. The y intercept is nonzero due to a modest contribution to F4 from parallel mutations.
To examine the variation of ρ in and around genes we binned all nearby SNP pairs according to their position relative to individual exons and introns in annotated genes. Fig. 4 shows the results for genes with five or more exons. As also suggested by Fig. 2, average recombination rates are highest around the start of genes and decay with distance from the gene start in both coding and noncoding sequence. This observation is known as polarity and has previously been reported in studies of specific gene conversion hotspots near the promoters of genes in yeast (4). The correlation of recombination with CDS starts in Mimulus is an average effect, because a substantial amount of recombination occurs at other genomic locations. Conversely, only a fraction of gene starts would need to overlap with hotspots for this effect to be visible, because the recombination activity in many hotspots is much higher than average. The second striking observation in Fig. 4 is that average recombination rates are higher in coding exons than in surrounding introns or UTRs. That is, crossover boundaries and/or the ends of gene conversion tracts tend to occur within exons rather than introns. Although the 3′ ends of genes also exhibit some of the same features as gene promoters, we found no excess of recombination over and above what could be accounted for by the nearby transcription starts of adjacent genes.
Fig. 4.

Average recombination rates per base relative to genes with five or more exons. Error bars show 95% confidence intervals. A gradient (polarity) in recombination is evident. Also, exons show systematically higher recombination activity than introns and 5′ noncoding sequence. Solid line shows average recombination rate within transposable elements and other complex repeats, which are mainly intergenic.
Local recombination rates vary dramatically across the genome. We analyzed sliding windows of 15 nonoverlapping pairs of SNPs (which typically span 300–350 bases) and inferred the local recombination rate ρ as that which best matches the observed F4 according to the lookup table based on coalescent simulations. Fig. 5 shows typical examples of the recombination landscape at two genomic scales. Genome-wide, 11.7% of nonoverlapping SNP pairs (414,734 of 3,557,964) pass the four-gamete test and so provide evidence for historical recombination. To reproduce this number with a constant recombination rate requires a per-base recombination rate slightly less than, but comparable to, the mutation rate (ρ/μ = 0.8, yellow line in Fig. 5). The local recombination rate per base, however, is highly variable, with peaks in intensity (hotspots) interspersed by stretches of zero detectable historic recombination activity (“cold spots”). Such cold spots account for more than 25% of the sampled genome. The remaining ∼75% exhibits varying degree of recombination; we find no sharp distinction between “hot” vs. “tepid” regions.
Fig. 5.

Inferred per-base recombination rate across a 1 Mbp region of the Mimulus genome (Upper) using sliding windows of 15 adjacent nonoverlapping SNP pairs. Yellow line shows genome-wide average (ρ/μ ∼ 0.8), and dashed line indicates an arbitrary cutoff at ρ/μ = 5 for hotspot detection. (Lower) A 60-kbp region, showing association of hotspots with 5′ ends of protein-coding genes.
Recombination rates in hotspots can be several hundred times the mutation rate, although lower-intensity hotspots are much more common. As tepid regions with ρ/μ barely larger than the genome-wide average are so much more prevalent than hotspots, any given crossover is more likely to happen in regions of modest (ρ/μ <∼1.8) but nonzero recombination, rather than in relatively sparse hotspots with ρ/μ ∼ 5–100. The observed sizes of the hot and cold features range from a few hundred (the typical resolution limit of our analysis) to a few thousand bases. In Fig. 5, Lower, hotspots with ρ/μ ≥ 5 are depicted along with the location of annotated genes in a 60-kb region. Again it can be seen that regions of high recombination activity tend to be located near the start of genes, whereas cold spots are frequently found within genes and often in close vicinity (within ∼1 kb) of hotspots. About 54% of all annotated genes have ρ/μ ≥ 2 at the start of the first exon, but only 22% have ρ/μ ≥ 5. Fig. 6 shows the genomic distribution of observed recombination rates along with data based on Monte Carlo simulations using the average value of ρ/μ = 0.8 (SI Text, Hotspot and Cold Spot Detection).
Fig. 6.

Genome-wide distribution of inferred recombination rates (red) compared with expected distribution under a constant recombination rate equal to the genomic average. Specificity increases with increasing ρ/μ at the expense of sensitivity.
If we define hotspots as local peaks with values ρ/μ ≥ 15, we detect 3,235 highly reliable hotspots (false positive rate = 3.5%). Relaxing the condition to ρ/μ ≥ 5, we observe 21,501 putative hotspots, but with a high estimated false-positive rate that suggests that only 13,000 of these are bona fide. We also cataloged 44,674 cold spots, defined as regions with ρ/μ = 0, including flanking regions with ρ/μ ≤ 0.4, and requiring lengths of at least 200 bases. The CpG to GpC dinucleotide ratio in all hotspot and cold spot associated sequences is 1.05 and 0.84, respectively. CpG deficiency is typically caused by higher mutability of the C in methylated CpG (19), suggesting that hotspots are associated with unmethylated CpG islands.
Discussion
We have developed a method for finding localized genomic signatures of historic recombination within a highly diverse natural population. The essence of our approach is applying the four-gamete test to pairs of nearby SNPs that are spanned by multiple short-sequence reads, each read sampling a short-range haplotype from the population. Importantly, plants are not sequenced or otherwise genotyped individually, but rather are sequenced in unlabeled pools.
Because our analyses rely on alignments of short reads to a somewhat divergent reference sequence, concerns naturally arise about possible mismapping-related artifacts. Our analyses are robust to such possibilities. First, we restrict analysis to reads with high mapping qualities (i.e., unambiguous alignment), require both reads of every read-pair to map properly, and discard the first and last five bases of all alignments for SNP detection purposes. In addition, we exclude sites with coverage outside a specified range. More subtle effects such as misalignments related to segmental duplications are possible but do not have significant impact on our key findings. This is evident by the observed dependence in Fig. 3 of F4 with distance (and minimum allele frequency). At the zero-distance limit, F4 is as low as 2–4%, which is quantitatively explained by parallel mutations. If a significant fraction of the underlying four-gamete test passing rates had been due to artifacts (e.g., reads mismapping between copies of an unmasked repeat in such a fashion as to simulate the presence of four distinct two-SNP haplotypes), we would expect to see no dependence on distance in any reasonable scenario.
Finally, we demonstrate in SI Text, Testing for Method Robustness, that our findings are not due to artifacts related to the faster mutation rates at CpG sites, systematic variation of allele frequencies in the genome, or miscounting of gene conversion tract boundaries due to nested SNP pairs.
The resolution of our analysis allows us to demonstrate that recombination events exhibit (i) polarity, (ii) a preference for the 5′ ends of genes, (iii) the intron–exon dependence of recombination, and (iv) association of recombination hotspots with CpG islands. In yeast, recombination-initiating double-strand breaks (DSBs) tend to occur in nucleosome-depleted open chromatin that is often located in gene promoters (20–22). The boundaries of gene conversion tracts tend to be asymmetrically located around DSBs in yeast (23), suggesting that the density of recombination boundaries should decay with distance from DSB sites. Together, these two features of recombination observed in yeast would generate the same pattern of recombination hotspots and polarity that we observe near CDS starts in Mimulus. Promoters and other cis-regulatory regions are also characterized by nucleosome-depleted open chromatin in other eukaryotes, including Arabidopsis and rice (24–26), which suggests that DSBs in these organisms may show preference for the 5′ ends of genes. Although the detailed nucleosome organization in Mimulus remains to be resolved, it is notable that we observed that hotspots are associated with CpG islands, which in Arabidopsis are also negatively correlated with nucleosome density (27).
Although our method sheds light on the workings of recombination at its finest scales, it does not provide us with sufficient information at large scales to readily reconcile our results with a standard genetic map, because two thirds of the assembled genome is unascertainable for SNP pair probes (SI Text, Data Analysis). For such regions we do not have a direct measure of the recombination rate.
Our finding of recombination variation within genes suggests that the intermediate steps in the process of recombination, such as strand displacement, DNA synthesis, and branch migration, are more likely to stall or terminate in exons than introns. It is notable that high-resolution maps of nucleosome positioning in fungi, invertebrates, mammals, and plants (27–30) consistently reveal that exons and their boundaries are enriched for well-positioned nucleosomes and RNA polymerase II, compared with introns, suggesting that well-placed nucleosomes stall RNA synthesis during transcription. Perhaps a similar mechanism tends to stall recombination intermediates in exons, resulting in the exon–intron dependence we observe here. We note that average GC content in Mimulus is 42% in exons but only 29% in introns and UTR regions, so there is also a free-energy barrier for expansion of strand displacement loops through the more GC-rich regions.
As population surveys of other species with at least 1% nucleotide diversity become available it will be interesting to see if the pattern of recombination initiation occurring in nucleosome-depleted regions is confirmed in other eukaryotes. Although DNA binding of the PRDM9 protein initiates recombination in humans and mice, this appears to be a derived mechanism in mammals that overrides a PRDM9-independent ancestral eukaryotic recombination initiation process (4) which we speculate was predominantly based on the accessibility of the recombination machinery to DNA.
Materials and Methods
Details on this analysis are described in the Supporting Information. This includes a description of the assembly and annotation of the reference genome and acquisition of the population data. A detailed account of our analysis methods and tests for robustness can also be found.
Supplementary Material
Acknowledgments
The work conducted by the US Department of Energy Joint Genome Institute is supported by the Office of Science of the US Department of Energy under Contract DE-AC02-05CH11231.
Footnotes
The authors declare no conflict of interest.
Data deposition: The sequence reported in this paper has been deposited in the Genbank database, www.ncbi.nlm.nih.gov/genbank [accession no. APLE00000000 (genome assembly and annotation)] and the Sequence Read Archive (SRA), www.ncbi.nlm.nih.gov/sra [accession nos. SRX366907, SRX366909, SRX030502, and SRX030453 (pooled population sequence)].
This article contains supporting information online at www.pnas.org/lookup/suppl/doi:10.1073/pnas.1319032110/-/DCSupplemental.
References
- 1.Keeney S, Neale MJ. Initiation of meiotic recombination by formation of DNA double-strand breaks: Mechanism and regulation. Biochem Soc Trans. 2006;34(Pt 4):523–525. doi: 10.1042/BST0340523. [DOI] [PubMed] [Google Scholar]
- 2.Petes TD. Meiotic recombination hot spots and cold spots. Nat Rev Genet. 2001;2(5):360–369. doi: 10.1038/35072078. [DOI] [PubMed] [Google Scholar]
- 3.Baudat F, et al. PRDM9 is a major determinant of meiotic recombination hotspots in humans and mice. Science. 2010;327(5967):836–840. doi: 10.1126/science.1183439. [DOI] [PMC free article] [PubMed] [Google Scholar]
- 4.Lichten M, Goldman AS. Meiotic recombination hotspots. Annu Rev Genet. 1995;29(1):423–444. doi: 10.1146/annurev.ge.29.120195.002231. [DOI] [PubMed] [Google Scholar]
- 5.Brick K, Smagulova F, Khil P, Camerini-Otero RD, Petukhova GV. Genetic recombination is directed away from functional genomic elements in mice. Nature. 2012;485(7400):642–645. doi: 10.1038/nature11089. [DOI] [PMC free article] [PubMed] [Google Scholar]
- 6.Xu X, Hsia AP, Zhang L, Nikolau BJ, Schnable PS. Meiotic recombination break points resolve at high rates at the 5′ end of a maize coding sequence. Plant Cell. 1995;7(12):2151–2161. doi: 10.1105/tpc.7.12.2151. [DOI] [PMC free article] [PubMed] [Google Scholar]
- 7.Miller DE, Takeo S, Nandanan K, Paulson A, Gogol MM, et al. A whole-chromosome analysis of meiotic recombination in Drosophila melanogaster. G3. 2012;2(2):249–260. doi: 10.1534/g3.111.001396. [DOI] [PMC free article] [PubMed] [Google Scholar]
- 8.Giraut L, et al. Genome-wide crossover distribution in Arabidopsis thaliana meiosis reveals sex-specific patterns along chromosomes. PLoS Genet. 2011;7(11):e1002354. doi: 10.1371/journal.pgen.1002354. [DOI] [PMC free article] [PubMed] [Google Scholar]
- 9.Mancera E, Bourgon R, Brozzi A, Huber W, Steinmetz LM. High-resolution mapping of meiotic crossovers and non-crossovers in yeast. Nature. 2008;454(7203):479–485. doi: 10.1038/nature07135. [DOI] [PMC free article] [PubMed] [Google Scholar]
- 10.Comeron JM, Ratnappan R, Bailin S. The many landscapes of recombination in Drosophila melanogaster. PLoS Genet. 2012;8(10):e1002905. doi: 10.1371/journal.pgen.1002905. [DOI] [PMC free article] [PubMed] [Google Scholar]
- 11.McVean G, Awadalla P, Fearnhead P. A coalescent-based method for detecting and estimating recombination from gene sequences. Genetics. 2002;160(3):1231–1241. doi: 10.1093/genetics/160.3.1231. [DOI] [PMC free article] [PubMed] [Google Scholar]
- 12.Horton MW, et al. Genome-wide patterns of genetic variation in worldwide Arabidopsis thaliana accessions from the RegMap panel. Nat Genet. 2012;44(2):212–216. doi: 10.1038/ng.1042. [DOI] [PMC free article] [PubMed] [Google Scholar]
- 13.Myers S, Bottolo L, Freeman C, McVean G, Donnelly P. A fine-scale map of recombination rates and hotspots across the human genome. Science. 2005;310(5746):321–324. doi: 10.1126/science.1117196. [DOI] [PubMed] [Google Scholar]
- 14.Kim S, et al. Recombination and linkage disequilibrium in Arabidopsis thaliana. Nat Genet. 2007;39(9):1151–1155. doi: 10.1038/ng2115. [DOI] [PubMed] [Google Scholar]
- 15.Paape T, et al. Fine-scale population recombination rates, hotspots, and correlates of recombination in the Medicago truncatula genome. Genome Biol Evol. 2012;4(5):726–737. doi: 10.1093/gbe/evs046. [DOI] [PMC free article] [PubMed] [Google Scholar]
- 16.Hudson RR, Kaplan NL. Statistical properties of the number of recombination events in the history of a sample of DNA sequences. Genetics. 1985;111(1):147–164. doi: 10.1093/genetics/111.1.147. [DOI] [PMC free article] [PubMed] [Google Scholar]
- 17.Fearnhead P, Harding RM, Schneider JA, Myers S, Donnelly P. Application of coalescent methods to reveal fine-scale rate variation and recombination hotspots. Genetics. 2004;167(4):2067–2081. doi: 10.1534/genetics.103.021584. [DOI] [PMC free article] [PubMed] [Google Scholar]
- 18.Goodstein DM, et al. Phytozome: A comparative platform for green plant genomics. Nucleic Acids Res. 2012;40(D1):D1178–D1186. doi: 10.1093/nar/gkr944. [DOI] [PMC free article] [PubMed] [Google Scholar]
- 19.Scarano E, Iaccarino M, Grippo P, Parisi E. The heterogeneity of thymine methyl group origin in DNA pyrimidine isostichs of developing sea urchin embryos. Proc Natl Acad Sci USA. 1967;57(5):1394–1400. doi: 10.1073/pnas.57.5.1394. [DOI] [PMC free article] [PubMed] [Google Scholar]
- 20.Tischfield SE, Keeney S. Scale matters: The spatial correlation of yeast meiotic DNA breaks with histone H3 trimethylation is driven largely by independent colocalization at promoters. Cell Cycle. 2012;11(8):1496–1503. doi: 10.4161/cc.19733. [DOI] [PMC free article] [PubMed] [Google Scholar]
- 21.Pan J, et al. A hierarchical combination of factors shapes the genome-wide topography of yeast meiotic recombination initiation. Cell. 2011;144(5):719–731. doi: 10.1016/j.cell.2011.02.009. [DOI] [PMC free article] [PubMed] [Google Scholar]
- 22.Berchowitz LE, Hanlon SE, Lieb JD, Copenhaver GP. A positive but complex association between meiotic double-strand break hotspots and open chromatin in Saccharomyces cerevisiae. Genome Res. 2009;19(12):2245–2257. doi: 10.1101/gr.096297.109. [DOI] [PMC free article] [PubMed] [Google Scholar]
- 23.Jessop L, Allers T, Lichten M. Infrequent co-conversion of markers flanking a meiotic recombination initiation site in Saccharomyces cerevisiae. Genetics. 2005;169(3):1353–1367. doi: 10.1534/genetics.104.036509. [DOI] [PMC free article] [PubMed] [Google Scholar]
- 24.Zhang W, Zhang T, Wu Y, Jiang J. Genome-wide identification of regulatory DNA elements and protein-binding footprints using signatures of open chromatin in Arabidopsis. Plant Cell. 2012;24(7):2719–2731. doi: 10.1105/tpc.112.098061. [DOI] [PMC free article] [PubMed] [Google Scholar]
- 25.Arabidopsis GI. Arabidopsis Genome Initiative Analysis of the genome sequence of the flowering plant Arabidopsis thaliana. Nature. 2000;408(6814):796–815. doi: 10.1038/35048692. [DOI] [PubMed] [Google Scholar]
- 26.Yu J, et al. A draft sequence of the rice genome (Oryza sativa L. ssp. indica) Science. 2002;296(5565):79–92. doi: 10.1126/science.1068037. [DOI] [PubMed] [Google Scholar]
- 27.Chodavarapu RK, et al. Relationship between nucleosome positioning and DNA methylation. Nature. 2010;466(7304):388–392. doi: 10.1038/nature09147. [DOI] [PMC free article] [PubMed] [Google Scholar]
- 28.Andersson R, Enroth S, Rada-Iglesias A, Wadelius C, Komorowski J. Nucleosomes are well positioned in exons and carry characteristic histone modifications. Genome Res. 2009;19(10):1732–1741. doi: 10.1101/gr.092353.109. [DOI] [PMC free article] [PubMed] [Google Scholar]
- 29.Brogaard K, Xi L, Wang JP, Widom J. A map of nucleosome positions in yeast at base-pair resolution. Nature. 2012;486(7404):496–501. doi: 10.1038/nature11142. [DOI] [PMC free article] [PubMed] [Google Scholar]
- 30.Jiang C, Pugh BF. A compiled and systematic reference map of nucleosome positions across the Saccharomyces cerevisiae genome. Genome Biol. 2009;10(10):R109. doi: 10.1186/gb-2009-10-10-r109. [DOI] [PMC free article] [PubMed] [Google Scholar]
Associated Data
This section collects any data citations, data availability statements, or supplementary materials included in this article.