Abstract
We have previously identified several biomarkers of hepatocellular carcinoma (HCC). The levels of three of these biomarkers were analyzed individually and in combination with the currently used marker, alpha fetoprotein (AFP), for the ability to distinguish between a diagnosis of cirrhosis (n=113) and HCC (n=164). We have utilized several novel biostatistical tools, along with the inclusion of clinical factors such as age and gender, to determine if improved algorithms could be used to increase the probability of cancer detection. Using several of these methods, we are able to detect HCC in the background of cirrhosis with an AUC of at least 0.95. The use of clinical factors in combination with biomarker values to detect HCC is discussed.
Keywords: Hepatocellular Carcinoma, biomarkers, Hepatitis B virus, logistic regression, penalized logistic regression, classification and regression trees
I INTRODUCTION
Infection with hepatitis B virus (HBV) and/or hepatitis C virus (HCV) is the major etiology of hepatocellular cancer (HCC)[1–4]. The progression of liver cancer is primarily monitored by serum levels of the oncofetal glycoprotein, alpha-fetoprotein (AFP) or the core fucosylated glycoform of AFP (AFP-L3). However, AFP can be produced under many circumstances [5–7], and is not present in all with HCC. Therefore the use of AFP as a the sole screen for HCC has been questioned [8] and more sensitive serum biomarkers for HCC are desired.
Using fucose specific lectins to identify the proteins that become fucosylated with liver disease, we have identified glycoproteins that contained increased fucosylation with HCC [9]. In the current study we have analyzed the performance of several biomarkers in 113 patients with cirrhosis and 164 patients with cirrhosis plus HCC. In an effort to maximize the detection of patients with cancer, we utilized several novel biostatistical tools to determine if improved algorithms could be used to increase the probability of cancer detection. This included combining marker values with clinical factors such as age and gender to improve diagnosis. Using several of these methods, we are able to detect HCC in the background of cirrhosis with a predictive probability of at least 0.95, which was much greater than any marker when used alone. The potential of using this combination of markers and clinical values is discussed.
II MATERIALS AND METHODS
Patients
Serum samples were obtained from Saint Louis University School of Medicine and the University of Michigan. In both cases the Institutional Review Board approved the study protocol and written informed consent was obtained from each subject. Patient and clinical information is presented in [10].
Lectin FLISA and analysis of GP73
Analysis of fucosylated A1AT and kininogen was performed as described in [10]. GP73 was analyzed by immunoblotting as described in [11].
Statistical Methods
Univariate statistical analyses were performed using the Fisher’s Exact test for categorical variables and the Mann-Whitney test for continuous variables. Univariate logistic regression analyses were also performed for each individual biomarker separately. A variety of methods were used in multivariable analyses for associating the incidence of HCC with biomarker levels and clinical/demographic variables such as age and gender. Specifically, three different but related methods were investigated in this approach – logistic regression (LR), penalized logistic regression (PLR) and Classification and Regression Trees (CART). All tests were two-sided and used a Type I Error of 0.05 to determine statistical significance.
PLR is a variant of logistic regression based on a quadratic penalty that is ideal for associating discrete factors and continuous variables such as gender, age and biomarker levels with a binary response such as HCC incidence[12]. In PLR, we maximize the log-likelihood subject to a size constraint on the L2-norm of the coefficients (excluding intercept)[12]. This penalized likelihood can be written as L(β) = −l(β) + (λ/2) ||β||22. Here, l indicates the binomial log-likelihood, β is the parameter vector and λ is a positive constant. PLR is well suited for modeling a large number of variables. Variable selection can be done using a forward stepwise approach. Different values of the penalty parameter λ were considered in our approach. PLR is implemented in the open-source R package stepPLR [13].
CART [14] is based on decision trees and is non-parametric. A decision tree is a logical model represented as a binary tree that shows how the value of a response variable can be predicted by using the values of a set of variables. If the response variable is binary such as whether a patient developed HCC or not, then a classification tree is generated that predicts the probability of developing HCC. The unified CART framework embeds recursive binary partitioning into the theory of permutation tests and is implemented in the open-source R package PARTY [13].
In order to evaluate the performance of combining multiple biomarkers and/or clinical variables, values of multiple biomarkers were inputted into the model from the appropriate method, and in each case the output (predicted value) was between 0 and 1, with 0 being cirrhosis and 1 being cancer. A cut-off of 0.5 was used for the predicted probability p and patients were classified as being HCC positive when p>=0.5, otherwise they were classified as cirrhotic (p<0.5). To determine the optimal cutoff value for each biomarker or a combination of biomarkers and/or clinical variables, Receiver Operating Characteristic (ROC) curves were constructed using all possible cutoffs for each method. Sensitivity and specificity (along with 95% confidence intervals (CI)) were used to characterize the precision of binary predictions from LR, PLR and CART. Area under the ROC curves (along with 95% CI), prediction accuracy (ACC), positive predictive value (PPV) and negative predictive value (NPV) were used to characterize the predictive value of models from these methods. Model selection within each method was done using the Akaike Information Criterion (AIC) wherever appropriate. In addition, the performance of each model was evaluated using leave-one-out cross validation (LOOCV) and threefold cross validation (3CV).
Using results from LOOCV, an ROC curve and its AUC (with 95% CI) was computed based on the predicted probabilities. This is the cross-validated AUC. In order to evaluate the performance of each model on independent data in the absence of a validation set, 3CV was used. Here, the dataset is divided randomly into three equal parts. The combined data from two parts are used to fit a model using a particular method, and this model is used to predict the HCC status of each observation in the left out part. This process is repeated for 200 random partitions of the dataset and the mean AUC (and its 95% CI) was computed.
III RESULTS AND INTERPRETATION
Univariate analyses revealed a significant association between gender and the incidence of HCC (Fisher’s Exact test p-value=0.036). The odds of HCC in males was 1.75 times higher than that in females (95% CI: (1.01,3.02)). There was also a statistically significant association between age and incidence of HCC (Mann-Whitney test p-value < 0.0001). The median age of patients with HCC was 58 years compared to 51 years for those with cirrhosis. There was no significant difference in gender or in HCC incidence between the two sites.
Data obtained across two sites were used in the analyses. In order to adjust for any potential differences in biomarker levels obtained at different sites, a dichotomous, nominal variable Site (indicating the site where the data was obtained for each observation) was incorporated into the modeling as a covariate. No statistically significant effect due to site was observed in any of the models or methods applied. For each statistical method used, four different models were considered based on the inclusion of age and gender in multivariable analysis. These are listed in Table 1. The stratified dataset consisting of males only (with or without age) was of particular importance due to the known higher incidence of HCC in male patients [2]. Whenever age was included in a multivariable model using any method, it was found to be statistically significant (data not shown).
Table 1.
Model-based performance measures (Multivariable Models)
| Method (Model) | AUC (95% CI) | ACC | PPV | NPV | AIC |
|---|---|---|---|---|---|
| LR (with age, males only) | 0.97 (0.94–0.99) | 88.39 | 91.96 | 82.60 | 93.23 |
| LR (without age, males only) | 0.92 (0.89–0.96) | 83.98 | 88.39 | 76.81 | 133.16 |
| LR (with age, gender) | 0.96 (0.94–0.98) | 88.25 | 91.03 | 84.26 | 150.55 |
| LR (without age, gender) | 0.95 (0.93–0.97) | 87.91 | 89.61 | 86.18 | 187.57 |
| PLR (λ = 0.1) (male only, with age) | 0.97 (0.95–0.99) | 88.39 | 91.96 | 82.60 | 93.26 |
| PLR (λ = 1) (male only, with age) | 0.97 (0.94–0.99) | 88.39 | 91.22 | 83.58 | 95.98 |
| PLR (λ = 10) (male only, with age) | 0.95 (0.93–0.98) | 88.39 | 90.51 | 84.62 | 111.85 |
| PLR (λ = 0.1) (male only, without age) | 0.92 (0.89–0.96) | 83.98 | 88.39 | 76.81 | 131.18 |
| PLR (λ = 1) (male only, without age) | 0.92 (0.89–0.96) | 83.42 | 88.28 | 75.71 | 132.34 |
| PLR (λ = 10) (male only, without age) | 0.91 (0.87–0.95) | 83.45 | 88.28 | 75.71 | 143.88 |
| PLR (λ = 0.1) (gender, with age) | 0.96 (0.94–0.98) | 88.25 | 91.02 | 84.25 | 148.57 |
| PLR (λ = 1) (gender, with age) | 0.96 (0.94–0.98) | 88.25 | 91.03 | 84.25 | 149.86 |
| PLR (λ = 10) (gender, with age) | 0.95 (0.93–0.98) | 88.25 | 91.58 | 83.63 | 165.44 |
| PLR (λ = 0.1) (gender,, without age) | 0.93 (0.90–0.96) | 85.98 | 89.61 | 90.90 | 183.58 |
| PLR (λ = 1) (gender, without age) | 0.93 (0.90–0.96) | 85.98 | 90.13 | 80.35 | 184.42 |
| PLR (λ = 10) (gender, without age) | 0.93 (0.90–0.96) | 84.84 | 89.93 | 78.93 | 197.43 |
| CART (with age, male only) | 0.93 (0.90–0.97) | 88.39 | 91.96 | 82.60 | NA |
| CART (without age, male only) | 0.89 (0.85–0.94) | 85.08 | 91.51 | 76.00 | NA |
| CART (with age, gender) | 0.96 (0.94–0.99) | 91.28 | 91.28 | 85.34 | NA |
| CART (without age, gender) | 0.91 (0.88–0.95) | 87.12 | 90.85 | 81.98 | NA |
In addition, no statistically significant interactions were identified in multivariable LR analyses. Results from multivariable analyses (presented in Tables 1 & 2, Figures 1–4) were compared with those from univariate LR (data not shown) applied to each individual biomarker separately. Univariate LR models performed uniformly worse than multivariable models that utilized multiple biomarkers using any of the three methods. It turns out that the best performing univariate model (GP73) produced a model-based AUC of 0.87 (95% CI (0.84, 0.91)) and ACC of 0.78, a result that fell far short of those of multivariable models, and thus emphasized the need for including multiple biomarkers and additional confounding clinical variables into the model.
Table 2.
Performance measures based on cross-validation (Multivariable Models)
| Method (Model) | LOOCV AUC (95% CI) | LOOCV ACC | 3CV AUC (95% CI) | 3CV ACC (SD) |
|---|---|---|---|---|
| LR (with age, males only) | 0.95 (0.93–0.98) | 87.29 | 0.95 (0.91–0.99) | 87.27 (4.02) |
| LR (without age, males only) | 0.91 (0.86–0.95) | 81.76 | 0.91 (0.87–0.96) | 81.76 (4.27) |
| LR (with age, gender) | 0.95 (0.92–0.97) | 87.87 | 0.95 (0.91–0.98) | 88.01 (3.11) |
| LR (without age, gender) | 0.94 (0.91–0.97) | 86.60 | 0.94 (0.91–0.97) | 85.22 (3.06) |
| PLR (λ = 0.1) (male only, with age) | 0.95 (0.93–0.98) | 87.29 | 0.95 (0.92–0.99) | 86.7 (3.39) |
| PLR (λ = 1) (male only, with age) | 0.95 (0.93–0.98) | 87.29 | 0.96 (0.92–0.99) | 87.77 (8.36) |
| PLR (λ = 10) (male only, with age) | 0.95 (0.92–0.98) | 87.29 | 0.95 (0.91–0.99) | 86.39 (3.90) |
| PLR (λ = 0.1) (male only, without age) | 0.91 (0.87–0.95) | 81.76 | 0.91 (0.86–0.96) | 81.73 (4.31) |
| PLR (λ = 1) (male only, without age) | 0.91 (0.87–0.90) | 82.32 | 0.91 (0.85–0.96) | 81.96 (4.40) |
| PLR (λ = 10) (male only, without age) | 0.90 (0.86–0.94) | 81.21 | 0.91 (0.85–0.96) | 81.80 (4.41) |
| PLR (λ = 0.1) (gender, with age) | 0.95 (0.92–0.97) | 87.87 | 0.95 (0.92–0.98) | 87.18 (3.07) |
| PLR (λ = 1) (gender, with age) | 0.95 (0.92–0.98) | 87.87 | 0.95 (0.92–0.98) | 87.99 (2.72) |
| PLR (λ = 10) (gender, with age) | 0.94 (0.92–0.97) | 86.74 | 0.94 (0.91–0.98) | 86.31 (3.07) |
| PLR (λ = 0.1) (gender,,without age) | 0.92 (0.89–0.95) | 84.46 | 0.92 (0.88–0.96) | 84.09 (3.38) |
| PLR (λ = 1) (gender, without age) | 0.92 (0.89–0.95) | 84.09 | 0.92 (0.88–0.96) | 84.41 (3.39) |
| PLR (λ = 10) (gender, without age) | 0.92 (0.89–0.95) | 84.09 | 0.92 (0.87–0.96) | 83.85 (3.38) |
| CART (with age, male only) | 0.82 (0.75–0.89) | 83.42 | 0.83 (0.74–0.93) | 81.52 (4.95) |
| CART (without age, male only) | 0.76 (0.67–0.85) | 84.53 | 0.81 (0.72–0.90) | 79.27 (5.01) |
| CART (with age, gender) | 0.87 (0.82–0.92) | 82.19 | 0.87 (0.80–0.94) | 81.91 (3.54) |
| CART (without age, gender) | 0.81 (0.75–0.86) | 79.54 | 0.86 (0.79–0.93) | 83.55 (3.91) |
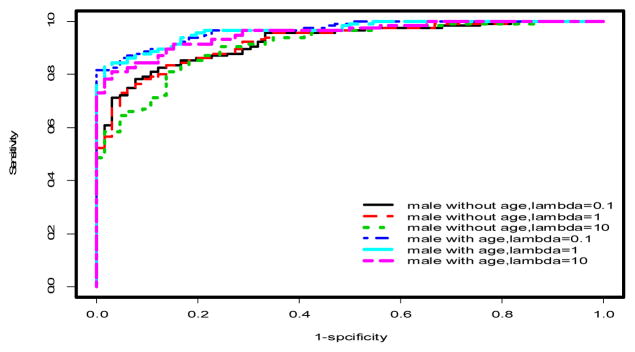
Figure 1.

ROC curves for penalized logistic regression models in males only. See Tables 1–2 and text for AUCs and more discussion.
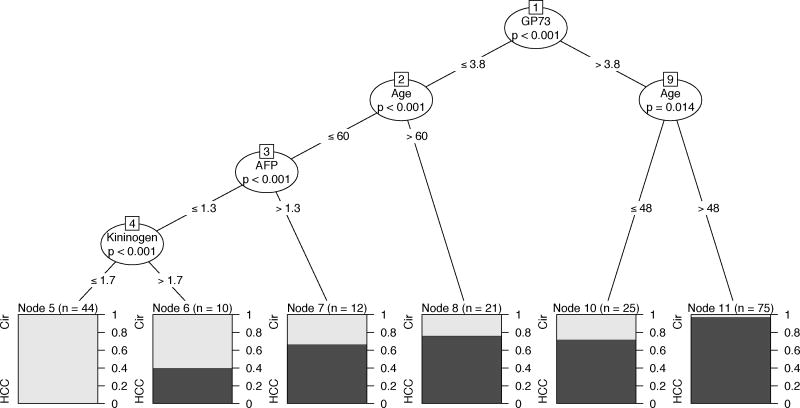
Figure 4.
CART analysis in male patients. See text and Tables 1& 2 for more details.
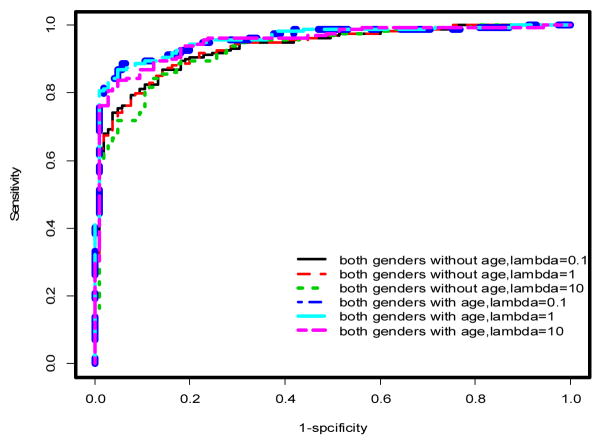
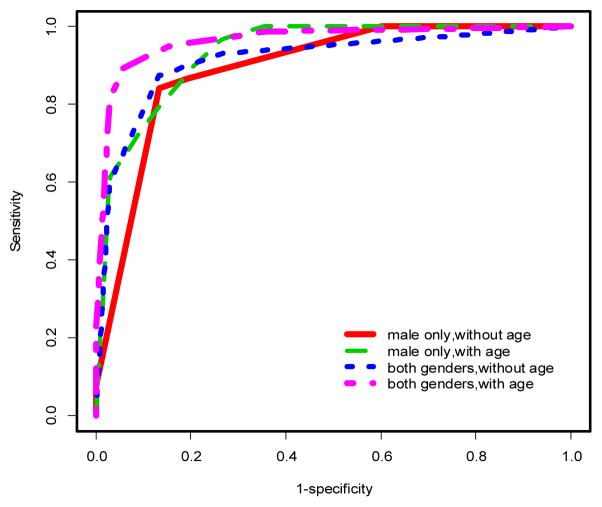
Using multivariable models, there was a significant improvement in the predictive performance of each method when age was included in the model after adjusting for gender differences compared to the model excluding age (Table 1, Figures 2 & 3). In particular, PLR and CART showed improvements in AUC (ACC) of 2.53% (2.27%) and 5% (4.16%), respectively. This difference was more pronounced when the stratified dataset consisting of only males was used in the analysis (Table 1, Figures 1 & 4). In this case, all three methods showed improvements in AUC and ACC in excess of 4%, with PLR (λ=1) showing an increase in ACC of nearly 5%. In fact, a marked improvement is observed in the predictive performance of each method based on this stratified dataset independent of whether age is included in the model. However, the inclusion of age results in the best predictive model across all methods considered (Table 1). It should also be noted that the inclusion of age results in a substantial decrease in AIC for LR and PLR (all choices of λ) both for the stratified male only dataset and when gender differences are accounted for in the model (Table 1).
Figure 2.
ROC curves for penalized logistic regression models incorporating gender. See Tables 1&2 and text for AUCs and further discussion
Figure 3.
ROC curves for CART analysis. See Tables 1&2 for more information.
Furthermore, PPV and NPV capture other critical aspects of the performance of a model. For our application, PPV represents the proportion of patients correctly predicted to have HCC while NPV represents the proportion of patients correctly predicted to have cirrhosis. A high PPV means that the model only rarely classifies a HCC patient as having cirrhosis, and is therefore a desirable characteristic in a model. Table 1 lists the best performing models and methods in terms of PPV and NPV. Once again, models that included age generally showed a higher PPV or NPV compared to those that did not. For the stratified male only data, LR and PLR (λ=0.1) resulted in a 3.57% increase in PPV with the inclusion of age while PLR (λ=10) and CART increased NPV by nearly 9% and 6.6%, respectively. For all three methods, the highest PPV (91.96%) was achieved for the stratified male only data. When gender effect was adjusted for in the model, PLR (λ=10) resulted in the maximum increase in NPV of 4.7% due to the inclusion of age.
Interpretation of CART results
Multivariable CART analysis of the complete dataset revealed that age and levels of GP73, AFP and Kininogen were significantly associated with increased incidence of HCC after controlling for site and gender. A complex interplay between the various biomarkers and age was observed. Similarly, multivariable CART analysis of the stratified (male only) data revealed that age and levels of GP73, AFP and Kininogen were significantly associated with increased incidence of HCC in males after controlling for site. Higher levels of the markers GP73 (>3.8), AFP (>1.3) and Kininogen (>1.7) were significantly associated with increased incidence of HCC (p<0.001 in all cases). These correspond to node pairs (1,9), (3,7) and (4,6), respectively, in Figure 4. Moreover, older men were identified to have a significantly higher incidence of HCC (GP73<=3.8, age>60, p=0.014 and GP73>3.8, age>48, p<0.001) corresponding to node pairs (2,8) and (9,11), respectively, in Figure 4). The highest incidence of HCC was observed in the subgroup of men with GP73>3.8 and aged over 48 years (74 patients, 72/74(97.29%) are HCC) while the lowest incidence of HCC was observed in the subgroup of men with Kininogen<=1.7 (as well as AFP<=1.3 and GP73<=3.8) under 60 years of age (44 patients, 0/44(0%) are HCC).
Predictive Performance of Multivariable Models using Cross-validation
While model based metrics such as AUC, ACC, PPV and NPV provide a measure of the predictive performance of a model, equivalent versions of these quantities based on cross-validation are based on blinded, independent datasets and therefore provide the true predictive performance of the model. Table 2 presents the AUC (with 95% CI) and ACC for each model and method used based on LOOCV and 3CV. A notable improvement in AUC is observed in models that include age across all three methods for the stratified male only data. The median value of this increase is around 5% for AUC based on LOOCV and around 4% for AUC based on 3CV. When gender is accounted for in the model, the inclusion of age also results in an improvement in AUC of about 2.5% for PLR (median value over 3 choices of λ, based on both LOOCV and 3CV) and a substantial 6% increase for CART using LOOCV. On the other hand, LR did not contribute to a significant increase in AUC (0.45 and 0.16 based on LOOCV and 3CV, respectively. In terms of prediction accuracy, significant improvement in ACC is observed in models that include age for LR and PLR for the stratified male only data. The median value of this increase is around 5.5% for ACC based on LOOCV and around 5.25% for ACC based on 3CV. When gender is accounted for in the model, the inclusion of age also results in improvements of 3.41% and 3.09% for PLR (median value over 3 choices of λ) based on both LOOCV and 3CV, respectively. These improvements are relatively smaller for LR (1.27% and 2.79%) while the performance of CART is seen to vary between models and cross-validation methods. It is clear that multivariable models using methods considered here outperform corresponding univariate models based on each individual biomarker. Moreover there is strong evidence, overall, that the predictive performance of PLR is superior to that of LR and CART.
IV SUMMARY AND DISCUSSION
In this paper, we demonstrated the usefulness of incorporating multiple biomarkers and relevant clinical variables into a statistical model for predicting the incidence of HCC. Specifically, we investigated the predictive performance of three different yet related methods, namely LR, PLR and CART, in distinguishing HCC patients from cirrhotic patients. While all three approaches provided overall improvement compared to the use of single biomarkers, our results suggested that important differences exist between these methods. For example, PLR and CART provided more significant improvements in various aspects of predictive performance compared to traditional LR. One novel aspect of our approach has been the application of CART for analyzing and interpreting biomarker data for HCC. The non-parametric approach in CART is a useful alternative to traditional parametric methods like LR and PLR. CART automatically incorporates interactions between multiple biomarkers and/or clinical variables. It provided potentially useful cut-offs for biomarkers and clinical variables alike that indicated a statistically significant association with increased HCC incidence. In that sense, CART can be seen as a complementary approach to LR and PLR and it sets the stage for further evaluation and validation of the clinical significance of these results in future, larger studies. An important finding in this study is the marked improvement in predictive performance due to the inclusion of clinical factors such as age and gender. This improvement was seen to be independent of the method used in the analysis. One of the goals in this study has been to identify a model predictive of HCC in males due to its known higher risk in this subgroup. It turned out that models based on the stratified male only subset showed the best predictive performance overall.
One possible avenue for future research on this topic would be the application of a method that borrows strength from the binary recursive partitioning approach in CART as well as the parametric approach in LR [14]. It will form the basis of our future investigation [14]. In addition, the inclusion of other clinical factors such as Alanine transaminase, Aspartate transaminase and Alkaline phosphatase levels may be able to increase performance even further. This is currently under investigation.
Footnotes
Reprinted, with permission, from Proceedings of the 2012 IEEE International Conference on Bioinformatics and Biomedicine, pp. 534-538.
References
- 1.Di Bisceglie AM. Hepatocellular carcinoma: molecular biology of its growth and relationship to hepatitis B virus infection. Med Clin North Am. 1989;73(4):985–97. doi: 10.1016/s0025-7125(16)30649-6. [DOI] [PubMed] [Google Scholar]
- 2.Block TM, Mehta AS, Fimmel CJ, Jordan R. Molecular viral oncology of hepatocellular carcinoma. Oncogene. 2003;22(33):5093–107. doi: 10.1038/sj.onc.1206557. [DOI] [PubMed] [Google Scholar]
- 3.Marrero JA. Hepatocellular carcinoma. Curr Opin Gastroenterol. 2006;22(3):248–53. doi: 10.1097/01.mog.0000218961.86182.8c. [DOI] [PubMed] [Google Scholar]
- 4.Sallie R, Di Bisceglie AM. Viral hepatitis and hepatocellular carcinoma. Gastroenterol Clin North Am. 1994;23(3):567–79. [PubMed] [Google Scholar]
- 5.Alpert ME, Uriel J, de Nechaud B. alpha fetogloblin in the diagnosis of human hepatoma. N Engl J Med. 1968;278:984–6. doi: 10.1056/NEJM196805022781804. [DOI] [PubMed] [Google Scholar]
- 6.Ruoslahti E, Salaspuro M, Pihko H, Andersson L, Seppala M. Serum alpha-fetoprotein: diagnostic significance in liver disease. Br Med J. 1974;2(918):527–9. doi: 10.1136/bmj.2.5918.527. [DOI] [PMC free article] [PubMed] [Google Scholar]
- 7.Di Bisceglie AM, Hoofnagle JH. Elevations in serum alpha-fetoprotein levels in patients with chronic hepatitis B. Cancer. 1989;64(10):2117–20. doi: 10.1002/1097-0142(19891115)64:10<2117::aid-cncr2820641024>3.0.co;2-7. [DOI] [PubMed] [Google Scholar]
- 8.Sherman M. Hepatocellular carcinoma: epidemiology, risk factors, and screening. Semin Liver Dis. 2005;25(2):143–54. doi: 10.1055/s-2005-871194. [DOI] [PubMed] [Google Scholar]
- 9.Comunale MA, Lowman M, Long RE, Krakover J, Philip R, Seeholzer S, Evans AA, Hann HWL, Block TM, Mehta AS. Proteomic analysis of serum associated fucosylated glycoproteins in the development of primary hepatocellular carcinoma. Journal of Proteome Research. 2006;6(5):308–315. doi: 10.1021/pr050328x. [DOI] [PubMed] [Google Scholar]
- 10.Wang M, Long RE, Comunale MA, Junaidi O, Marrero J, Di Bisceglie AM, Block TM, Mehta AS. Novel fucosylated biomarkers for the early detection of hepatocellular carcinoma. Cancer Epidemiol Biomarkers Prev. 2009;18(6):1914–21. doi: 10.1158/1055-9965.EPI-08-0980. [DOI] [PMC free article] [PubMed] [Google Scholar]
- 11.Marrero JA, Romano PR, Nikolaeva O, Steel L, Mehta A, Fimmel CJ, Comunale MA, D’Amelio A, Lok AS, Block TM. GP73, a resident Golgi glycoprotein, is a novel serum marker for hepatocellular carcinoma. J Hepatol. 2005;43(6):1007–12. doi: 10.1016/j.jhep.2005.05.028. [DOI] [PubMed] [Google Scholar]
- 12.Park MY, Hastie T. Penalized logistic regression for detecting gene interactions. Biostatistics. 2008;9(1):30–50. doi: 10.1093/biostatistics/kxm010. [DOI] [PubMed] [Google Scholar]
- 13.Team, R.D.C. R: A language and environment for statistical computing. R Foundation for Statistical Computing. 2005 URL http://www.R-project.org.
- 14.Hothorn T, Hornik K, Zeileis A. Unbiased recursive partitioning: A conditional inference framework. Journal of Computational and Graphical Statistics. 2006;15(3) [Google Scholar]


