

Abstract
Aims
The long-acting 8-aminoquinoline tafenoquine (TQ) coadministered with chloroquine (CQ) may radically cure Plasmodium vivax malaria. Coadministration therapy was evaluated for a pharmacokinetic interaction and for pharmacodynamic, safety and tolerability characteristics.
Methods
Healthy subjects, 18–55 years old, without documented glucose-6-phosphate dehydrogenase deficiency, received CQ alone (days 1–2, 600 mg; and day 3, 300 mg), TQ alone (days 2 and 3, 450 mg) or coadministration therapy (day 1, CQ 600 mg; day 2, CQ 600 mg + TQ 450 mg; and day 3, CQ 300 mg + TQ 450 mg) in a randomized, double-blind, parallel-group study. Blood samples for pharmacokinetic and pharmacodynamic analyses and safety data, including electrocardiograms, were collected for 56 days.
Results
The coadministration of CQ + TQ had no effect on TQ AUC0–t, AUC0–∞, Tmax or t1/2. The 90% confidence intervals of CQ + TQ vs. TQ for AUC0–t, AUC0–∞ and t1/2 indicated no drug interaction. On day 2 of CQ + TQ coadministration, TQ Cmax and AUC0–24 increased by 38% (90% confidence interval 1.27, 1.64) and 24% (90% confidence interval 1.04, 1.46), respectively. The pharmacokinetics of CQ and its primary metabolite desethylchloroquine were not affected by TQ. Coadministration had no clinically significant effect on QT intervals and was well tolerated.
Conclusions
No clinically significant safety or pharmacokinetic/pharmacodynamic interactions were observed with coadministered CQ and TQ in healthy subjects.
Keywords: chloroquine, malaria, pharmacokinetics, radical cure, tafenoquine
WHAT IS ALREADY KNOWN ABOUT THIS SUBJECT
To date, primaquine is the only treatment proven to eradicate Plasmodium vivax hypnozoites from the liver, but its 14 day treatment regimen can lead to treatment noncompliance; therefore, an agent with a shorter regimen is needed.
Tafenoquine is another 8-aminoquinoline which has been shown to be effective in eradicating P. vivax hypnozoites from the liver using shorter treatment regimens.
Tafenoquine has a terminal half-life of 2–3 weeks, is not extensively metabolized and has no effect on the pharmacokinetics of cytochrome P450 (CYP)-metabolized drugs in vivo. Chloroquine, which has a half-life of 3–8 weeks, is metabolized via CYP3A4, CYP2C8 and CYP2D6 and can cause QT prolongation.
WHAT THIS STUDY ADDS
This study determined that coadministration of tafenoquine and chloroquine was not associated with clinically relevant pharmacokinetic interactions in healthy subjects.
There were no trends for increased Fridericia's corrected QT intervals when tafenoquine was given alone, nor was there a trend for increased Fridericia's corrected QT interval when coadministered with chloroquine beyond that seen with chloroquine alone. Safety and tolerability of tafenoquine when coadministered were similar to those when tafenoquine was given alone.
This study supports further investigation of the coadministration of chloroquine and tafenoquine for the radical cure of P. vivax malaria in larger scale efficacy studies.
Introduction
The most common forms of malaria seen in humans worldwide are Plasmodium falciparum and Plasmodium vivax malaria. While P. falciparum malaria is considered the more severe form, evidence is growing to suggest that P. vivax is more prevalent in the world, with a higher risk of treatment failure, as well as resulting in severe disease syndromes similar to those attributed to P. falciparum malaria [1, 2].
Antimalarial medications are a critical aspect of global malaria management, combined with vector control and nonpharmacological strategies (e.g. indoor residual spraying of dwellings with insecticide and insecticide-treated bed nets) [3]. Antimalarials are differentiated by the stage of the Plasmodium parasite life cycle they affect. For instance, chloroquine (CQ), mefloquine, quinine and artemisinin derivatives primarily affect blood stages of infection [4, 5] and are used in the acute treatment of malaria. Mefloquine, doxycycline and atovaquone–proguanil are used for malaria prophylaxis or prevention. None of these drugs is effective against the dormant hypnozoite stage of P. vivax in the liver [2].
Primaquine is currently the only widely available drug that radically cures P. vivax malaria. It treats the blood stages and prevents relapse by eradicating the reservoir of dormant P. vivax hypnozoites in the liver [6]. When coadministered with blood schizonticidal drugs, the curative action of primaquine is potentiated [7, 8]. Hence, the standard treatment for P. vivax malaria requires combination therapy of primaquine with a blood stage schizontocide, such as CQ.
While highly effective against P. vivax, primaquine can cure malaria only if the patient is compliant with the 14 day treatment regimen, which is not often the case. In a study in Thailand, P. vivax malaria relapses occurred more frequently in patients who self-administered primaquine (12%) compared with those in the directly observed therapy group (3%) [9]. A similarly effective treatment with a shorter treatment regimen is needed.
Tafenoquine (TQ), a primaquine analogue, is a long-acting 8-aminoquinoline active against both blood and liver stages of Plasmodium (Figure 1) [10–12]. It has demonstrated efficacy as a malaria chemoprophylaxis agent [4]. Coadministered with CQ, TQ is currently being investigated as an alternative to primaquine for the radical cure of P. vivax malaria, using a short treatment course. Like primaquine, TQ has the potential to cause acute haemolytic anaemia in some individuals with inherited glucose-6-phosphate dehydrogenase (G6PD) deficiency, which occurs in regions with a high incidence of malaria [13]. Likewise, both primaquine and TQ have been shown to cause an increase in methaemoglobin levels [4, 13]. Unlike primaquine, TQ has a long plasma half-life that permits investigation of short treatment courses (1–3 days), which encourages better adherence than the 14 day primaquine regimen [4]. Completion of treatment is important in preventing relapse and reducing the reservoir of parasites in the community.
Figure 1.
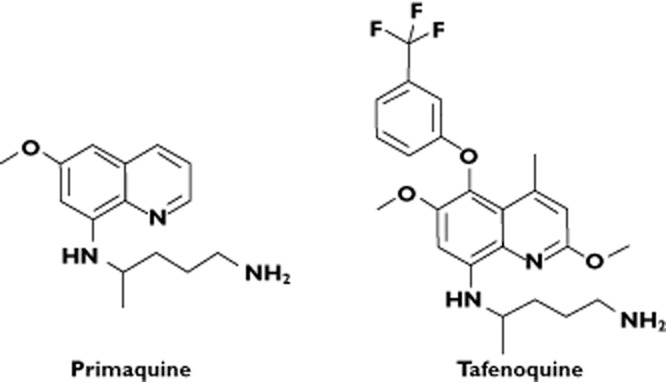
Primaquine and tafenoquine structure
In a previous clinical dose-ranging study in P. vivax patients, where CQ and TQ were administered sequentially, TQ was found to be safe and well tolerated as well as effective in preventing P. vivax relapse at all doses tested (500 mg single dose was the lowest dose administered) [14, 15]. Concomitant administration of CQ and TQ would permit a 3 day treatment course, and such a regimen is expected to improve compliance and treatment outcome, but requires the prior evaluation of the coadministration of TQ and CQ drug interaction profile. While the likelihood of a metabolic pharmacokinetic interaction was considered low, the potential for clinically relevant pharmacodynamic interactions, such as prolongation of the QT interval, a known effect of CQ [16], or additional methaemoglobinaemia beyond the effects of TQ alone could not be ruled out with preclinical evaluation alone. Thus, the present study was undertaken to assess the safety, tolerability and pharmacokinetic parameters of coadministered CQ and TQ in healthy subjects.
Methods
Study design and subjects
This was a randomized, double-blind, parallel-group study conducted at a single US site by GSK and the Medicines for Malaria Venture, with assistance from the Walter Reed Army Institute of Research (WRAIR). This study was conducted in two parts, as follows: Part 1 was a small pilot study undertaken to assure the safety of low-dose CQ (300 mg day−1 for 3 days) coadministered with TQ 900 mg (unpublished data on file; GSK, King of Prussia, PA, USA); and Part 2 was powered to compare the pharmacokinetic, pharmacodynamic and safety and tolerability characteristics, where the concomitant administration of the clinical dose of CQ (600 mg on days 1 and 2 and 300 mg on day 3) with 900 mg TQ was investigated in comparison with CQ and TQ alone. This paper reports the results of Part 2 only. An institutional review board approved the protocol (GSK protocol TAF106491; clinicaltrials.gov identifier NCT 00871156). All subjects provided written informed consent.
Eligible subjects were healthy men and women of nonchildbearing potential, 18–55 years old, weighing ≥60 kg, with a body mass index of 19–32 kg m−2. Subjects were excluded from the study for the following reasons: cardiac conduction abnormalities on 12-lead electrocardiographs (ECGs); history of cardiovascular disease or clinically significant arrhythmia; aspartate aminotransferase, alanine aminotransferase or alkaline phosphatase >1.5 times the upper limit of normal and/or total bilirubin outside the normal range at screening; documented G6PD deficiency as determined by a quantitative enzyme activity assay; history of haemoglobinopathy or methaemoglobinaemia or methaemoglobin percentage above the reference range at screening; or history of retinal eye surgery, Lasik surgery within 90 days or retinal/corneal abnormalities. Prescription and nonprescription drugs were prohibited within 7 days (14 days for enzyme inducers) or five half-lives (whichever was longer) of the first dose of study medication until study completion.
Procedures
Subjects were confined to the study unit from day −1 to day 7 and returned to the clinic for evaluation on days 10, 14, 28, 42 and 56 (follow-up). On day 1, eligible subjects were randomly assigned to one of three treatment groups (Table 1). Study medication was administered orally in the morning (day −1 and days 1–3) after a standard breakfast consisting of cereal, one cup 2% milk, one package of sugar if desired, two slices of toast with two butter pats or jam, one banana and one cup of apple juice (760 kcal, fat 31 g, carbohydrates 105 g, and protein 15 g)
Table 1.
Dosing regimens
| Cohort | n | Day 1 | Day 2 | Day 3 |
|---|---|---|---|---|
| 1 | 20 | 600 mg CQ | 600 mg CQ + placebo TQ | 300 mg CQ + placebo TQ |
| 2 | 20 | Placebo CQ | Placebo CQ + 450 mg TQ | Placebo CQ + 450 mg TQ |
| 3 | 20 | 600 mg CQ | 600 mg CQ + 450 mg TQ | 300 mg CQ + 450 mg TQ |
Abbreviations are as follows: CQ, chloroquine (as base); and TQ, tafenoquine.
Chloroquine was administered as its phosphate salt (500 mg tablets), but the CQ dose is stated as pure free base.
Measures and statistics
It was estimated that a sample size of 18 evaluable subjects per treatment group would provide precision of 16.4% for area under the plasma concentration vs. time curve (AUC) and 17.4% for maximal plasma concentration (Cmax), where precision represented the half-width of the 90% confidence intervals (CIs) for the geometric mean ratios.
Pharmacokinetics
Serial blood samples for pharmacokinetic analysis were collected into EDTA tubes on days 2 and 3 at prespecified time points. Additionally, two blood samples were collected on day 4, and single samples were collected on days 5–7, 10, 14, 28, 42 and 56. All samples were immediately placed on ice or in a refrigerator, and within 1 h after sample collection the plasma was separated using a refrigerated centrifuge (4°C) and stored at −80°C. Both TQ and CQ, as well as desethylchloroquine (DQ; the desethyl metabolite of CQ), were extracted from plasma by protein precipitation using acetonitrile. Extracts were analysed by high-pressure liquid chromatography and tandem mass spectrometry, using a TurboIonspray™ interface with positive ion multiple reaction monitoring, by the Department of Worldwide Bioanalysis, Drug Metabolism and Pharmacokinetics, GSK, Ware, Hertfordshire, UK. Isotopically labelled internal standards ([2H4, 15N]-TQ and [2H10]-DQ) were used for the analysis. This method was validated over the TQ, CQ and DQ concentration range of 2–3000 ng ml−1 with a lower limit of quantification of 2 ng ml−1 using a 50 μl aliquot of human plasma. Based on the results of the analysis of the QC samples, the bias was <15, <12.2 and <5.1% for TQ, CQ and DQ, respectively. The within-run and between-run precisions were ≤6.4 and 1.2% for tafenoquine, 11.7 and 10.4% for CQ, and 11.0 and 1.2% for DQ, respectively.
Pharmacokinetic analyses were conducted by Covance Laboratories, Inc. (Madison, WI, USA) under the direction of the Clinical Pharmacology, Modeling and Simulation Department at GSK. All participants who received study medication and provided at least one pharmacokinetic sample were included in the pharmacokinetic analyses. Actual sampling times were used to estimate TQ, CQ and DQ AUC during the 24 h dosing interval (AUC0–24), AUC from time zero to the last quantifiable time point (AUC0–t = AUC0–24 from day 2 + AUC0–t from day 3), AUC from time zero to infinity (AUC0–∞ = AUC0–24 from day 2 + AUC0–∞ from day 3), Cmax, time to Cmax (Tmax) and apparent terminal elimination half-life (t1/2) in a noncompartmental analysis performed using WinNonlin Professional Edition version 5.2 software (Pharsight Corporation, Mountain View, CA, USA). Area under the plasma concentration vs. time curves were calculated using a combination of linear and logarithmic trapezoidal methods.
Following loge transformation, the pharmacokinetic parameters of interest for TQ, CQ and DQ were evaluated when CQ and TQ were coadministered vs. when each was administered alone. To test for a pharmacokinetic interaction between TQ and CQ, an analysis of variance model was used with regimen, day and regimen-by-day interaction as fixed-effect terms and subject-within-regimen as a random-effect term for TQ, CQ and DQ AUC0–24 and Cmax. Similar analyses with a single term of regimen for TQ, CQ and DQ were conducted for AUC0–∞, AUC0–t and t1/2. Point estimates and corresponding 90% CIs were constructed for the primary assessments of interest, CQ + TQ vs. CQ and CQ + TQ vs. TQ, using the residual variance, and were back-transformed to provide point estimates and corresponding 90% CIs for the geometric mean ratios for CQ + TQ vs. CQ and CQ + TQ vs. TQ. The Tmax values of TQ, CQ and DQ were analysed with the nonparametric Wilcoxon rank sum test to compute point estimates and associated 90% CIs for the median differences of CQ + TQ vs. CQ and CQ + TQ vs. TQ. A 90% CI for the geometric mean ratios ( CQ + TQ vs. CQ and CQ + TQ vs. TQ) of the pharmacokinetic parameters of interest that excludes the ratio of one was interpreted as reflecting a statistically significant difference between test treatment (CQ + TQ) and reference treatment (CQ or TQ). A 90% CI for the geometric mean ratios (CQ + TQ : CQ or CQ + TQ : TQ) of the pharmacokinetic parameter of interest that fell within the equivalence range 0.80–1.25 was interpreted as reflecting bioequivalence of CQ + TQ and TQ alone or CQ + TQ and CQ alone and reflecting a lack of significant pharmacokinetic interaction between CQ and TQ.
Safety and tolerability
Safety and tolerability data were summarized for all subjects who received at least one dose of study medication.
Adverse events
Adverse events and serious adverse events were recorded from day 1 until the end of the confinement period. The percentages of patients with adverse events, serious adverse events and premature withdrawals because of adverse events were summarized by treatment group.
Clinical laboratory tests and vital signs
Blood samples for clinical laboratory tests (haematology and clinical chemistry) were drawn at screening and on days −1, 3, 7, 10, 14, 28 and 56. For haemoglobin levels, the threshold for clinical concern was a decrease of 2.5 g dl−1.
Vital signs were assessed with subjects in the supine position and collected at screening and on days −1, 1–7, 10, 14, 28 and 56.
Methaemoglobin
The percentage of methaemoglobin in blood was determined using a co-oximeter on days −1, 1–7, 10, 14, 28 and 56. The change in the percentage of methaemoglobin from baseline at each time point was summarized with standard descriptive statistics. Statistical analyses were performed to compare the mean change from baseline in methaemoglobin between TQ/CQ vs. TQ and TQ/CQ vs. CQ. Point estimates and corresponding 95% CIs were determined to provide a plausible range of values for the differences.
Ophthalmic assessments
The following ophthalmic tests were assessed at screening and on postdose days 28 and 56: high-contrast visual acuity test (LogMAR); colour vision test (Lanthony 40 hue); Humphrey 10-2 visual field; digital retina photography; mesopic contrast threshold; and slit lamp examination (digital corneal photography). For the high-contrast visual acuity test, an increase of ≥0.08 logMAR from baseline was the threshold for clinical concern. Ophthalmic readings were performed by The Fundus Photograph Reading Center, University of Wisconsin, Madison, WI, USA.
Pharmacodynamic assessments
Electrocardiographs were obtained using continuous 12-lead Holter monitors for QTc interval assessment after the subject rested at least 30 min in the supine position. Three 10 s intervals approximately 1 min apart were obtained for analysis on day −1 (0, 2 and 12 h), days 1 and 2 (predose and postdose hours 2 and 12), day 3 (predose and postdose hours 2, 12, 24, 48, 72 and 96), and once on days 10, 14, 28 and 56. Conduction intervals were stored electronically and evaluated by an independent cardiologist blinded to treatment group allocation.
The main electrocardiographic measure of interest was the change from baseline in QT duration corrected for heart rate by Fridericia's formula (QTcF). Changes from baseline in QTcF at multiple postdose time points were analysed with a mixed-effect model that included regimen, time and time-by-regimen interaction as fixed effects and subject as a random effect. The residual variance was used to construct point estimates and 95% CIs for the differences of CQ + TQ vs. CQ and CQ + TQ vs. TQ at each time point. Similar analyses were conducted for QT duration corrected for heart rate by Bazett's formula (QTcB).
Additionally, the percentage of patients with ECG changes of potential clinical importance, defined as absolute QTc interval >450 ms and/or increase from baseline QTc >60 ms, was calculated.
Pharmacokinetic–pharmacodynamic assessments
Graphical analyses (change from baseline QTcF vs. drug concentrations) were undertaken to examine the relationship between QT values and plasma concentrations of CQ, DQ and TQ.
Glucose 6-phosphate dehydrogenase DNA sequencing
A retrospective pharmacogenetics experiment was conducted on DNA from two subjects who experienced haemoglobin declines that met the prespecified threshold for clinical concern (decrease of ≥2.5 g dl−1). SeqWright (Houston, TX, USA) sequenced the DNA and manually identified all variants in the 13 exons and untranslated regions. The results were compared with the G6PD reference sequence (NM_001042351; http://www.ncbi.nlm.nih.gov), Single Nucleotide Polymorphism Database (http://www.ncbi.nlm.nih.gov/projects/SNP/) and literature.
Results
Demographics
Fifty-eight subjects were randomly assigned to treatment groups: 20 each in the CQ and TQ groups, and 18 in the CQ + TQ group. Two subjects in the CQ group withdrew consent for the study. One subject withdrew consent due to tinnitus, which was unrelated to treatment, after receiving one dose of CQ; this subject was replaced by a new subject. The second subject withdrew consent after the second dosing day. All 58 subjects were included in the pharmacokinetic and safety analyses. Treatment groups had similar demographic characteristics (Table 2).
Table 2.
Subject demographic characteristics
| Demographic characteristics | CQ n = 20 | TQ n = 20 | CQ/TQ n = 18 |
|---|---|---|---|
| Mean age [years (SD)] | 30.0 (12.7) | 27.0 (11.7) | 27.1 (7.6) |
| Female [n (%)] | 12 (60) | 8 (40) | 10 (56) |
| Mean BMI [kg m−2 (SD)] | 27.2 (3.0) | 26.0 (3.5) | 27.3 (3.6) |
| Race [n (%)] | |||
| African American | 9 (45) | 8 (40) | 10 (56) |
| White | 11 (55) | 11 (55) | 8 (44) |
| Other | 0 | 1 (5) | 0 |
Abbreviations are as follows: BMI, body mass index; CQ, chloroquine; and TQ, tafenoquine.
Pharmacokinetics
Coadministration of CQ and TQ did not result in significant effects on any pharmacokinetic parameter of interest for TQ, CQ or DQ (Figure 2A–C). For TQ, the 90% CI of the ratios of CQ + TQ to TQ alone for AUC0–t, AUC0–∞ and t1/2 fell within the 0.8–1.25 equivalence interval, indicating no pharmacokinetic interaction (Table 3). However, a transient increase in the Cmax and AUC0–24 (38 and 24%, respectively) of TQ was observed on day 2 during coadministration of TQ and CQ relative to TQ alone. On day 3, the effect had diminished (13 and 12%, respectively).
Figure 2.
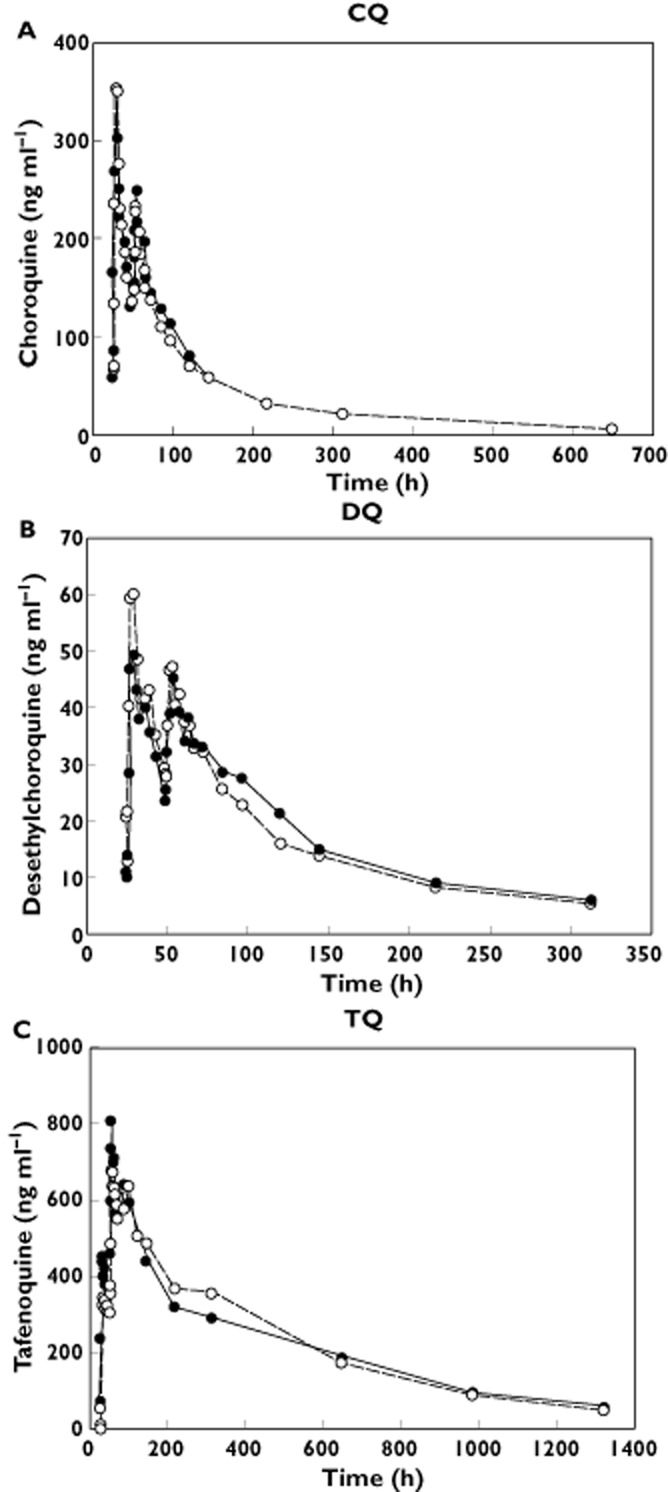
(A–C) Mean plasma concentration vs. time profiles for chloroquine (CQ), desethylchloroquine (DQ) and tafenoquine (TQ), during coadministration of tafenoquine and chloroquine.  , CQ + TQ;
  , CQ alone (A,B);
  , TQ alone (C)
Table 3.
Geometric mean (90% CI) relative bioavailability of coadministered chloroquine and tafenoquine compared with chloroquine or tafenoquine administered alone
| Treatment* | AUC0–∞ (ng h ml−1) | AUC0–t (ng h ml−1) | AUC0–24 (ng h ml−1) | Cmax (ng ml−1) | t1/2 (h) | ||
|---|---|---|---|---|---|---|---|
| Comparison: CQ/TQ vs. CQ | |||||||
| Day 2 | Day 3 | Day 2 | Day 3 | Day 3 | |||
| CQ | 1.00 (0.84, 1.18) | 0.99 (0.83, 1.18) | 0.96 (0.82, 1.13) | 1.06 (0.90, 1.24) | 0.89 (0.74, 1.08) | 1.04 (0.86, 1.25) | 0.94 (0.78, 1.12) |
| DQ | 1.19 (0.79, 1.79) | 1.08 (0.79, 1.49) | 0.89 (0.69, 1.15) | 0.97 (0.75, 1.25) | 0.85 (0.66, 1.08) | 0.92 (0.72, 1.17) | 1.20 (0.79, 1.82) |
| Comparison: CQ/TQ vs. TQ | |||||||
| TQ | 0.98 (0.84, 1.14) | 0.98 (0.85, 1.13) | 1.24 (1.04, 1.46) | 1.12 (0.94, 1.32) | 1.38 (1.17, 1.64) | 1.13 (0.96, 1.34) | 1.06 (0.94, 1.20) |
Abbreviations are as follows: AUC0–24, area under the plasma concentration vs. time curve from 0 to 24 h; AUC0–∞, area under the plasma concentration vs. time curve from zero to infinity; AUC0–t, area under the plasma concentration vs. time curve from zero to the last quantifiable time point; CI, confidence interval; Cmax, maximal concentration; CQ, chloroquine; DQ, desethylchloroquine; and TQ, tafenoquine.
Treatment regimen: CQ 600 mg on days 1 and 2 and 300 mg on day 3; TQ 450 mg on days 2 and 3; combination therapy, CQ 600 and 300 mg concomitantly administered, on days 2 and 3, respectively, with TQ 450 mg.
For both CQ and DQ, the 90% CIs of the ratios of CQ + TQ to CQ alone for AUC0–t, AUC0–24, AUC0–∞ and the day 3 Cmax fell within the 0.80–1.25 bioequivalence interval, indicating no pharmacokinetic interaction (Table 3). For DQ, wide CIs were found (between-subject coefficient of variation 43–66%) for Cmax and all AUC values because of the high between-subject variability observed for these parameters.
Safety and tolerability
Adverse events
No serious adverse events, fatalities or premature withdrawals because of adverse events were reported during the study. Common adverse events were nausea, headache, dizziness, application site erosion, diarrhoea, vomiting and abdominal pain. Gastrointestinal adverse events were more common in the CQ + TQ group (Table 4). Application site erosion events were related to the application of ECG monitoring pads.
Table 4.
Commonly reported (>5%) adverse events by treatment group
| Adverse event | CQ n = 20 (%) | TQ n = 20 (%) | CQ/TQ n = 18 (%) |
|---|---|---|---|
| Nausea | 3 (15) | 7 (35) | 8 (44) |
| Headache | 7 (35) | 3 (15) | 7 (39) |
| Dizziness | 3 (15) | 2 (10) | 6 (33) |
| Application site erosion | 1 (5) | 4 (20) | 5 (28) |
| Diarrhoea | 3 (15) | 3 (15) | 4 (22) |
| Vomiting | 3 (15) | 1 (5) | 3 (17) |
| Abdominal pain | 1 (5) | 1 (5) | 3 (17) |
Abbreviations are as follows: CQ, chloroquine; and TQ, tafenoquine.
Clinical laboratory tests and vital signs
Changes from baseline in vital signs and clinical laboratory values were similar across treatment groups and were clinically insignificant. A trend for mild declines (>1.5 to ≤2.5g dl−1) in haemoglobin were noted in a greater proportion of TQ-treated subjects compared with those treated with CQ alone (TQ 22%, TQ/CQ 17% and CQ 4%). Two African American female subjects who were both in the TQ group experienced a decrease in haemoglobin of >2.5 g dl−1 (2.8 and 3.0 g dl−1), both on day 10. In both subjects, haemoglobin values returned to baseline by day 56. At screening, both subjects had G6PD enzyme activity at the low end of the normal range (0.1169 and 0.1503 nanokatal g−1 haemoglobin), as determined by a quantitative enzyme assay.
Ophthalmic assessments
Overall, no clinically significant changes from baseline were found in macular function across treatment groups. A trend of minor declines of visual acuity in the TQ-treated group was noted; however, this study was not powered to compare differences between treatments. One TQ-treated subject had a clinically significant reduction from baseline in visual acuity at day 28 that spontaneously resolved by day 56 (logMAR scores of −0.1, 0.3 and 0, at baseline, day 28 and day 56, respectively). The subject had no retinal abnormalities, eye-related adverse events or keratopathy.
Methaemoglobin assessments
Mean values for the percentage methaemoglobin in blood increased slightly from baseline in the groups that received a TQ-containing regimen (Figure 3). Maximal mean changes from baseline were observed on day 14 (<1% CQ, 4% TQ and 6% CQ + TQ). Mean methaemoglobin values returned to baseline by day 56. Three female subjects, all in the CQ + TQ group, had elevations in percentage methaemoglobin of >10% (11.0% on day 3 for the first subject, 13.2% on day 14 for the second subject, and 12.7% on day 3 for the third subject). Values returned to normal levels by day 28 in all three subjects.
Figure 3.
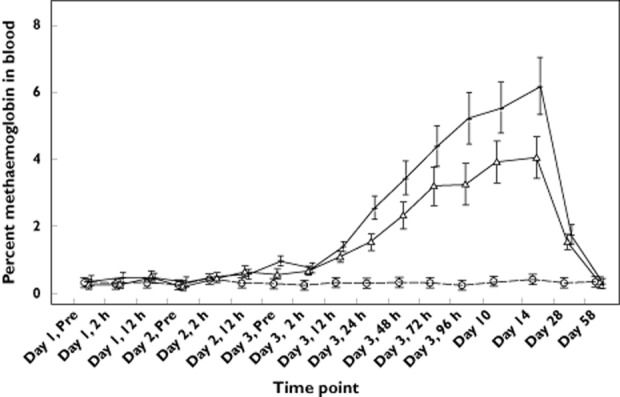
Mean (SD) percentage of methaemoglobin in blood following treatment with tafenoquine (—Δ—), chloroquine ( ) and tafenoquine + chloroquine (—+—)
Pharmacodynamics
Increased QTc intervals were observed in the CQ group, but not in the TQ group (Figure 4A,B). Increases in QTcF intervals in the CQ + TQ group were similar to those treated with CQ alone, with a maximal change from baseline of 30.7 and 26.7 ms, respectively, on day 2 at hour 12 for both groups (Figure 4A,B). On day 3, at the average Tmax at hour 2 and 12, respectively for CQ and TQ, the differences in change from baseline QTcF interval for CQ + TQ vs. CQ were similar and clinically insignificant. The corresponding values for CQ + TQ vs. TQ were comparatively greater, as expected. No subject had a QTcF >480 ms or a change from baseline ≥60 ms.
Figure 4.
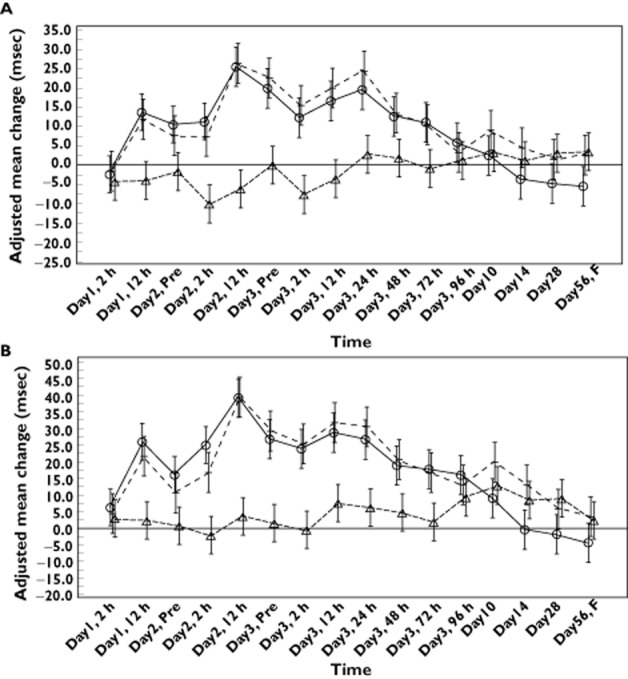
(A,B) Adjusted mean changes from baseline (95% confidence interval) in QTcF (A) and QTcB (B) during administration of tafenoquine (– – –), chloroquine (——) and tafenoquine + chloroquine
Pharmacodynamic–pharmacokinetic assessments
No apparent association was observed between TQ concentrations and change-from-baseline QTcF intervals in the TQ group, whereas higher CQ and DQ plasma concentrations were associated with increasing changes from baseline QTcF intervals in the CQ group and the CQ + TQ group (data not shown).
Glucose-6-phosphate dehydrogenase DNA sequencing
Blood samples for the two subjects who experienced a decline in haemoglobin of ≥2.5 g dl−1 underwent DNA sequencing for the 13 exons and untranslated region of the G6PD gene. Eight variant alleles for Subject ‘A’ and 11 variant alleles for Subject ‘B’ were identified compared with the G6PD reference sequence. The combination of two of the variants for Subject ‘A’, a substitution of asparagine (Asn) at amino acid position 126 with aspartic acid (Asp; Asn126Asp) and a substitution of aspartic acid with valine at amino acid position 181 (Asp181Val), is known as the G6PD A Santamaria phenotype, a G6PD World Health Organization Class 2 deficiency [17]. The combination of two of the variants for Subject ‘B’, substitution of asparagine at amino acid position 126 with aspartic acid (Asn126Asp) and substitution of valine at amino acid position 68 with methionine (Val68Met), is known as the G6PD A(–) phenotype [17], a G6PD World Health Organization Class 3 deficiency. In addition, Subject ‘B’ also had a three-base deletion in the 3′ untranslated region of exon 13. A review of the literature failed to identify any previously reported functional variants in exon 13. For both subjects, the remaining synonymous G6PD variants and those variants located in the untranslated region have not previously been reported to impact the function of G6PD.
Discussion
Preliminary data from two small studies in Thailand (n = 44 and n = 80) suggest that CQ followed by TQ can radically cure P. vivax malaria [14, 15]. Chloroquine alone is active against the blood stages of P. vivax, whereas TQ targets both blood and latent liver stages of malarial parasites. In this study, CQ was coadministered with TQ to investigate the feasibility of concomitant CQ + TQ treatment.
The results showed that coadministration of TQ and CQ did not cause a clinically significant pharmacokinetic interaction relative to administration of CQ or TQ alone. However, on day 2, a transient increase in Cmax and AUC0–24 for TQ was observed during coadministration with CQ relative to TQ alone. Adverse events were not significantly increased during this transient increase in TQ exposure. No differences were observed in TQ AUC0–∞ and t1/2 during coadministration with CQ, relative to TQ alone. Additionally, TQ had no significant effect on CQ or DQ pharmacokinetics.
Coadministration of CQ and TQ compared with CQ or TQ alone was not associated with substantially increased incidences of adverse events. In keeping with previous observations with CQ and TQ [4, 18], the most common adverse events were gastrointestinal (e.g. abdominal pain, diarrhoea, nausea and vomiting). Changes in macular function were similar across treatment groups.
The effects of coadministered CQ + TQ therapy on QT intervals was also investigated because, like other quinolines, CQ can prolong QT intervals [19]. However, despite QTc prolongation, CQ has not been reported to cause Torsade de Pointes or sudden death at clinical doses for P. vivax malaria [19]. Coadministration of CQ with TQ did not prolong the QT interval more than CQ alone. Furthermore, plasma TQ concentrations did not correlate with changes from baseline in QTcF or QTcB intervals with TQ administered alone. As expected, increasing plasma concentrations of CQ and DQ were associated with prolonged QTc intervals relative to baseline during CQ administered alone or with TQ. No clinically significant arrhythmias or changes in vital signs were observed. The lack of additional pharmacodynamic effect on the QT interval indicates that the combination of CQ + TQ poses no significant additional cardiac risk relative to CQ therapy alone.
Consistent with previous reports of 8-aminoquinolines [20, 21], methaemoglobin values in the present study increased in subjects receiving the TQ-containing regimens. Maximal increases were observed at approximately day 14, and values returned to baseline by the day 56 follow-up. The mean methaemoglobin values in the TQ and CQ + TQ groups slightly exceeded the normal range of methaemoglobinaemia reported for nonsmoking, healthy subjects (0–3%) and were generally below the range at which cyanosis is typically first observed (10–15%) and the level at which symptoms such as shortness of breath occur (>30%) [22]. A small, but statistically significant, increase in methaemoglobin was seen in subjects receiving the coadministration regimen vs. TQ alone. Additionally, all three subjects with methaemoglobin increases >10% received coadministered CQ + TQ. It is notable that these subjects were asymptomatic, despite having received a higher dose of TQ than what is likely to be used in a clinical setting. These three subjects also did not have the highest Cmax or AUC0–24 values within the CQ + TQ group. The mechanism for the increase in methaemoglobin is unknown. Drug–drug interaction studies examining methaemoglobin and haemolytic risk in G6PD deficiency are under investigation at the Walter Reed Army Institute of Research and the University of Mississippi.
A trend for mild and reversible decline in haemoglobin following administration of study treatment was observed, with a slightly higher frequency observed in the TQ groups; these changes were considered to be clinically insignificant. Transient changes in haemoglobin with TQ have been described previously [23, 24]. Two healthy, African American females who received TQ experienced a decline in haemoglobin of ≥2.5 g dl−1, meeting the threshold for clinical concern. Both subjects had fulfilled the inclusion criterion of normal G6PD enzyme activity as determined by a quantitative enzyme assay, but were in the low end of the normal range. The G6PD sequencing identified known functional G6PD variants that have previously been associated with G6PD deficiency. Therefore, decreases in haemoglobin in these two subjects may have been caused by TQ-induced haemolysis related to an underlying heterozygous G6PD deficiency that did not meet the cut-off for the G6PD enzyme assay. The relationship between TQ dose and haemolytic effect in subjects with inherited G6PD deficiency is under investigation.
In conclusion, no clinically significant pharmacokinetic interaction or pharmacodynamic interactions were observed with coadministered CQ and TQ in healthy subjects. Thus, further investigation of the combination of chloroquine and tafenoquine for the radical cure of P. vivax malaria in larger scale efficacy studies is warranted.
Acknowledgments
Funding for this study was provided by GSK and MMV (NCT00871156). All listed authors meet the criteria for authorship set forth by the International Committee for Medical Journal Editors. The authors wish to acknowledge Khadeeja Mohamed for input into the statistical design and analysis of the study. Editorial support in the form of development of the manuscript first draft, assembling tables and figures, collating author comments and referencing was provided by Jane Saiers, PhD at The WriteMedicine, Inc. Editorial suggestions to draft versions of this paper, assembling tables and figures, collating author comments and copyediting was provided by Tracey Fine, MS, ELS at Fine Biomedical Communications, Inc. All editorial support was funded by GSK. This manuscript was reviewed by the Walter Reed Army Institute for Research and the United States Army Medical Research and Material Command. There is no objection to its publication or dissemination. The opinions expressed herein are those of the authors and do not necessarily reflect the official policy, position or opinions of the Department of the Army, the Department of Defense or the US Government.
Competing Interests
GlaxoSmithKline and Medicines for Malaria Venture provided financial support for the study.
All authors have completed the Unified Competing Interest form at http://www.icmje.org/coi_disclosure.pdf (available on request from the corresponding author) and declare: AKM, SB-B, SG, EH, AH, J-PK, SS, AW and LY were employed by and received stock from GlaxoSmithKline; SD and JJM were employed by Medicines for Malaria Venture in the previous 3 years; and APB was previously employed by GlaxoSmithKline.
References
- 1.Baird JK. Resistance to therapies for infection by Plasmodium vivax. Clin Microbiol Rev. 2009;22:508–534. doi: 10.1128/CMR.00008-09. [DOI] [PMC free article] [PubMed] [Google Scholar]
- 2.Wells TNC, Burrows JN, Baird JK. Targeting the hypnozoite reservoir of Plasmodium vivax: the hidden obstacle to malaria elimination. Trends Parasitol. 2010;26:145–151. doi: 10.1016/j.pt.2009.12.005. [DOI] [PubMed] [Google Scholar]
- 3.Pluess B, Tanser FC, Lengeler C, Sharp BL. Indoor residual spraying for preventing malaria. Cochrane Database Syst Rev. 2010;(5) doi: 10.1002/14651858.CD006657.pub2. [DOI] [PMC free article] [PubMed] [Google Scholar]
- 4.Crockett M, Kain KC. Tafenoquine: a promising new antimalarial agent. Expert Opin Investig Drugs. 2007;16:705–715. doi: 10.1517/13543784.16.5.705. [DOI] [PubMed] [Google Scholar]
- 5.Douglas NM, Anstey NM, Angus BJ, Nosten F, Price RN. Artemisinin combination therapy for vivax malaria. Lancet Infect Dis. 2010;10:405–416. doi: 10.1016/S1473-3099(10)70079-7. [DOI] [PMC free article] [PubMed] [Google Scholar]
- 6.Mueller I, Galinski MR, Baird JK, Chelton JM, Kochar DK, Alonso PL, del Portillo HA. Key gaps in the knowledge of Plasmodium vivax, a neglected human malaria parasite. Lancet Infect Dis. 2009;9:555–566. doi: 10.1016/S1473-3099(09)70177-X. [DOI] [PubMed] [Google Scholar]
- 7.Alving AS, Arnold J, Hockwald RS, Clayton CB, Dern RJ, Beutler E, Flanagan CL. Potentiation of the curative action of primaquine in vival malaria by quinine and chloroquine. J Lab Clin Med. 1955;46:301–306. [PubMed] [Google Scholar]
- 8.Baird JK. Resistance to chloroquine unhinges vivax malaria therapeutics. Antimicrob Agents Chemother. 2011;55:1827–1830. doi: 10.1128/AAC.01296-10. [DOI] [PMC free article] [PubMed] [Google Scholar]
- 9.Takeuchi R, Lawpoolsri S, Imwong M, Kobayashi J, Kaewkungwal J, Pukrittayakamee S, Puangsa-art S, Thanyavanich N, Maneeboonyang W, Day NP, Singhasivanon P. Directly-observed therapy (DOT) for the radical 14-day primaquine treatment of Plasmodium vivax malaria on the Thai-Myanmar border. Malar J. 2010;9:308–315. doi: 10.1186/1475-2875-9-308. [DOI] [PMC free article] [PubMed] [Google Scholar]
- 10.Pradines B, Mamfoumbi MM, Tall A, Sokhna C, Koeck JL, Fusai T, Mosnier J, Czarnecki E, Spiegel A, Trape JF, Kombila M, Rogier C. In vitro activity of tafenoquine against the asexual stages of Plasmodium falciparum isolates from Gabon, Senegal, and Djibouti. Antimicrob Agents Chemother. 2006;50:3225–3226. doi: 10.1128/AAC.00777-06. [DOI] [PMC free article] [PubMed] [Google Scholar]
- 11.Coleman RE, Clavin AM, Milhous WK. Gametocytocidal and sporontocidal activity of antimalarials against Plasmodium berghei ANKA in ICR mice and Anopheles stephensi mosquitoes. Am J Trop Med Hyg. 1992;46:169–182. doi: 10.4269/ajtmh.1992.46.169. [DOI] [PubMed] [Google Scholar]
- 12.Vennerstrom JL, Nuzum EO, Miller RE, Dorn A, Gerena L, Dande PA, Ellis WY, Ridley RG, Milhous WK. 8-aminoquinolines active against blood stage Plasmodium falciparum in vitro inhibit hematin polymerization. Antimicrob Agents Chemother. 1999;43:598–02. doi: 10.1128/aac.43.3.598. [DOI] [PMC free article] [PubMed] [Google Scholar]
- 13.Vale N, Moreira R, Gomes P. Primaquine revisited six decades after its discovery. Eur J Med Chem. 2009;44:937–953. doi: 10.1016/j.ejmech.2008.08.011. [DOI] [PubMed] [Google Scholar]
- 14.Walsh DS, Looareesuwan S, Wilairatana P, Heppner DG, Jr, Tang DB, Brewer TG, Chokejindachai W, Viriyavejakul P, Kyle DE, Milhouse WK, Schuster BG, Horton J, Braitman DJ, Brueckner RP. Randomized dose-ranging study of the safety and efficacy of WR 238605 (tafenoquine) in the prevention of relapse of Plasmodium vivax Malaria in Thailand. J Infect Dis. 1999;180:1282–1287. doi: 10.1086/315034. [DOI] [PubMed] [Google Scholar]
- 15.Walsh DS, Wilairatana P, Tang DB, Heppner DG, Jr, Brewer TG, Krudsood S, Silachamroon U, Phumratanaprapin W, Siriyanonda D, Looareesuwan S. Randomized trial of 3-dose regimens of tafenoquine (WR238605) versus low-dose primaquine for preventing Plasmodium vivax malaria relapse. Clin Infect Dis. 2004;29:1095–1103. doi: 10.1086/424508. [DOI] [PubMed] [Google Scholar]
- 16.Mzayek F, Deng H, Mather FJ, Wasilevich EC, Liu H, Hadi CM, Chansolme DH, Murphy HA, Melek BH, Tenaglia AN, Mushatt DM, Dreisbach AW, Lertora JJL, Krogstad DJ. Randomization dose-ranging controlled trial of AQ-13, a candidate antimalarialm and chloroquine in healthy volunteers. PLoS Clin Trials. 2007;6:1–17. doi: 10.1371/journal.pctr.0020006. [DOI] [PMC free article] [PubMed] [Google Scholar]
- 17.Beutler E, Kuhl W, Sáenz GF, Rodriguez W. Mutation analysis of glucose 6-phosphate dehydrogenase (G6PD) variants in Costa Rica. Hum Genet. 1991;87:462–464. doi: 10.1007/BF00197169. [DOI] [PubMed] [Google Scholar]
- 18.Nasveld PE, Edstein MD, Reid M, Brennan L, Harris IE, Kitchner SJ, Leggat PA, Pickford P, Kerr C, Ohrt C, Prescott W. Randomized, double-blind study of the safety, tolerability, and efficacy of tafenoquine versus mefloquine for malaria prophylaxis in nonimmune subjects. Antimicrob Agents Chemother. 2010;54:792–798. doi: 10.1128/AAC.00354-09. [DOI] [PMC free article] [PubMed] [Google Scholar]
- 19.White NJ. Cardiotoxicity of antimalarial drugs. Lancet Infect Dis. 2007;7:549–558. doi: 10.1016/S1473-3099(07)70187-1. [DOI] [PubMed] [Google Scholar]
- 20.Guerin PJ, Olliaro P, Nosten F, Druilhe P, Laxminaryan R, Binka F, Kilama WL, Ford N, White NJ. Malaria: current status of control, diagnosis, treatment, and a proposed agenda for research and development. Lancet Infect Dis. 2002;2:564–573. doi: 10.1016/s1473-3099(02)00372-9. [DOI] [PubMed] [Google Scholar]
- 21.Srivastava P, Singh S, Jain GK, Puri SK, Pandey VC. A simple and rapid evaluation of methemoglobin toxicity of 8-aminoquinolines and related compounds. Ecotoxicol Environ Saf. 2000;45:236–239. doi: 10.1006/eesa.1999.1868. [DOI] [PubMed] [Google Scholar]
- 22.Benz EJ. Hemoglobin variants associated with hemolytic anemia, altered oxygen affinity, and methemoglobinemias. In: Hoffman R, editor. Hematology: Basic Principles and Practice. Philadelphia, PA: Churchill Livingstone, Inc; 2005. pp. 645–652. [Google Scholar]
- 23.Lell B, Faucher JF, Missinou MA, Borrmann S, Dangelmaier O, Horton J, Kremsner PG. Malaria chemoprophylaxis with tafenoquine: a randomized study. Lancet. 2000;355:2041–2045. doi: 10.1016/S0140-6736(00)02352-7. [DOI] [PubMed] [Google Scholar]
- 24.Hale BR, Owusu-Agyei S, Fryauff DJ, Koram KH, Adjuik M, Oduro AR, Prescott WR, Baird JK, Nkrumah F, Ritchie TL, Franke ED, Binka FN, Horton J, Hoffman SL. A randomized, double-blind, placebo-controlled, dose-ranging trial of tafenoquine for weekly prophylaxis against Plasmodium falciparum. Clin Infect Dis. 2003;36:541–549. doi: 10.1086/367542. [DOI] [PubMed] [Google Scholar]